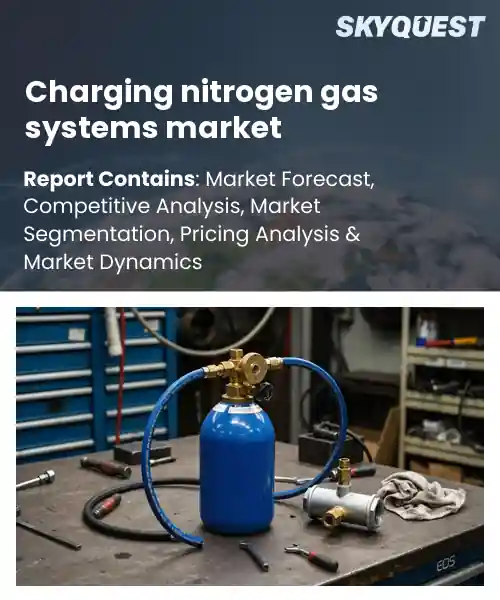
Charging nitrogen gas systems market
Report ID: SQMIG20I3253
Report ID: SQMIG20I3253
[email protected]
USA +1 351-333-4748
Report ID:
SQMIG20I3253 |
Region:
Global |
Published Date: July, 2026
Pages:
157
|Tables:
187
|Figures:
79


Global Charging Nitrogen Gas Systems Market size was valued at USD 1.6 Billion in 2024 and is poised to grow from USD 1.69 Billion in 2025 to USD 2.66 Billion by 2033, growing at a CAGR of 5.8% during the forecast period (2026-2033).
The global charging nitrogen gas systems market comprises equipment and services to generate, store, and deliver high-purity nitrogen for applications from automotive tire inflation to semiconductor fabrication. With increasing industrial automation and tightening safety standards, reliable on‑site nitrogen is now in demand, replacing bulk‑cylinder delivery. Traditionally, the industry has depended on fixed-plant liquefaction, but there has been a rapid adoption of portable generators with state-of-the-art pressure swing adsorption technology in the last 10 years, exemplified by the deployment of mobile units at major logistics hubs in Europe in 2018. This trend is a part of a larger movement toward decentralized, low-maintenance solutions that reduce downtime and logistics expenses.
This decentralization has been followed by a current growth driver, the increasing demand for nitrogen in electric-vehicle (EV) battery assembly lines, where inert atmospheres are required to prevent moisture degradation. They use on-site nitrogen generators in their manufacturing processes to reduce cycle times and eliminate the need to transport expensive cylinders, reducing production costs and improving throughput. At the same time, stringent emissions regulations in food processing are driving processors to switch from carbon dioxide scrubbers to nitrogen-based preservation, encouraging modular charging station acquisitions. Such developments pave the way for service-based business models, e.g., pay-per-use leasing, and also call for investment in AI-enabled monitoring platforms, which can further enhance system efficiency and reliability.
How is IoT Improving Efficiency In The Charging Nitrogen Gas Systems Market?
IoT is changing the face of charging nitrogen gas systems by connecting sensors, controllers and cloud platforms together. At each valve, real-time pressure and flow data are captured, so operators can immediately change set points and prevent over-pressurization. Remote dashboards allow maintenance teams to view equipment health, plan service before failures and reduce unplanned downtime. The automated alerts will close valves or adjust pumps, saving energy and extending the life of the components. Integration with existing plant control systems creates a seamless feedback loop to optimize gas usage and improve safety. This increases plant responsiveness to production changes and reduces operating costs.
Market snapshot - (2026-2033)
Global Market Size
USD 1.6 Billion
Largest Segment
Tire Nitrogen Inflation Systems
Fastest Growth
Portable Nitrogen Charging Systems
Growth Rate
5.8% CAGR
To get more insights on this market click here to Request a Free Sample Report
Global charging nitrogen gas systems market is segmented by system type, technology, component, application, end-use industry, mobility and region. Based on system type, the market is segmented into Portable Nitrogen Charging Systems, Mobile Nitrogen Service Units, Skid-mounted Nitrogen Charging Systems, Accumulator Charging Systems, Aircraft Nitrogen Charging Systems, Tire Nitrogen Inflation Systems and Others. Based on technology, the market is segmented into Membrane Nitrogen Generation, Pressure Swing Adsorption (PSA), Cryogenic Nitrogen Supply Systems and Hybrid Nitrogen Generation Systems. Based on component, the market is segmented into Nitrogen Generators, Air Compressors, Storage Cylinders & Tanks, Pressure Regulators, Filtration Systems and Monitoring & Control Systems. Based on application, the market is segmented into Hydraulic Accumulator Charging, Aircraft Maintenance, Tire Inflation, Oil & Gas Operations, Industrial Equipment Maintenance, Fire Suppression Systems and Others. Based on end-use industry, the market is segmented into Aerospace & Defense, Oil & Gas, Automotive, Industrial Manufacturing, Marine, Mining and Others. Based on mobility, the market is segmented into Fixed Systems, Portable Systems and Vehicle-mounted Systems. Based on region, the market is segmented into North America, Europe, Asia Pacific, Latin America and Middle East & Africa.
The portable nitrogen charging systems segment is dominating the market. It is majorly driven by the customer’s preference for flexibility and fast deployment in remote or confined locations, enabling on-site nitrogen generation instead of bulk deliveries. This advantage reduces the downtime, reduces logistics costs and meets the safety regulations that favour the inerting on site. The ability to integrate with existing compressed-air infrastructure adds to its appeal, making it the preferred choice for many operators looking for an immediate and reliable nitrogen supply throughout operations.
However, the strongest growth momentum is seen in skid mounted nitrogen charging systems, as industrial sites require capacity units that can be installed and remain for plant reconfigurations. Their modular design enables scalability and integration with compressors, providing a solution for operators concerned with long term efficiency and reduction of dependence on nitrogen supply chains.
The pressure swing adsorption segment is leading owing to its proven adsorption media providing consistent high purity nitrogen to meet stringent quality requirements in various charging applications. The technology’s simple infrastructure, low maintenance requirements and ability to use ambient air, make it attractive for fixed and portable installations. Operators also appreciate its reliability and quick response to changes in load, making it the preferred choice in markets where a reliable supply of nitrogen is a matter of safety and performance.
Meanwhile hybrid nitrogen generation systems are emerging as the key high growth area as manufacturers combine PSA and membrane technologies to achieve efficiency and lower energy consumption. The synergy enables size, better purity control and lower operating costs, which appeals to customers seeking sustainable solutions and drives adoption across charging applications.
To get detailed segments analysis, Request a Free Sample Report
The region boasts a mature industrial ecosystem that marries sophisticated engineering capabilities with a deep pool of technical talent. Strong collaboration between equipment manufacturers, research institutions and end-user industries is the driver for continuous innovation in system design and integration. The adoption of advanced nitrogen charging solutions is being driven by strict safety and environmental regulations in sectors like aerospace, automotive, and food processing. Deep capital markets and strategic investment paradigms facilitate the rapid installation of the most advanced technologies, and an established supply chain ensures the consistent availability of high-purity nitrogen. This convergence of technical expertise, regulatory push and financial backing creates a resilient environment that sustains leadership on the global stage.
The United States’ charging nitrogen gas systems market is backed by a diverse set of high-tech manufacturing centers that focus on precision and efficiency. Top universities and research laboratories work closely with industry to develop emerging concepts and move them into commercial applications. Demand for reliable nitrogen solutions is spurred by the presence of major aerospace and automotive clusters, while a strong focus on operational safety drives continuous improvements. Integrated logistics networks further facilitate distribution and enhance the United States standing as a standard for system performance and reliability.
Canada’s charging nitrogen gas systems market is driven by a progressive stance on sustainability and innovation within its resource-intensive industries. Close relationships between government agencies and industry help to create an environment that encourages the development of low-emission technologies. The country’s focus on energy efficiency is driving the uptake of nitrogen charging systems by makers of mining, food processing and medical equipment. Collaboration with academic institutions builds expertise and a robust infrastructure allows for the reliable provision and maintenance of complex equipment.
Europe’s expansion is propelled by a convergence of stringent environmental directives and a strong tradition of engineering excellence. Policy frameworks encourage the use of nitrogen to improve process efficiency and reduce emissions, prompting widespread adoption across automotive, pharmaceutical, and food sectors. Collaborative research programs among leading universities and multinational firms accelerate technological refinement, emphasizing energy‑saving designs and digital integration. The region’s dense industrial networks and well‑coordinated supply chains enable rapid scaling of innovative solutions, while a cultural emphasis on quality and reliability sustains demand for high‑performance charging systems, positioning Europe as a dynamic growth engine.
Charging nitrogen gas systems market in Germany reflects a deep‑rooted engineering heritage that prioritizes precision and reliability. The country’s extensive automotive and chemical sectors drive continuous demand for sophisticated nitrogen solutions that enhance production efficiency. Strong collaboration between research institutes and manufacturers yields incremental innovations focused on energy conservation and system automation. Robust standards and certification processes reinforce product quality, while a dense industrial landscape facilitates swift integration of advanced charging technologies across a wide range of applications.
Charging nitrogen gas systems market in the United Kingdom is energized by a vibrant tech ecosystem and a proactive regulatory environment. Emerging sectors such as renewable energy and advanced manufacturing are rapidly embracing nitrogen charging to improve process control and safety. Strategic partnerships between academic research centers and industry accelerate the development of next‑generation systems with digital monitoring capabilities. The nation’s emphasis on sustainability and operational excellence fuels a swift uptake of innovative solutions, reinforcing its position as a fast‑moving market within Europe.
Charging nitrogen gas systems market in France is gaining momentum as industries seek to enhance productivity while aligning with environmental goals. Collaborative initiatives between government agencies and private firms promote research into energy‑efficient nitrogen technologies. Key sectors including aerospace, food processing, and pharmaceuticals are increasingly adopting advanced charging solutions to streamline operations and meet strict quality standards. The French focus on innovation and adherence to rigorous safety protocols creates a fertile ground for emerging market participants to expand their presence.
Asia Pacific advances its position through a blend of rapid industrialization and targeted governmental support for clean technologies. Nations in the region prioritize modernization of manufacturing processes, leading to heightened interest in nitrogen charging for improved product consistency and reduced waste. Strong emphasis on automation and digitalization drives the integration of smart control systems, while collaborative research ventures between universities and industry accelerate technology transfer. An expanding middle class fuels demand in food packaging and medical device sectors, further widening application scope. Together, these dynamics cultivate a competitive landscape where Asia Pacific emerges as a pivotal growth frontier for charging nitrogen gas solutions.
Charging nitrogen gas systems market in Japan is shaped by a legacy of precision engineering and a culture of continuous improvement. The country’s advanced automotive and electronics industries rely on high‑purity nitrogen to enhance manufacturing yields and product reliability. Close cooperation between leading research institutions and equipment manufacturers fosters the development of compact, energy‑efficient charging solutions. A strong focus on quality assurance and compliance with rigorous standards ensures that Japanese market participants remain at the forefront of technological sophistication.
Charging nitrogen gas systems market in South Korea is propelled by a dynamic semiconductor and display manufacturing sector that demands stringent process control. The nation’s commitment to high‑tech innovation encourages the adoption of smart nitrogen charging systems featuring real‑time monitoring and predictive maintenance. Government incentives for eco‑friendly technologies stimulate investment in low‑emission solutions, while a collaborative ecosystem among universities, research labs, and industry accelerates the rollout of cutting‑edge equipment across diverse applications.
To know more about the market opportunities by region and country, click here to
Buy The Complete Report
Increasing Adoption of Clean Energy
Regulatory Push for Emission Reduction
High Capital Investment Requirements
Limited Technical Expertise Availability
Request Free Customization of this report to help us to meet your business objectives.
The competitive landscape is shaped by aggressive capital inflows and strategic alliances, with firms leveraging partnerships and technology upgrades to secure market share. Funding rounds such as Noble Gas Systems’ $4.2 million Series B and Critical Energy’s $22 million seed raise illustrate investors’ confidence, while collaborations with venture partners and integration of advanced compression modules drive differentiation and accelerate deployment of charging nitrogen gas systems.
SkyQuest’s ABIRAW (Advanced Business Intelligence, Research & Analysis Wing) is our Business Information Services team that Collects, Collates, Correlates, and Analyses the Data collected by means of Primary Exploratory Research backed by robust Secondary Desk research.
As per SkyQuest analysis, the global charging nitrogen gas systems market is being propelled primarily by the increasing adoption of clean energy, which encourages manufacturers to integrate nitrogen‑based charging solutions for lower emissions and higher efficiency. A second strong driver is the tightening of emission‑related regulations that push industries toward low‑impact nitrogen technologies. However, the high capital investment required for equipment and integration remains a notable restraint, slowing uptake among budget‑constrained firms. North America continues to dominate the market due to its mature industrial base, advanced engineering capabilities and supportive capital environment. Within the segment landscape, portable nitrogen charging systems lead the pack, favored for their flexibility, rapid deployment and ability to reduce logistics costs.
| Report Metric | Details |
|---|---|
| Market size value in 2024 | USD 1.6 Billion |
| Market size value in 2033 | USD 2.66 Billion |
| Growth Rate | 5.8% |
| Base year | 2024 |
| Forecast period | (2026-2033) |
| Forecast Unit (Value) | USD Billion |
| Segments covered |
|
| Regions covered | North America (US, Canada), Europe (Germany, France, United Kingdom, Italy, Spain, Rest of Europe), Asia Pacific (China, India, Japan, Rest of Asia-Pacific), Latin America (Brazil, Rest of Latin America), Middle East & Africa (South Africa, GCC Countries, Rest of MEA) |
| Companies covered |
|
| Customization scope | Free report customization with purchase. Customization includes:-
|
To get a free trial access to our platform which is a one stop solution for all your data requirements for quicker decision making. This platform allows you to compare markets, competitors who are prominent in the market, and mega trends that are influencing the dynamics in the market. Also, get access to detailed SkyQuest exclusive matrix.
Table Of Content
Executive Summary
Market overview
Parent Market Analysis
Market overview
Market size
KEY MARKET INSIGHTS
COVID IMPACT
MARKET DYNAMICS & OUTLOOK
Market Size by Region
KEY COMPANY PROFILES
Methodology
For the Charging nitrogen gas systems market, our research methodology involved a mixture of primary and secondary data sources. Key steps involved in the research process are listed below:
1. Information Procurement: This stage involved the procurement of Market data or related information via primary and secondary sources. The various secondary sources used included various company websites, annual reports, trade databases, and paid databases such as Hoover's, Bloomberg Business, Factiva, and Avention. Our team did 45 primary interactions Globally which included several stakeholders such as manufacturers, customers, key opinion leaders, etc. Overall, information procurement was one of the most extensive stages in our research process.
2. Information Analysis: This step involved triangulation of data through bottom-up and top-down approaches to estimate and validate the total size and future estimate of the Charging nitrogen gas systems market.
3. Report Formulation: The final step entailed the placement of data points in appropriate Market spaces in an attempt to deduce viable conclusions.
4. Validation & Publishing: Validation is the most important step in the process. Validation & re-validation via an intricately designed process helped us finalize data points to be used for final calculations. The final Market estimates and forecasts were then aligned and sent to our panel of industry experts for validation of data. Once the validation was done the report was sent to our Quality Assurance team to ensure adherence to style guides, consistency & design.
Analyst Support
Customization Options
With the given market data, our dedicated team of analysts can offer you the following customization options are available for the Charging nitrogen gas systems market:
Product Analysis: Product matrix, which offers a detailed comparison of the product portfolio of companies.
Regional Analysis: Further analysis of the Charging nitrogen gas systems market for additional countries.
Competitive Analysis: Detailed analysis and profiling of additional Market players & comparative analysis of competitive products.
Go to Market Strategy: Find the high-growth channels to invest your marketing efforts and increase your customer base.
Innovation Mapping: Identify racial solutions and innovation, connected to deep ecosystems of innovators, start-ups, academics, and strategic partners.
Category Intelligence: Customized intelligence that is relevant to their supply Markets will enable them to make smarter sourcing decisions and improve their category management.
Public Company Transcript Analysis: To improve the investment performance by generating new alpha and making better-informed decisions.
Social Media Listening: To analyze the conversations and trends happening not just around your brand, but around your industry as a whole, and use those insights to make better Marketing decisions.
REQUEST FOR SAMPLE
 REQUEST FREE CUSTOMIZATION
Global Charging Nitrogen Gas Systems Market size was valued at USD 1.6 Billion in 2024 and is poised to grow from USD 1.69 Billion in 2025 to USD 2.66 Billion by 2033, growing at a CAGR of 5.8% during the forecast period (2026-2033).
The competitive landscape is shaped by aggressive capital inflows and strategic alliances, with firms leveraging partnerships and technology upgrades to secure market share. Funding rounds such as Noble Gas Systems’ $4.2 million Series B and Critical Energy’s $22 million seed raise illustrate investors’ confidence, while collaborations with venture partners and integration of advanced compression modules drive differentiation and accelerate deployment of charging nitrogen gas systems. 'HYDAC International GmbH', 'Maximator GmbH', 'Hale Hamilton', 'Hydraulics International, Inc.', 'Hydrotechnik UK Ltd', 'Accudyne Industries', 'Semmco Limited', 'Parker Hannifin Corporation', 'Atlas Copco AB', 'Ingersoll Rand Inc.', 'Air Products and Chemicals, Inc.', 'Linde plc', 'Air Liquide S.A.', 'Messer Group GmbH', 'Taiyo Nippon Sanso Corporation', 'Haskel International', 'South-Tek Systems', 'Novair SAS', 'Inmatec GaseTechnologie GmbH', 'OXYMAT A/S'
Growing emphasis on renewable power sources encourages manufacturers to integrate nitrogen‑based charging solutions that support efficient energy storage and process optimization. By enabling lower emissions and improved operational reliability, these systems align with corporate sustainability goals, fostering broader acceptance across sectors such as automotive, electronics, and chemicals. The perceived environmental benefit and alignment with green initiatives motivate investors and end‑users to prioritize nitrogen charging technology, thereby expanding market demand and encouraging further product innovation and deployment through global supply chain partnerships.
Sustainable Production Drives Adoption: Growing environmental regulations and corporate net‑zero commitments are compelling manufacturers to replace traditional nitrogen generators with low‑emission charging systems. Companies seek solutions that minimize energy consumption, reduce waste, and integrate seamlessly with renewable power sources. This shift is accelerating partnerships between equipment suppliers and green‑energy providers, fostering modular designs that can be retrofitted into existing plants. The emphasis on sustainability is reshaping procurement criteria, making eco‑efficiency a decisive factor in selecting nitrogen gas charging technologies today.
Why does North America Dominate the Global Charging nitrogen gas systems market? |@12


Want to customize this report? This report can be personalized according to your needs. Our analysts and industry experts will work directly with you to understand your requirements and provide you with customized data in a short amount of time. We offer $1000 worth of FREE customization at the time of purchase.
Feedback From Our Clients


 USA (+1) 351-333-4748

