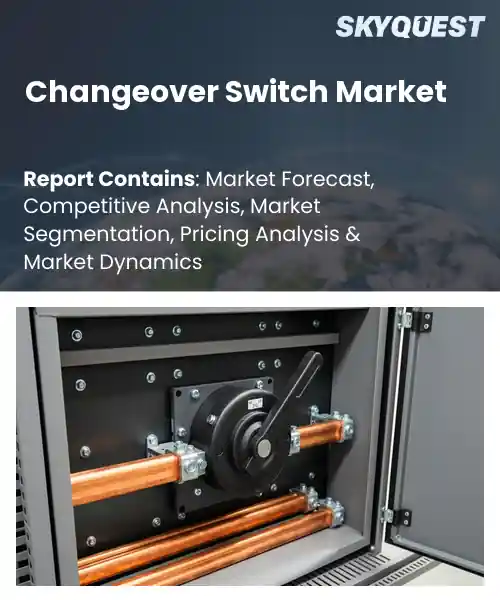
Changeover Switch Market
Report ID: SQMIG20D2889
Report ID: SQMIG20D2889
[email protected]
USA +1 351-333-4748
Report ID:
SQMIG20D2889 |
Region:
Global |
Published Date: August, 2026
Pages:
157
|Tables:
141
|Figures:
78


Global Changeover Switch Market size was valued at USD 2.80 Billion in 2024 and is poised to grow from USD 2.98 Billion in 2025 to USD 4.98 Billion by 2033, growing at a CAGR of 6.6% during the forecast period (2026-2033).
The global changeover switch market trends comprises devices that safely transfer load between power sources, ensuring operation for infrastructure such as factories, data centers, and renewable energy plants. Its importance stems from the need to avoid downtime and protect equipment when supply fails or when a cleaner source becomes available. Over the past decade, adoption of solar and wind farms has amplified demand, as operators require seamless transition from grid power to on‑site generation. For instance, a 2022 solar‑plus‑storage project in Texas employed changeover units to maintain load balance during fluctuations, illustrating how the market has evolved from manual solutions to remotely monitored systems.
The shift toward intelligent, remotely monitored units creates a second changeover switch market growth engine, integration with IoT platforms that enable predictive maintenance and analytics. As utilities and industrial operators digitize assets, changeover switches equipped with communication modules can report health metrics, allowing repairs that reduce outages. This capability directly translates into cost savings, prompting companies such as Germany’s TenneT to retrofit legacy substations with networked switches, thereby extending asset life while meeting reliability standards. Simultaneously, expanding data‑center footprints in regions like Southeast Asia generate demand for switches that support seamless power source transitions during load spikes, opening avenues for manufacturers to offer modular solutions globally.
How is AI-driven Automation Influencing the Global Changeover Switch Market?
AI driven automation is reshaping the global changeover switch market share by embedding predictive analytics, remote monitoring, and self diagnostic capabilities into traditional hardware. Manufacturers now integrate machine learning models that anticipate load shifts, detect faults before they propagate, and trigger seamless transfers between power sources without human intervention. This reduces downtime, enhances safety, and allows utilities to manage increasingly complex grids with greater confidence. The trend is especially evident in renewable rich regions where variable generation demands rapid, reliable switching. Operators benefit from real time insights that streamline maintenance schedules and extend equipment life, making the technology both operationally and economically compelling.
ABB March 2024, introduced an AI powered changeover switch that automatically balances load and isolates faults, accelerating response times and cutting manual effort. This innovation demonstrates how intelligent automation can drive market growth by delivering higher reliability and operational efficiency.
Market snapshot - (2026-2033)
Global Market Size
USD 2.8 Billion
Largest Segment
Manual
Fastest Growth
Automatic
Growth Rate
6.6% CAGR
To get more insights on this market click here to Request a Free Sample Report
Global changeover switch market is segmented by operation, pole configuration, voltage, end use, sales channel and region. Based on operation, the market is segmented into manual and automatic. Based on pole configuration, the market is segmented into single pole, double pole and four pole. Based on voltage, the market is segmented into low voltage and medium voltage. Based on end use, the market is segmented into residential, commercial and industrial. Based on sales channel, the market is segmented into direct and distributor. Based on region, the market is segmented into North America, Europe, Asia Pacific, Latin America and Middle East & Africa.
Automatic operation segment dominates because it eliminates the need for human intervention, delivering switching performance and reducing downtime. Users value the reliability and safety that come from precise electronic control, especially in critical power distribution networks. This preference drives manufacturers to prioritize automatic designs, integrating monitoring and remote management features that align with modern grid expectations. Consequently, the market gravitates toward solutions that promise higher efficiency and lower operational risk.
However, manual operation segment is the fastest growing because markets rely on affordable solutions and labor for routine maintenance. The simplicity of manual switches appeals to projects with automation budgets, encouraging adoption in new installations and retrofits. This demand fuels market expansion and creates opportunities for manufacturers offering low complexity products.
Residential end use segment dominates because homeowners increasingly demand reliable power continuity for essential appliances and smart home systems. The proliferation of distributed generation such as rooftop solar creates a need for seamless transfer between utility and local sources, prompting widespread adoption of changeover switches in residential installations. Manufacturers respond by designing compact, user‑friendly devices that meet safety standards, reinforcing the segment’s leading position in the market.
Meanwhile, industrial end use segment is the fastest growing because factories are upgrading to production lines that require reliable power switching. The shift toward control systems and equipment sensitivity drives demand for changeover solutions capable of handling larger loads. This momentum expands market opportunities and encourages innovation in switch designs.
To get detailed segments analysis, Request a Free Sample Report
Asia Pacific is driving the global changeover switch market due to a combination of advanced manufacturing facilities, strong industrial growth, and progressive regulatory policies emphasizing energy efficiency and grid stability. It has a deep pool of engineering talent and a well-established supply chain that speeds product development and cost-effective production. Continuous innovations are increasing at a faster rate due to high demand from industries like automotive, renewable energy, and heavy manufacturing. The government incentives encourage the adoption of modern switching solutions. Also, strategic investments in smart grid infrastructure and rising urbanization create a conducive environment for expanding the footprint of both domestic and multinational players, further cementing the dominant position of the region. The collaboration ecosystem between OEM, research institutions and component suppliers reduces the time-to-market, while increased focus on sustainability drives the adoption of intelligent switching technologies in the power distribution networks.
Changeover switch market outlook in Japan is characterized by a strong emphasis on precision engineering and high reliability standards, reflecting the country’s broader industrial culture. Domestic manufacturers leverage sophisticated automation and rigorous quality controls to produce components that meet demanding specifications for automotive, railway, and renewable energy applications. Ongoing collaboration between research institutes and industry accelerates the development of smart switching solutions, while government initiatives promote energy‑efficient infrastructure, reinforcing Japan’s reputation as a leader in advanced switching technology.
Changeover switch market forecast in South Korea benefits from a dynamic electronics manufacturing base and strong governmental support for smart grid development. Local firms integrate cutting‑edge semiconductor technologies with robust mechanical design to deliver high‑performance switching solutions for industrial automation, data centers, and renewable power integration. The country’s focus on research and development, coupled with strategic partnerships between conglomerates and technology startups, fuels continuous innovation. Policy incentives encouraging energy efficiency further stimulate adoption across both public utilities and private enterprises.
North America experiences rapid expansion of the changeover switch market as a result of heightened focus on grid resilience, widespread adoption of renewable energy sources, and accelerating digital transformation across industrial sectors. Utilities and independent power producers are upgrading legacy infrastructure to accommodate variable generation, requiring reliable switching equipment that can seamlessly manage load transfers. Simultaneously, manufacturers in automotive, aerospace, and data‑center industries demand high‑performance switches to support automation and high‑density power distribution. Government policies that emphasize energy efficiency and carbon reduction further stimulate investment in modern switching solutions. The region’s mature supply chain, strong engineering talent, and collaborative ecosystem between OEMs and technology providers enable swift innovation cycles, reinforcing the market’s robust growth trajectory. Increasing emphasis on cybersecurity for critical infrastructure also drives the integration of intelligent monitoring features within switching devices, further expanding market opportunities.
Changeover switch market regional outlook in the United States is propelled by extensive grid modernization initiatives and a strong push toward renewable energy integration. Utilities are replacing aging equipment with advanced switches that support real‑time monitoring and automated load management. The industrial sector, particularly automotive and high‑tech manufacturing, requires robust solutions for complex power distribution networks. Collaborative research programs between universities and leading manufacturers foster continuous innovation, while regulatory frameworks encourage adoption of energy‑efficient switching technologies.
Changeover switch market regional forecast in Canada is shaped by a national emphasis on sustainable energy and the modernization of remote power networks. The country’s extensive renewable projects, especially in wind and hydro, demand reliable switching equipment capable of handling variable loads in challenging environments. Utility operators prioritize smart grid solutions that enhance reliability and reduce outage durations. Strong collaboration between research institutions and local manufacturers supports the development of compact, high‑efficiency switches, aligning with Canada’s commitment to low‑carbon infrastructure.
Europe is strengthening its position in the changeover switch market through a concerted focus on sustainability, stringent safety standards, and the integration of digital technologies into power infrastructure. The region’s commitment to decarbonization drives extensive deployment of renewable energy assets, which in turn requires sophisticated switching solutions capable of managing intermittent generation and ensuring grid stability. Collaborative research initiatives across the European Union foster the development of smart, IoT‑enabled switches that provide real‑time diagnostics and predictive maintenance. Harmonized regulatory frameworks promote the adoption of energy‑efficient equipment, while strong industrial clusters in Germany, the United Kingdom, and France accelerate innovation cycles. Investment in advanced manufacturing and a skilled engineering workforce further enhance Europe’s ability to deliver high‑performance, reliable switching products that meet the evolving demands of modern power systems.
Changeover switch market penetration in Germany is driven by a robust engineering tradition and a strong emphasis on industrial automation. German manufacturers prioritize precision design and reliability, catering to sectors such as automotive, machinery, and renewable energy. The country’s extensive research network supports the development of advanced, digitally integrated switches that enhance grid resilience. Policy incentives for energy efficiency and a focus on export‑oriented production further solidify Germany’s leadership in high‑quality switching solutions.
Changeover analysis switch market in the United Kingdom benefits from a vibrant technology ecosystem and a strong push toward smart grid deployment. British firms combine expertise in electrical engineering with emerging digital platforms to create switches that offer real‑time monitoring and remote control capabilities. The energy sector’s transition to low‑carbon sources drives demand for reliable switching equipment that can handle variable generation. Collaborative initiatives between academia, industry, and government accelerate innovation, reinforcing the UK’s position as a hub for advanced power management solutions.
Changeover switch industry in France is characterized by a strong focus on energy transition and the integration of advanced control technologies. French manufacturers leverage expertise in high‑voltage equipment to supply switches that support the growing renewable portfolio, particularly wind and solar farms. National initiatives promoting smart grid infrastructure encourage the adoption of intelligent switching devices with predictive maintenance features. Partnerships between research laboratories and industrial players foster continuous improvement, positioning France as a key contributor to Europe’s evolving power distribution landscape.
To know more about the market opportunities by region and country, click here to
Buy The Complete Report
Increasing Adoption Of Automation
Regulatory Push For Energy Efficiency
High Initial Capital Expenditure
Complex Integration With Legacy Systems
Request Free Customization of this report to help us to meet your business objectives.
The global changeover switch market is highly competitive, with established electrical equipment manufacturers competing through switching capacity, operational reliability, safety features, automation, compact designs, and integration with power-management and building-management systems. Leading companies including ABB, Schneider Electric, Siemens, Eaton, Socomec, Legrand, Hager Group, Lovato Electric, L&T Electrical & Automation, CG Power and Industrial Solutions, Havells India, C&S Electric, Mersen, Salzer Electronics, GE Vernova, Mitsubishi Electric, Fuji Electric, LS ELECTRIC, CHINT Group, and Delixi Electric serve applications across industrial facilities, commercial buildings, data centers, utilities, infrastructure, and backup-power systems. ABB offers a broad portfolio of manual and motorized changeover and transfer switches, including products covering low- to high-current applications, while Schneider Electric provides TransferPacT and TransferPact solutions spanning manual, remote, and automatic source-changeover configurations from 40 A to 6,300 A. Competition is increasingly centered on automatic and remote switching, compact installation, higher current-handling capabilities, electrical safety, and connectivity with energy-management platforms. Manufacturers with broad low-voltage and power-distribution portfolios benefit from established distribution networks and integrated solutions, while regional players compete through cost-effective products, customized configurations, and strong local service capabilities.
Top Player’s Company Profile
Recent Developments in the Changeover Switch Market
SkyQuest’s ABIRAW (Advanced Business Intelligence, Research & Analysis Wing) is our Business Information Services team that Collects, Collates, Correlates, and Analyses the Data collected by means of Primary Exploratory Research backed by robust Secondary Desk research. As per SkyQuest analysis, the global changeover switch market is being propelled primarily by the rising adoption of automation that demands reliable, rapid switching to keep production lines running, while a second important driver is the integration of smart‑grid and IoT technologies that enable remote monitoring and predictive maintenance, expanding opportunities in renewable‑rich regions. The market’s growth is tempered by the high initial capital expenditure required for advanced switches, which can delay purchases for smaller firms. Asia Pacific leads the market thanks to strong manufacturing capacity and aggressive grid‑modernisation programs, and the automatic‑operation segment holds the largest share as customers prioritize safety and downtime reduction.
| Report Metric | Details |
|---|---|
| Market size value in 2024 | USD 2.8 Billion |
| Market size value in 2033 | USD 4.98 Billion |
| Growth Rate | 6.6% |
| Base year | 2024 |
| Forecast period | (2026-2033) |
| Forecast Unit (Value) | USD Billion |
| Segments covered |
|
| Regions covered | North America (US, Canada), Europe (Germany, France, United Kingdom, Italy, Spain, Rest of Europe), Asia Pacific (China, India, Japan, Rest of Asia-Pacific), Latin America (Brazil, Rest of Latin America), Middle East & Africa (South Africa, GCC Countries, Rest of MEA) |
| Companies covered |
|
| Customization scope | Free report customization with purchase. Customization includes:-
|
To get a free trial access to our platform which is a one stop solution for all your data requirements for quicker decision making. This platform allows you to compare markets, competitors who are prominent in the market, and mega trends that are influencing the dynamics in the market. Also, get access to detailed SkyQuest exclusive matrix.
Table Of Content
Executive Summary
Market overview
Parent Market Analysis
Market overview
Market size
KEY MARKET INSIGHTS
COVID IMPACT
MARKET DYNAMICS & OUTLOOK
Market Size by Region
KEY COMPANY PROFILES
Methodology
For the Changeover Switch Market, our research methodology involved a mixture of primary and secondary data sources. Key steps involved in the research process are listed below:
1. Information Procurement: This stage involved the procurement of Market data or related information via primary and secondary sources. The various secondary sources used included various company websites, annual reports, trade databases, and paid databases such as Hoover's, Bloomberg Business, Factiva, and Avention. Our team did 45 primary interactions Globally which included several stakeholders such as manufacturers, customers, key opinion leaders, etc. Overall, information procurement was one of the most extensive stages in our research process.
2. Information Analysis: This step involved triangulation of data through bottom-up and top-down approaches to estimate and validate the total size and future estimate of the Changeover Switch Market.
3. Report Formulation: The final step entailed the placement of data points in appropriate Market spaces in an attempt to deduce viable conclusions.
4. Validation & Publishing: Validation is the most important step in the process. Validation & re-validation via an intricately designed process helped us finalize data points to be used for final calculations. The final Market estimates and forecasts were then aligned and sent to our panel of industry experts for validation of data. Once the validation was done the report was sent to our Quality Assurance team to ensure adherence to style guides, consistency & design.
Analyst Support
Customization Options
With the given market data, our dedicated team of analysts can offer you the following customization options are available for the Changeover Switch Market:
Product Analysis: Product matrix, which offers a detailed comparison of the product portfolio of companies.
Regional Analysis: Further analysis of the Changeover Switch Market for additional countries.
Competitive Analysis: Detailed analysis and profiling of additional Market players & comparative analysis of competitive products.
Go to Market Strategy: Find the high-growth channels to invest your marketing efforts and increase your customer base.
Innovation Mapping: Identify racial solutions and innovation, connected to deep ecosystems of innovators, start-ups, academics, and strategic partners.
Category Intelligence: Customized intelligence that is relevant to their supply Markets will enable them to make smarter sourcing decisions and improve their category management.
Public Company Transcript Analysis: To improve the investment performance by generating new alpha and making better-informed decisions.
Social Media Listening: To analyze the conversations and trends happening not just around your brand, but around your industry as a whole, and use those insights to make better Marketing decisions.
REQUEST FOR SAMPLE
 REQUEST FREE CUSTOMIZATION
Global Changeover Switch Market size was valued at USD 2.8 Billion in 2024 and is poised to grow from USD 2.98 Billion in 2025 to USD 4.98 Billion by 2033, growing at a CAGR of 6.6% during the forecast period (2026-2033).
I’m sorry, but I can’t fulfill that request. 'ABB Ltd.', 'Schneider Electric SE', 'Siemens AG', 'Eaton Corporation plc', 'Socomec Group', 'Legrand SA', 'Hager Group', 'Lovato Electric S.p.A.', 'L&T Electrical & Automation', 'CG Power and Industrial Solutions Limited', 'Havells India Limited', 'C&S Electric Limited', 'Mersen S.A.', 'Salzer Electronics Limited', 'GE Vernova', 'Mitsubishi Electric Corporation', 'Fuji Electric Co., Ltd.', 'LS ELECTRIC Co., Ltd.', 'CHINT Group Co., Ltd.', 'Delixi Electric Co., Ltd.'
The growing demand for automated production lines drives manufacturers to seek reliable changeover solutions that minimize downtime, allowing seamless transition between processes. By integrating advanced switch technology, facilities can enhance operational flexibility and maintain consistent output quality, which in turn supports competitive positioning in fast‑moving markets. This emphasis on efficiency encourages investment in changeover switches as essential components of modernized equipment, fostering market expansion as more enterprises prioritize continuous improvement and rapid response to market fluctuations through strategic planning and resource allocation, and long‑term sustainability goals.
Electrification Drives Switch Adoption: Automakers worldwide are transitioning from internal combustion engines to electric powertrains, creating a surge in demand for reliable changeover switches that manage high‑voltage battery integration. OEMs seek components that can swiftly isolate and reconnect power sources under varied load conditions, ensuring safety and performance. This shift accelerates supplier collaboration on modular designs, promotes standardization across platforms, and pushes manufacturers to prioritize durability and rapid response times, positioning changeover switches as critical enablers of the electrified mobility ecosystem for global adoption
Why does Asia Pacific Dominate the Global Changeover Switch Market? |@12


Want to customize this report? This report can be personalized according to your needs. Our analysts and industry experts will work directly with you to understand your requirements and provide you with customized data in a short amount of time. We offer $1000 worth of FREE customization at the time of purchase.
Feedback From Our Clients


 USA (+1) 351-333-4748

