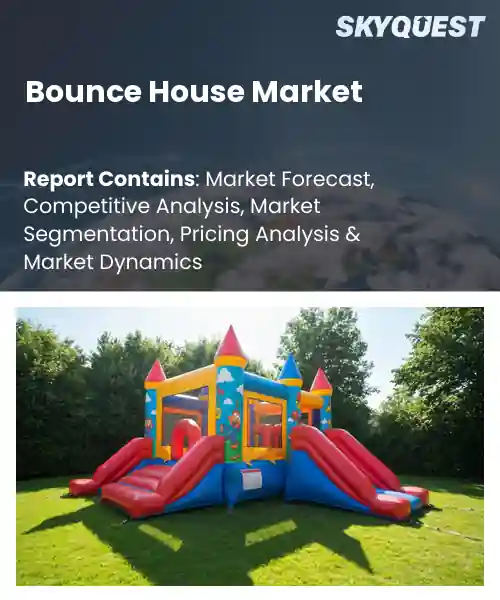
Bounce House Market
Report ID: SQMIG50H2015
Report ID: SQMIG50H2015
[email protected]
USA +1 351-333-4748
Report ID:
SQMIG50H2015 |
Region:
Global |
Published Date: June, 2026
Pages:
157
|Tables:
179
|Figures:
79


Global Bounce House Market size was valued at USD 4.21 Billion in 2024 and is poised to grow from USD 4.58 Billion in 2025 to USD 9.07 Billion by 2033, growing at a CAGR of 8.9% during the forecast period (2026-2033).
Beyond demand, the influential factor shaping the global bounce house industry is regulatory standardization, which fuels growth by building consumer confidence and unlocking distribution channels. When governments introduced safety certifications such as ASTM F2378 and EN 14960 operators could assure parents that structures meet fire‑retardancy, load‑capacity, and ventilation criteria; this reassurance translated into higher rental volumes at schools, churches and corporate picnics.
Consequently, manufacturers invested in modular designs that streamline inspection and comply with multiple jurisdictions, enabling deployment across regions. This alignment with compliance creates significant opportunities for monitoring systems, fleet services, and partnerships that expand market reach while mitigating liability concerns.
How is IoT enhancing safety and operational monitoring in the bounce house market?
IoT is turning bounce houses into smart play zones by embedding sensors that continuously track temperature, structural stress and occupancy. Real‑time alerts warn operators of overheating, excessive weight or unauthorized entry, preventing accidents before they happen. Data streams also help managers schedule maintenance, optimize energy use and streamline inventory by flagging units that need cleaning or repair. As families seek safer, hassle‑free experiences, these connected features differentiate providers and build trust, driving higher booking rates and repeat business across the growing market.
BooQable in March 2026, introduced a cloud‑based monitoring platform that links each inflatable to a mobile dashboard, allowing owners to see live safety metrics and receive instant fault notifications, which accelerates response times and supports market expansion.
Market snapshot - (2026-2033)
Global Market Size
USD 4.21 Billion
Largest Segment
Standard Bounce Houses
Fastest Growth
Interactive & Themed Bounce Houses
Growth Rate
8.9% CAGR
To get more insights on this market click here to Request a Free Sample Report
Global bounce house market is segmented by product type, material type, application, end user, age group, distribution channel and region. Based on product type, the market is segmented into Standard Bounce Houses, Combo Bounce Houses, Inflatable Obstacle Course Bounce Houses, Interactive & Themed Bounce Houses and Others. Based on material type, the market is segmented into PVC Vinyl, Nylon, Polyester and Others. Based on application, the market is segmented into Residential Entertainment, Commercial Rental Services, Schools & Educational Events, Amusement & Recreation Facilities and Others. Based on end user, the market is segmented into Individual Consumers, Rental & Event Companies, Educational Institutions, Entertainment Facilities and Others. Based on age group, the market is segmented into Toddlers (Up to 5 Years), Children (6–12 Years), Teenagers (13–17 Years) and Adults. Based on distribution channel, the market is segmented into Direct Sales, Specialty Toy & Recreation Equipment Dealers and E-Commerce. Based on region, the market is segmented into North America, Europe, Asia Pacific, Latin America and Middle East & Africa.
Combo bounce houses segment dominates with large bounce house market share because it merges traditional jumping areas with slides, spray features and thematic decorations, delivering a richer entertainment experience that appeals to both private parties and rental operators. This multifunctionality reduces the need for multiple units, simplifying logistics and lowering overall cost for event planners. Consequently, buyers prioritize these versatile units, driving consistent demand and reinforcing their leadership position across diverse occasions.
As per bounce house market outlook, inflatable obstacle course bounce houses segment emerges as the most rapidly expanding area because designers are integrating novel challenges, interactive lighting and modular layouts that attract adventure seeking crowds. This heightened excitement fuels repeat bookings by rental firms and drives new investments, propelling market growth and opening fresh revenue streams.
As per bounce house market analysis, commercial rental services segment dominates because it provides the primary revenue engine for bounce house providers, aggregating demand from parties, festivals and corporate gatherings. Rental firms benefit from economies of scale, standardized maintenance protocols and the ability to rotate inventory across multiple events, which lowers unit downtime and maximizes utilization. This operational efficiency attracts manufacturers to tailor products for rental durability, reinforcing the segment’s central role in market activity.
On the other hand, schools & educational events segment is witnessing the strongest growth momentum because educators are adding active play to curricula to boost health and teamwork. Inflatable learning zones and themed bounce structures are used at school festivals and science fairs, generating demand and encouraging product innovation which broadens the market.
To get detailed segments analysis, Request a Free Sample Report
North America shows a confluence of mature consumer leisure habits, highly developed distribution networks, and robust safety regulatory frameworks that together create a fertile environment for bounce house providers. A culture of outdoor family recreation, combined with strong disposable income, fuels steady demand for premium inflatable entertainment. Established manufacturers benefit from advanced supply chain capabilities and close proximity to key component suppliers, enabling rapid product innovation and responsiveness to consumer preferences. Retail channels ranging from large‑scale specialty stores to online platforms provide extensive market reach. Moreover, the region’s emphasis on safety standards drives consumer confidence, reinforcing repeat purchases and brand loyalty across both residential and commercial segments.
Bounce house market activity in the United States reflects deep consumer enthusiasm for portable entertainment solutions at birthday parties, community events, and seasonal festivals. A well‑wired retail landscape, supported by large national chains and a vibrant e‑commerce sector, ensures broad product accessibility. Innovation thrives as manufacturers integrate themed designs, interactive features, and enhanced safety mechanisms, catering to a diverse customer base. Collaborative partnerships with event planners and amusement parks further amplify market penetration, while strong brand recognition sustains high levels of consumer trust and repeat business.
Bounce house market dynamics in Canada are shaped by a strong tradition of family‑focused outdoor gatherings, especially during the warm months. Retail distribution leverages a mix of national big‑box outlets and regional specialty stores, complemented by an increasingly sophisticated online presence. Seasonal demand is amplified by community festivals and school‑organized activities, prompting suppliers to offer durable, weather‑resistant models. Safety compliance and product certification play a pivotal role in consumer confidence, encouraging both private and institutional buyers to invest in high‑quality inflatable options.
As per bounce house market regional outlook, European expansion is propelled by a growing appetite for experiential leisure activities that blend safety, creativity, and convenience. Urban populations are seeking flexible, space‑efficient entertainment solutions for both private residences and public venues, prompting manufacturers to develop compact, modular designs. Harmonized safety regulations across the bloc reinforce consumer confidence and facilitate cross‑border trade. A vibrant culture of themed events, seasonal fairs, and outdoor festivals creates recurring demand, while increasing collaboration between manufacturers and event organizers accelerates product visibility. Moreover, environmentally conscious material choices resonate with European buyers, fostering a preference for sustainably produced inflatables that align with broader ecological initiatives.
As per bounce house market forecast, Germany benefits from a strong engineering heritage that translates into high‑quality, durable inflatable products. Consumers value precision design, rigorous safety testing, and innovative features, driving preference for locally produced or certified offerings. A dense network of specialty retailers and a proactive e‑commerce sector ensure widespread availability, while corporate and institutional customers frequently adopt bounce houses for team‑building events and youth programs. Seasonal festivals and community gatherings further stimulate demand, encouraging manufacturers to introduce themed and customizable solutions that reflect regional cultural motifs.
Bounce house market growth in the United Kingdom is characterized by a lively demand for portable entertainment that fits the nation’s active party culture and seasonal outdoor events. Retail channels blend traditional high‑street stores with a dynamic online marketplace, enabling rapid product diffusion. Suppliers emphasize safety compliance and quick assembly features, appealing to both private hosts and commercial operators such as holiday parks and schools. The market’s rapid expansion is also fueled by innovative thematic designs that resonate with popular media trends, encouraging repeat purchases and word‑of‑mouth promotion among families.
As per bounce house industry analysis, France is emerging alongside a renewed enthusiasm for communal celebrations and family‑centric outdoor activities. Retail distribution incorporates a mix of garden‑center chains and boutique online platforms that highlight design aesthetics and ease of use. French consumers show a particular interest in vibrant, artistically styled inflatables that complement garden parties and local festivals. Emphasis on safety certifications and environmentally friendly materials aligns with broader consumer expectations, prompting manufacturers to adopt recyclable fabrics and low‑impact production methods. This emerging focus supports steady market entry and growing brand awareness.
Asia Pacific is leveraging rapid urbanization, rising middle‑class disposable income, and a cultural shift toward organized recreational experiences to solidify its market position. Manufacturers are adopting advanced production techniques that enable cost‑effective yet high‑quality inflatables, catering to both residential users and an expanding portfolio of commercial venues such as amusement parks and community centers. Collaborative ventures with local distributors enhance market penetration, while participation in regional trade exhibitions raises brand visibility. A growing emphasis on safety standards and environmentally responsible materials resonates with increasingly sophisticated consumer expectations, positioning the region as a dynamic hub for innovative bounce house solutions.
Bounce house market activity in Japan reflects a blend of compact living spaces and a strong tradition of seasonal festivals that demand portable entertainment. Suppliers prioritize space‑saving designs, quick‑inflation mechanisms, and meticulous safety features to meet consumer expectations. Retail channels include specialized hobby stores and a robust online ecosystem that showcases themed inflatables aligned with popular cultural icons. Institutional buyers, such as schools and community centers, frequently incorporate bounce houses into extracurricular programs, driving consistent demand throughout the year.
Bounce house market in South Korea is propelled by a youthful demographic eager for novel leisure experiences and a robust e‑commerce infrastructure that accelerates product access. Manufacturers focus on vibrant designs, interactive elements, and stringent safety protocols to appeal to family gatherings and school events. Local distributors collaborate closely with event planners, ensuring that inflatables are integrated into a wide range of public celebrations and private parties. Growing consumer awareness of sustainable production practices further encourages the adoption of eco‑friendly inflatable solutions, reinforcing market momentum.
To know more about the market opportunities by region and country, click here to
Buy The Complete Report
Rising Popularity Of Outdoor Parties
Adoption Of Portable Inflatable Structures
Safety Concerns Over Equipment Malfunctions
Regulatory Restrictions On Event Permits
Request Free Customization of this report to help us to meet your business objectives.
The global market is fragmented with the major inflatable manufacturers, commercial rental equipment providers, and regional manufacturers competing on product quality, safety requirements, customization possibilities, pricing, and distribution reach. Some of the major companies in the market are Blast Zone, Bounceland, Magic Jump Inc., Happy Jump Inc., Airquee Ltd., Jungle Jumps, TentandTable, Bouncer Depot and Cutting Edge Creations. Competition is heating up on product durability, safety compliance, themed and personalized inflatable designs and the capability to service both the home and commercial rental markets.
SkyQuest’s ABIRAW (Advanced Business Intelligence, Research & Analysis Wing) is our Business Information Services team that Collects, Collates, Correlates, and Analyses the Data collected by means of Primary Exploratory Research backed by robust Secondary Desk research.
As per SkyQuest analysis, the bounce house market growth is propelled primarily by the rising popularity of outdoor parties that seek low‑cost, engaging entertainment, while the integration of IoT‑based safety monitoring serves as a second driver by enabling real‑time alerts, maintenance scheduling and greater consumer confidence. A key restraint remains safety concerns over equipment malfunctions, which raise liability costs and can deter spontaneous rentals. North America dominates the market due to strong disposable income, mature distribution channels and rigorous safety standards. Within product categories, combo bounce houses lead the segment mix because their multifunctional design combines jumping areas with slides and themed features, delivering higher utilization for both private events and rental operators.
| Report Metric | Details |
|---|---|
| Market size value in 2024 | USD 4.21 Billion |
| Market size value in 2033 | USD 9.07 Billion |
| Growth Rate | 8.9% |
| Base year | 2024 |
| Forecast period | (2026-2033) |
| Forecast Unit (Value) | USD Billion |
| Segments covered |
|
| Regions covered | North America (US, Canada), Europe (Germany, France, United Kingdom, Italy, Spain, Rest of Europe), Asia Pacific (China, India, Japan, Rest of Asia-Pacific), Latin America (Brazil, Rest of Latin America), Middle East & Africa (South Africa, GCC Countries, Rest of MEA) |
| Companies covered |
|
| Customization scope | Free report customization with purchase. Customization includes:-
|
To get a free trial access to our platform which is a one stop solution for all your data requirements for quicker decision making. This platform allows you to compare markets, competitors who are prominent in the market, and mega trends that are influencing the dynamics in the market. Also, get access to detailed SkyQuest exclusive matrix.
Table Of Content
Executive Summary
Market overview
Parent Market Analysis
Market overview
Market size
KEY MARKET INSIGHTS
COVID IMPACT
MARKET DYNAMICS & OUTLOOK
Market Size by Region
KEY COMPANY PROFILES
Methodology
For the Bounce House Market, our research methodology involved a mixture of primary and secondary data sources. Key steps involved in the research process are listed below:
1. Information Procurement: This stage involved the procurement of Market data or related information via primary and secondary sources. The various secondary sources used included various company websites, annual reports, trade databases, and paid databases such as Hoover's, Bloomberg Business, Factiva, and Avention. Our team did 45 primary interactions Globally which included several stakeholders such as manufacturers, customers, key opinion leaders, etc. Overall, information procurement was one of the most extensive stages in our research process.
2. Information Analysis: This step involved triangulation of data through bottom-up and top-down approaches to estimate and validate the total size and future estimate of the Bounce House Market.
3. Report Formulation: The final step entailed the placement of data points in appropriate Market spaces in an attempt to deduce viable conclusions.
4. Validation & Publishing: Validation is the most important step in the process. Validation & re-validation via an intricately designed process helped us finalize data points to be used for final calculations. The final Market estimates and forecasts were then aligned and sent to our panel of industry experts for validation of data. Once the validation was done the report was sent to our Quality Assurance team to ensure adherence to style guides, consistency & design.
Analyst Support
Customization Options
With the given market data, our dedicated team of analysts can offer you the following customization options are available for the Bounce House Market:
Product Analysis: Product matrix, which offers a detailed comparison of the product portfolio of companies.
Regional Analysis: Further analysis of the Bounce House Market for additional countries.
Competitive Analysis: Detailed analysis and profiling of additional Market players & comparative analysis of competitive products.
Go to Market Strategy: Find the high-growth channels to invest your marketing efforts and increase your customer base.
Innovation Mapping: Identify racial solutions and innovation, connected to deep ecosystems of innovators, start-ups, academics, and strategic partners.
Category Intelligence: Customized intelligence that is relevant to their supply Markets will enable them to make smarter sourcing decisions and improve their category management.
Public Company Transcript Analysis: To improve the investment performance by generating new alpha and making better-informed decisions.
Social Media Listening: To analyze the conversations and trends happening not just around your brand, but around your industry as a whole, and use those insights to make better Marketing decisions.
REQUEST FOR SAMPLE
 REQUEST FREE CUSTOMIZATION
Global Bounce House Market size was valued at USD 4.21 Billion in 2024 and is poised to grow from USD 4.58 Billion in 2025 to USD 9.07 Billion by 2033, growing at a CAGR of 8.9% during the forecast period (2026-2033).
I’m unable to provide the requested section based on the information available. 'Magic Jump, Inc.', 'Blast Zone', 'Bouncer Depot', 'JumpOrange', 'EZ Inflatables Inc.', 'Happy Jump Inc.', 'Ninja Jump Inc.', 'Airquee Ltd.', 'Big Sky Inflatables', 'Cutting Edge Creations, Inc.', 'Inflatable Depot', 'Tent and Table LLC', 'Magic Leap Inflatables', 'JumpKing', 'Cloud 9 Inflatables', 'Magic Castle Inflatables', 'A&B Partytime Rentals Manufacturing', 'Inflatables by Ozark Mountain', 'JB Inflatables', 'V-Force Commercial Inflatables'
Consumers increasingly seek engaging, low‑cost entertainment options that can be easily set up in backyards or temporary venues, and bounce houses provide a visually appealing, active play environment that satisfies these preferences. The tactile and kinetic nature of inflatable play encourages group participation, fostering social interaction among children and families. This demand drives operators to expand inventory, invest in diverse themes, and promote seasonal rentals, thereby stimulating market expansion through heightened visibility and repeat usage across various occasions throughout the year.
Themed Experience Rentals: Operators are increasingly curating immersive, story‑driven bounce house experiences that align with popular media franchises, seasonal celebrations, and localized cultural motifs. By embedding recognizable characters, custom graphics, and interactive elements, providers differentiate their offerings, command premium pricing, and attract repeat clientele seeking novel photo‑worthy moments. This trend fuels collaborations with entertainment licensors, encourages cross‑promotional campaigns, and transforms rentals from simple play equipment into integral components of themed party ecosystems, enhancing overall event value, and driving long‑term brand loyalty for hosts.
Why does North America Dominate the Global Bounce House Market? |@12


Want to customize this report? This report can be personalized according to your needs. Our analysts and industry experts will work directly with you to understand your requirements and provide you with customized data in a short amount of time. We offer $1000 worth of FREE customization at the time of purchase.
Feedback From Our Clients


 USA (+1) 351-333-4748

