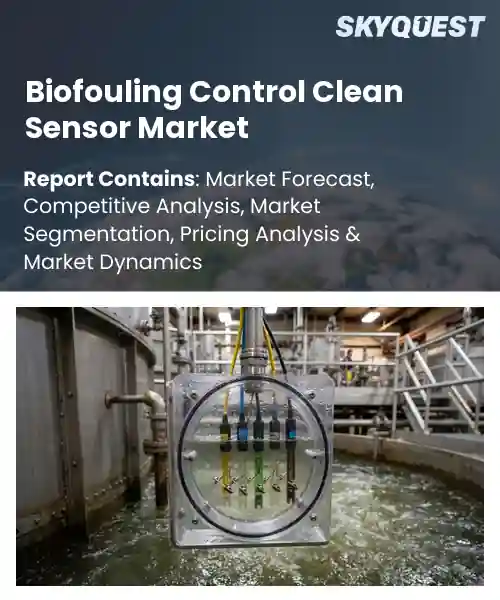
Biofouling Control Clean Sensor Market
Report ID: SQMIG45J2937
Report ID: SQMIG45J2937
[email protected]
USA +1 351-333-4748
Report ID:
SQMIG45J2937 |
Region:
Global |
Published Date: August, 2026
Pages:
157
|Tables:
118
|Figures:
77


Global Biofouling Control Clean Sensor Market size was valued at USD 392.0 Million in 2024 and is poised to grow from USD 417.48 Million in 2025 to USD 690.93 Million by 2033, growing at a CAGR of 6.5% during the forecast period (2026-2033).
The factor shaping the market is regulatory pressure to limit pollution, which forces operators to adopt non‑chemical anti‑fouling solutions that avoid toxic biocides. As standards tighten, companies invest in sensor platforms that integrate ultrasonic cleaning or coatings, creating a demand surge for technologies. This shift opens opportunities in emerging sectors such as offshore hydrogen production, where sensor reliability is essential for safety monitoring. For example, a North‑American hydrogen pilot plant installed self‑cleaning pressure transducers, achieving a 60 % reduction in maintenance visits and a 15 % gain in data fidelity. Consequently, manufacturers that deliver low‑impact designs are poised to capture market share.
How are AI and IoT reshaping the biofouling control clean sensor market?
AI is enabling predictive analytics that anticipate fouling patterns, allowing sensors to adjust cleaning cycles autonomously. IoT connectivity streams real‑time data from underwater installations to cloud platforms where machine‑learning models refine maintenance schedules. This integration reduces downtime and extends sensor lifespan, making deployments more reliable for marine monitoring and industrial applications. The market is witnessing a shift from periodic manual cleaning to continuous, data‑driven optimization, which drives investment in smarter hardware and software ecosystems.
Market snapshot - (2026-2033)
Global Market Size
USD 392.0 Million
Largest Segment
Self-Cleaning Sensors
Fastest Growth
Biofouling Monitoring Sensors
Growth Rate
6.5% CAGR
To get more insights on this market click here to Request a Free Sample Report
Global biofouling control clean sensor market is segmented by product type, cleaning technology, application, end user and region. Based on product type, the market is segmented into Biofouling Monitoring Sensors and Self-Cleaning Sensors. Based on cleaning technology, the market is segmented into Mechanical Cleaning, Ultrasonic Cleaning, Electrochemical Cleaning and UV-Based Cleaning. Based on application, the market is segmented into Marine Monitoring, Water & Wastewater Treatment, Aquaculture and Industrial Process Monitoring. Based on end user, the market is segmented into Environmental Agencies, Industrial Facilities and Research Institutions. Based on region, the market is segmented into North America, Europe, Asia Pacific, Latin America and Middle East & Africa.
Ultrasonic cleaning segment dominates because it provides non‑contact fouling removal that preserves sensor integrity while delivering continuous operation. The acoustic energy disrupts biofilm structures without mechanical wear, enabling longer deployment periods and reducing maintenance cycles. This capability aligns with operator demand for reliable data streams and cost‑effective upkeep, positioning ultrasonic cleaning as the preferred technology across diverse marine and industrial settings. Its flexibility for different housings boosts adoption significantly today.
Meanwhile, mechanical cleaning segment is witnessing the strongest growth momentum as manufacturers introduce automated brush systems that can be retrofitted onto legacy sensors. These solutions address rising demand for hands‑free maintenance in high‑traffic ports, and their proven efficacy against resilient biofilms drives broader acceptance, expanding market opportunities for industry players.
Self-Cleaning Sensors segment dominates because they integrate on‑board anti‑fouling mechanisms that continuously remove deposits without external intervention. By embedding cleaning cycles within the sensor architecture, they eliminate downtime and reduce labor costs, delivering uninterrupted data flow essential for real‑time monitoring. Their ability to maintain calibration accuracy over extended deployments meets the stringent reliability expectations of operators, fostering widespread adoption across critical marine and industrial applications and environmental compliance requirements today.
Conversely, research institutions segment is emerging as the key high‑growth area as academic labs pursue novel bio‑film disruption techniques and sensor integration studies. Funding for projects fuels rapid prototyping, and collaborations with industry accelerate technology transfer, creating new product pipelines that expand market depth and generate fresh demand for sensor solutions.
To get detailed segments analysis, Request a Free Sample Report
North America leads the Biofouling Control Clean Sensor market through a combination of mature maritime infrastructure, extensive research ecosystems, and a regulatory climate that emphasizes environmental stewardship. Robust funding mechanisms support advanced sensor development, while leading shipbuilding and offshore energy firms integrate these solutions to meet stringent compliance demands. Collaborative networks among universities, technology providers, and end‑users accelerate innovation cycles and drive early adoption across commercial and defense segments. The region also benefits from well‑established testing facilities and certification bodies that streamline product validation, reinforcing confidence among operators. This convergence of capital, expertise, and policy creates a self‑reinforcing environment that sustains North American dominance in the global arena.
Biofouling Control Clean Sensor Market in the United States is propelled by a dense concentration of research institutions and a vibrant venture capital ecosystem that together nurture breakthrough sensor technologies. Industry clusters along the Gulf Coast and Pacific regions provide real‑world testing grounds, while federal agencies promote eco‑friendly maritime practices that favor adoption. Integration with large offshore wind projects and naval platforms further embeds these solutions across diverse operational contexts.
Biofouling Control Clean Sensor Market in Canada benefits from strong governmental support for sustainable marine operations and a collaborative approach between research universities and coastal industries. The country’s emphasis on clean technology incentives encourages early deployment in fisheries, ferry services, and emerging aquaculture ventures. Access to extensive cold‑water testing environments also helps refine sensor performance, positioning Canada as a hub for resilient biofouling management solutions.
Europe’s rapid expansion in the Biofouling Control Clean Sensor market is underpinned by ambitious environmental directives that demand lower emissions and reduced hull drag. Deeply embedded engineering expertise across maritime nations fuels the design of sophisticated sensor platforms, while collaborative research frameworks funded by European programs accelerate technology transfer. Major ports adopt proactive biofouling management to meet tightening discharge standards, creating a receptive market for clean sensor solutions. The presence of leading shipyards and offshore renewables projects provides practical implementation pathways, and a culture of sustainability among operators drives willingness to invest in preventative technologies. This cohesive ecosystem of policy, expertise, and market readiness propels Europe’s leadership in the sector.
Biofouling Control Clean Sensor Market in Germany is anchored by world‑class engineering firms and a dense network of research institutes specializing in marine technologies. The country’s strong industrial base supports large‑scale integration of sensors into commercial vessels and offshore platforms. Collaborative projects between academia and industry focus on sensor reliability and data analytics, reinforcing Germany’s position as a dominant European hub for biofouling mitigation.
Biofouling Control Clean Sensor Market in the United Kingdom accelerates through a vibrant ecosystem of maritime startups and substantial investment in offshore wind infrastructure. Government incentives for clean shipping foster early adoption, while leading ports implement proactive fouling management to protect critical trade routes. Cross‑sector partnerships between universities, defense agencies, and commercial operators drive rapid innovation, positioning the United Kingdom as the fastest‑growing market within Europe.
Biofouling Control Clean Sensor Market in France is emerging thanks to targeted funding for green maritime initiatives and growing interest from the coastal tourism and fisheries sectors. Collaborative research clusters in coastal regions focus on sensor miniaturization and integration with existing vessel systems. Early pilot projects in major ports demonstrate the technology’s potential, laying the groundwork for broader market penetration across French maritime activities.
Asia Pacific advances its role in the Biofouling Control Clean Sensor market through a combination of expanding offshore energy projects, a burgeoning maritime trade network, and increasing emphasis on environmentally responsible operations. Nations invest heavily in research collaborations that blend advanced materials science with maritime engineering, fostering sensors capable of operating in diverse climatic conditions. Growing domestic shipbuilding capacities and strategic initiatives to modernize aging fleets create demand for proactive fouling mitigation. Regional standards bodies are aligning with global environmental frameworks, encouraging adoption of clean sensor technologies. Together, these factors reinforce Asia Pacific’s transition from a nascent adopter to a competitive contributor shaping the future of biofouling management worldwide.
Biofouling Control Clean Sensor Market in Japan leverages its sophisticated shipbuilding tradition and strong focus on high‑tech sensor integration. Government‑backed research consortia emphasize durability and precision for vessels navigating varied oceanic conditions. The country’s extensive port infrastructure and active offshore wind developments provide practical venues for deploying sensors, while a cultural commitment to marine sustainability drives acceptance among commercial operators.
Biofouling Control Clean Sensor Market in South Korea benefits from rapid growth in its shipbuilding sector and aggressive investment in smart maritime technologies. National research programs prioritize sensor miniaturization and real‑time monitoring to support both commercial fleets and naval assets. Integration with emerging autonomous vessel projects further amplifies interest, positioning South Korea as an emerging leader in biofouling control innovation.
To know more about the market opportunities by region and country, click here to
Buy The Complete Report
Regulatory Pressure on Biofouling
Technological Advances in Sensor Cleaning
High Initial Investment Costs
Regulatory Uncertainty Across Regions
Request Free Customization of this report to help us to meet your business objectives.
The competitive landscape is shaped by intense rivalry among established sensor manufacturers and emerging entrants that are leveraging advanced anti‑fouling coatings, AI‑driven data analytics, and strategic M&A to secure market share. Recent partnerships between sensor firms and marine equipment providers have accelerated deployment of real‑time fouling detection, while acquisitions of niche bio‑film monitoring startups have expanded technology portfolios and geographic reach.
Top Player’s Company Profile
SkyQuest’s ABIRAW (Advanced Business Intelligence, Research & Analysis Wing) is our Business Information Services team that Collects, Collates, Correlates, and Analyses the Data collected by means of Primary Exploratory Research backed by robust Secondary Desk research.
As per SkyQuest analysis, the global biofouling control clean sensor market is being propelled primarily by tightening regulatory pressure that forces operators to adopt non‑chemical anti‑fouling solutions. While a second key driver is rapid technological progress in sensor cleaning such as nanocoatings and low‑energy ultrasonic systems that cut maintenance cycles. High upfront capital requirements remain a notable restraint, limiting uptake among cost‑sensitive users. North America emerges as the dominant region, benefitting from mature maritime infrastructure, strong research ecosystems and supportive policies. Within the market, self‑cleaning sensors lead the product landscape, offering integrated anti‑fouling mechanisms that ensure continuous data flow and lower operational costs.
| Report Metric | Details |
|---|---|
| Market size value in 2024 | USD 392.0 Million |
| Market size value in 2033 | USD 690.93 Million |
| Growth Rate | 6.5% |
| Base year | 2024 |
| Forecast period | (2026-2033) |
| Forecast Unit (Value) | USD Million |
| Segments covered |
|
| Regions covered | North America (US, Canada), Europe (Germany, France, United Kingdom, Italy, Spain, Rest of Europe), Asia Pacific (China, India, Japan, Rest of Asia-Pacific), Latin America (Brazil, Rest of Latin America), Middle East & Africa (South Africa, GCC Countries, Rest of MEA) |
| Companies covered |
|
| Customization scope | Free report customization with purchase. Customization includes:-
|
To get a free trial access to our platform which is a one stop solution for all your data requirements for quicker decision making. This platform allows you to compare markets, competitors who are prominent in the market, and mega trends that are influencing the dynamics in the market. Also, get access to detailed SkyQuest exclusive matrix.
Table Of Content
Executive Summary
Market overview
Parent Market Analysis
Market overview
Market size
KEY MARKET INSIGHTS
COVID IMPACT
MARKET DYNAMICS & OUTLOOK
Market Size by Region
KEY COMPANY PROFILES
Methodology
For the Biofouling Control Clean Sensor Market, our research methodology involved a mixture of primary and secondary data sources. Key steps involved in the research process are listed below:
1. Information Procurement: This stage involved the procurement of Market data or related information via primary and secondary sources. The various secondary sources used included various company websites, annual reports, trade databases, and paid databases such as Hoover's, Bloomberg Business, Factiva, and Avention. Our team did 45 primary interactions Globally which included several stakeholders such as manufacturers, customers, key opinion leaders, etc. Overall, information procurement was one of the most extensive stages in our research process.
2. Information Analysis: This step involved triangulation of data through bottom-up and top-down approaches to estimate and validate the total size and future estimate of the Biofouling Control Clean Sensor Market.
3. Report Formulation: The final step entailed the placement of data points in appropriate Market spaces in an attempt to deduce viable conclusions.
4. Validation & Publishing: Validation is the most important step in the process. Validation & re-validation via an intricately designed process helped us finalize data points to be used for final calculations. The final Market estimates and forecasts were then aligned and sent to our panel of industry experts for validation of data. Once the validation was done the report was sent to our Quality Assurance team to ensure adherence to style guides, consistency & design.
Analyst Support
Customization Options
With the given market data, our dedicated team of analysts can offer you the following customization options are available for the Biofouling Control Clean Sensor Market:
Product Analysis: Product matrix, which offers a detailed comparison of the product portfolio of companies.
Regional Analysis: Further analysis of the Biofouling Control Clean Sensor Market for additional countries.
Competitive Analysis: Detailed analysis and profiling of additional Market players & comparative analysis of competitive products.
Go to Market Strategy: Find the high-growth channels to invest your marketing efforts and increase your customer base.
Innovation Mapping: Identify racial solutions and innovation, connected to deep ecosystems of innovators, start-ups, academics, and strategic partners.
Category Intelligence: Customized intelligence that is relevant to their supply Markets will enable them to make smarter sourcing decisions and improve their category management.
Public Company Transcript Analysis: To improve the investment performance by generating new alpha and making better-informed decisions.
Social Media Listening: To analyze the conversations and trends happening not just around your brand, but around your industry as a whole, and use those insights to make better Marketing decisions.
REQUEST FOR SAMPLE
 REQUEST FREE CUSTOMIZATION
Global Biofouling Control Clean Sensor Market size was valued at USD 392.0 Million in 2024 and is poised to grow from USD 417.48 Million in 2025 to USD 690.93 Million by 2033, growing at a CAGR of 6.5% during the forecast period (2026-2033).
The competitive landscape is shaped by intense rivalry among established sensor manufacturers and emerging entrants that are leveraging advanced anti‑fouling coatings, AI‑driven data analytics, and strategic M&A to secure market share. Recent partnerships between sensor firms and marine equipment providers have accelerated deployment of real‑time fouling detection, while acquisitions of niche bio‑film monitoring startups have expanded technology portfolios and geographic reach. 'Xylem Inc.', 'Teledyne Marine Technologies Incorporated', 'YSI Incorporated', 'Evoqua Water Technologies LLC', 'Hach Company', 'Endress+Hauser Group', 'VEGA Grieshaber KG', 'Emerson Electric Co.', 'ABB Ltd.', 'Siemens AG', 'AMETEK, Inc.', 'Honeywell International Inc.', 'SUEZ Water Technologies & Solutions', 'Thermo Fisher Scientific Inc.', 'Sea-Bird Scientific', 'NKE Instrumentation', 'Turner Designs, Inc.', 'Chelsea Technologies Group Ltd.', 'Aanderaa Data Instruments AS', 'KROHNE Messtechnik GmbH'
Regulatory agencies worldwide are tightening standards for marine and water‑treatment equipment, demanding reliable biofouling control solutions that ensure sensor accuracy and environmental compliance. This pressure drives manufacturers to develop advanced cleaning technologies, prompting increased investment and adoption across sectors such as offshore oil, aquaculture, and municipal water monitoring. As operators seek to avoid penalties and maintain operational integrity, demand for clean sensor products rises, directly supporting market expansion and encouraging continuous innovation. These regulatory trends also foster collaborative research and standardization efforts that further accelerate market momentum.
Smart Sensor Integration: Manufacturers are embedding advanced anti‑fouling sensors directly into marine infrastructure, enabling continuous performance monitoring without costly manual inspections. This integration leverages IoT connectivity, predictive analytics, and low‑power designs to alert operators to early biofilm formation, allowing pre‑emptive cleaning actions. The result is reduced downtime, extended equipment lifespan, and lower operational expenditures, positioning smart sensor networks as a core component of modern vessel management and offshore platform strategies worldwide while supporting sustainability goals and regulatory compliance across key maritime regions globally.
Why does North America Dominate the Global Biofouling Control Clean Sensor Market? |@12


Want to customize this report? This report can be personalized according to your needs. Our analysts and industry experts will work directly with you to understand your requirements and provide you with customized data in a short amount of time. We offer $1000 worth of FREE customization at the time of purchase.
Feedback From Our Clients


 USA (+1) 351-333-4748

