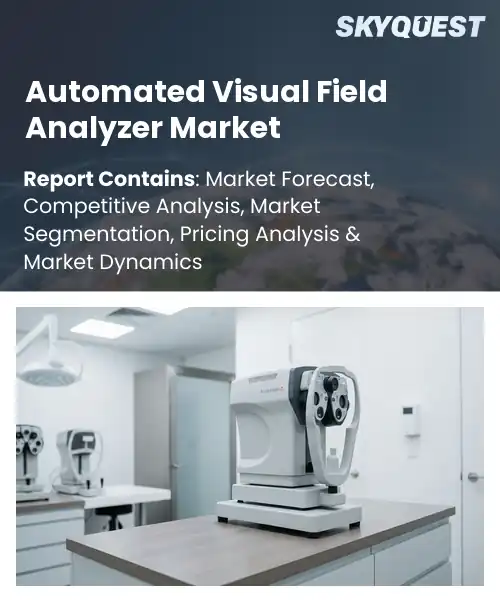
Automated Visual Field Analyzer Market
Report ID: SQMIG35A3764
Report ID: SQMIG35A3764
[email protected]
USA +1 351-333-4748
Report ID:
SQMIG35A3764 |
Region:
Global |
Published Date: June, 2026
Pages:
157
|Tables:
91
|Figures:
78


Global Automated Visual Field Analyzer Market size was valued at USD 208.66 Million in 2024 and is poised to grow from USD 221.43 Million in 2025 to USD 356.13 Million by 2033, growing at a CAGR of 6.12% during the forecast period (2026-2033).
Automated visual field analyzers operate within a niche that revolves around quantitative mapping of visual fields for detecting, evaluating, and managing diseases such as glaucoma, brain and other nervous tissue damage, and diseases involving the retina. The importance of the automated visual field analyzer market is based on the fact that early, objective measurement of visual field defects minimizes permanent visual impairment. With aging patients and increasing occurrences of diabetes and glaucoma posing challenges to ocular health infrastructure, the need for effective perimetry technology has been heightened. The development of automated perimetry has moved through several stages, including EMR-integrated products from manufacturers like Zeiss and Haag Streit.
Driven by clinical requirements, a key component of growth will be the development of technologies to reduce testing time while ensuring reliability, to facilitate screening for more patient volume without increasing staff requirements. Time-saving approaches like SITA Faster have the advantage of reducing the impact of any fatigue artifacts, which makes their use useful in detecting glaucoma progression. Miniaturization of diagnostic tools for portability enables screening in primary care practices and in remote camps, thus opening up new avenues for growth in developing nations. Cloud-based analytics add value for chronic disease management as well.
How is AI Improving Diagnostic Accuracy in the Automated Visual Field Analyzer Market?
Visual field testing devices measure peripheral vision to aid diagnosis and tracking of ocular and neurological disease. AI enhances diagnostics through pattern recognition in threshold maps and noise-filtering techniques to decrease variability from test to test. Adaptive visual field testing is possible through AI which allows clinicians to focus on areas yielding information and increases test reliability and patient comfort. AI may be used to incorporate imaging and other clinical data to predict progression and triage, thereby helping to speed up the decision-making process for physicians and facilitating further expansion of perimetry into telemedicine environments. Clinical trials for virtual reality perimetry further enhance these benefits.
Market snapshot - (2026-2033)
Global Market Size
USD 208.66 Million
Largest Segment
Static Perimeters
Fastest Growth
Static Perimeters
Growth Rate
6.12% CAGR
To get more insights on this market click here to Request a Free Sample Report
Global automated visual field analyzer market is segmented by type, application, end-user and region. Based on type, the market is segmented into Static Perimeters and Kinetic Perimeters. Based on application, the market is segmented into Glaucoma, Age-related Macular Degeneration, Diabetic Retinopathy and Others. Based on end-user, the market is segmented into Hospitals, Ophthalmic Clinics, Diagnostic Centers and Others. Based on region, the market is segmented into North America, Europe, Asia Pacific, Latin America and Middle East & Africa.
The Static Perimeters category holds the majority share due to the stability of threshold testing, which makes it easy for physicians to detect any vision-related problems reliably. Their experience, reliability, and compatibility with the set clinical standards make static perimeters a preferred choice among eye care professionals. Moreover, their software capabilities and record keeping further make static perimeters a preferred choice because of its direct applications in patient care.
On the contrary, the kinetic perimeters category is expected to witness the fastest growth because of the benefits provided by dynamic visual field testing. Portability and ease of use are two major features that have been encouraging their adoption across various clinics as well as for bedside and pediatric patients.
The glaucoma segment leads to the progressive nature of the disorder that necessitates recurrent visual field tests in its diagnosis and treatment and, thus, the need for devices designed to be highly sensitive to minor changes. Clinical practice guidelines recommend perimetry for progression assessment and support acquisition of devices that include features like reliability assessment, pattern analysis, and imaging integration.
On the other hand, diabetic retinopathy is rapidly becoming the fastest growing indication, driven by the fact that functional visual field assessment augments structural imaging in the detection of deficits. The growth of wider screening practices and telemedicine connections, coupled with more advanced algorithms for diffuse field loss, are driving growth in demand for this segment.
To get detailed segments analysis, Request a Free Sample Report
The reason why North America is the key player in the Automated Visual Field Analyzer market on the global stage is that of a combination of factors of clinical excellence, well-developed infrastructure, and investments in eye care diagnostic solutions. The presence of a large number of specialist centers and institutes facilitates speedy clinical trials and the use of new generation of perimeters. Well-developed distribution networks and a well-trained services ecosystem help with the installation and maintenance of the equipment, while payment systems in large markets facilitate their purchase. Clinical collaborations between companies, medical institutions, and specialists also help with the advancement of products and inclusion of guidelines.
United States Automated Visual Field Analyzer Market is characterized by advanced clinical infrastructure and clustered excellence in the field of ophthalmology, enabling early acceptance and validation of these devices. Efficient hospital systems and specialty clinics fuel the demand for streamlined diagnostic workflows. Effective collaboration between the industry and prominent research institutions helps fine-tune the devices. Established reimbursement frameworks encourage the use of validated solutions, whereas partnerships in academia foster innovation.
The Automated Visual Field Analyzer Market in Canada is influenced by its decentralized healthcare delivery system with a view to ensuring equal accessibility throughout different provinces. The procurement process within each province, along with the networks that exist, facilitates the standardization of visual field analyzers. There are robust communities within the optometry and ophthalmology sectors working with both the government and private institutions.
Rapid growth in Europe’s Automated Visual Field Analyzer market is taking place due to harmonization in clinical protocols, the development of procurement activities at leading health care providers and a robust system of specialist eye centers. The trend towards the need for early diagnosis and management of patients with chronic diseases has led to increased use of objective tests. Digital integration and international collaborations have enabled faster validation and adoption of new perimeter testing equipment. Local production capacity as well as clinical partnerships have enabled tailor-made solutions that can be applied in local settings.
Market for Automated Visual Field Analyzers in Germany is advantaged by presence of specialized centers of ophthalmic study and precision instrumentation adoption. Presence of well-developed hospital infrastructure, which places emphasis on diagnostic accuracy, alongside highly engaged clinicians facilitates effective testing of devices. Existing reimbursement structures, as well as coordinated buying of equipment in large hospitals, promote implementation at specialty centers. Interaction between clinical experts and manufacturers promotes training and guidelines-based utilization of machines in Germany.
United Kingdom Automated Visual Field Analyzer Market is marked by a fast-paced adoption pattern both in the private as well as public sector, which is further fueled by ongoing research and innovative practices. Involvement of investment from the concerned industry and pilots for the new diagnostic process makes testing easier. The focus on digital integration and results-oriented purchasing processes quickens the adoption rate.
France Automated Visual Field Analyzer Market has been developing through initiatives towards setting up eye care facilities as well as incorporation of diagnostics into public hospitals and private clinics. There has been a great emphasis on research and collaborations with industries that ensure localization of perimetry technologies. Procurement and specialization play important roles in expanding the base. An environment conducive to diagnostic solutions is being generated by the concentration on pathways and accessibility of patients.
The Asia Pacific region is bolstering its position in the Automated Visual Field Analyzer market by leveraging technological innovation and clinical expertise along with strategic collaborations between the industry players and the regional healthcare establishments. Countries such as Japan and South Korea have matured clinical environments where high quality validation and integration of cutting-edge perimetry equipment take place. With growing emphasis on teleophthalmology and telemedicine, there will be an enhanced scope for penetrating into areas that were previously difficult to reach. Localization of production and after-sales services will overcome challenges associated with implementation. Strategic alliances, involvement of academia and customized training programs will pave the way for adoption within the regional healthcare landscape. Harmonization of regulations and customization of products to local needs will facilitate investments.
Market of Automated Visual Field Analyzers in Japan can be attributed to its highly developed system of medical research along with its penchant for employing highly precise devices. The presence of strong hospitals and eye care clinics helps in conducting thorough testing of the device technology before incorporating it into diagnostic procedures. Strong interaction between industry and academic organizations further ensures continuous improvement and training.
South Korean Automated Visual Field Analyzer market is developing fast due to the fast adoption of the latest technologies and a highly advanced environment for medical devices. The ability to manufacture these devices locally and the innovative culture within the clinical environment promote improvements in devices’ performance. The combination of integration with digital health systems and focus on telemedicine ensures that the scope of their application extends even to out-of-hospital facilities.
To know more about the market opportunities by region and country, click here to
Buy The Complete Report
Increasing Prevalence of Glaucoma
Due to the high number of patients suffering from conditions such as glaucoma and visual field loss, there will be an increased number of patients who need routine assessment, hence, the increase in the need for visual field analyzers. The need to obtain results that can assist in diagnosis and decision-making leads to clinics buying more advanced instruments. Increased awareness about visual field diseases leads to early detection, hence, continuous use of the analyzer within the clinical setting.
Technological Advancements and Integration
Ongoing advancements in technology related to imaging, software algorithms, and interfaces enable better accuracy and usability of automated perimetric devices, encouraging medical professionals to upgrade old devices and install new ones in their practices. Improved networking capabilities and integration with electronic medical records allow for an easier workflow and more efficient record keeping, thus making the devices more appealing to medical practitioners. With continued efforts at improving the ergonomic design of the devices and testing procedures to make them more suited for different clinical settings, the market will continue to grow.
High Equipment and Maintenance Costs
A high initial cost, frequent calibration requirements, and maintenance costs become an economic constraint for many organizations, leading to reluctance on their part to buy and replace existing systems. Small clinics with tight budgets are likely to hold off their purchases in such situations, resulting in lower market penetration and reduced demand from particular markets. Budgeting considerations will play a crucial role in the timing of upgrading existing equipment and affect purchasing decisions by virtue of total cost of ownership.
Regulatory and Reimbursement Challenges
Different regulatory requirements in various regions result in increased duration before products reach the market and create additional challenges for manufacturers in terms of regulatory compliance, which may hinder the process of innovating and introducing new products. Inconsistent or ambiguous reimbursement rules reduce the likelihood of reimbursement and thus the motivation for adoption on the part of healthcare facilities since they may be uncertain as to whether their claim will be accepted.
Request Free Customization of this report to help us to meet your business objectives.
The rivalry in the market for automated visual field analyzers is seen to be based on two main areas: technology differentiation and consolidation along the routes to market. Incumbents have been pursuing M&A activities and collaborations, while native virtual reality companies have focused on FDA/CE approval and distributors' tie-ups. Topcon's acquisition of an AI company known as Toku for advancing their oculomics capabilities and VEO Ophthalmics partnering commercially with PeriVision to distribute its VisionOne VR platform are among some of the examples here.
AI-enabled Diagnostics: Modern machine learning techniques find application in advanced automated visual field analyzers that aid in pattern recognition, prioritizing significant clinical findings, and providing reliable decision support. This change makes clinicians more confident about the results obtained from using such automated tools owing to the fact that there is lesser subjectivity involved in the process. Linking with the electronic health record system allows for contextualization of results. Vendors focus on explainability and clinician-in-the-loop designs to promote acceptance, while model updating ensures improved performance and clinical alignment.
Teleophthalmology and Remote Screening: Increased adoption of decentralized approaches to healthcare is leading to an expansion of automated visual field tests from specialized centers to primary care settings, community screenings, and even home testing. The portability of the device and networking capability allow for early detection of problems and efficient referral processes, making tests more accessible to disadvantaged groups. Focus on interoperability of data transfer and collaborative workflow facilitates teamwork between technicians and specialists.
SkyQuest’s ABIRAW (Advanced Business Intelligence, Research & Analysis Wing) is our Business Information Services team that Collects, Collates, Correlates, and Analyses the Data collected by means of Primary Exploratory Research backed by robust Secondary Desk research.
As per SkyQuest analysis, the key driver behind the growth of the global market for automated visual field analyzers is the rising incidence of glaucoma, which leads to testing and usage of such devices, whereas another barrier hindering the market is the high cost associated with the machinery as well as its maintenance. The dominant region of the market is North America owing to advanced healthcare infrastructure along with quick adoption of technology, and the leading product type of the market is static perimeters on account of their wide applicability in clinical settings.
| Report Metric | Details |
|---|---|
| Market size value in 2024 | USD 208.66 Million |
| Market size value in 2033 | USD 356.13 Million |
| Growth Rate | 6.12% |
| Base year | 2024 |
| Forecast period | (2026-2033) |
| Forecast Unit (Value) | USD Million |
| Segments covered |
|
| Regions covered | North America (US, Canada), Europe (Germany, France, United Kingdom, Italy, Spain, Rest of Europe), Asia Pacific (China, India, Japan, Rest of Asia-Pacific), Latin America (Brazil, Rest of Latin America), Middle East & Africa (South Africa, GCC Countries, Rest of MEA) |
| Companies covered |
|
| Customization scope | Free report customization with purchase. Customization includes:-
|
To get a free trial access to our platform which is a one stop solution for all your data requirements for quicker decision making. This platform allows you to compare markets, competitors who are prominent in the market, and mega trends that are influencing the dynamics in the market. Also, get access to detailed SkyQuest exclusive matrix.
Table Of Content
Executive Summary
Market overview
Parent Market Analysis
Market overview
Market size
KEY MARKET INSIGHTS
COVID IMPACT
MARKET DYNAMICS & OUTLOOK
Market Size by Region
KEY COMPANY PROFILES
Methodology
For the Automated Visual Field Analyzer Market, our research methodology involved a mixture of primary and secondary data sources. Key steps involved in the research process are listed below:
1. Information Procurement: This stage involved the procurement of Market data or related information via primary and secondary sources. The various secondary sources used included various company websites, annual reports, trade databases, and paid databases such as Hoover's, Bloomberg Business, Factiva, and Avention. Our team did 45 primary interactions Globally which included several stakeholders such as manufacturers, customers, key opinion leaders, etc. Overall, information procurement was one of the most extensive stages in our research process.
2. Information Analysis: This step involved triangulation of data through bottom-up and top-down approaches to estimate and validate the total size and future estimate of the Automated Visual Field Analyzer Market.
3. Report Formulation: The final step entailed the placement of data points in appropriate Market spaces in an attempt to deduce viable conclusions.
4. Validation & Publishing: Validation is the most important step in the process. Validation & re-validation via an intricately designed process helped us finalize data points to be used for final calculations. The final Market estimates and forecasts were then aligned and sent to our panel of industry experts for validation of data. Once the validation was done the report was sent to our Quality Assurance team to ensure adherence to style guides, consistency & design.
Analyst Support
Customization Options
With the given market data, our dedicated team of analysts can offer you the following customization options are available for the Automated Visual Field Analyzer Market:
Product Analysis: Product matrix, which offers a detailed comparison of the product portfolio of companies.
Regional Analysis: Further analysis of the Automated Visual Field Analyzer Market for additional countries.
Competitive Analysis: Detailed analysis and profiling of additional Market players & comparative analysis of competitive products.
Go to Market Strategy: Find the high-growth channels to invest your marketing efforts and increase your customer base.
Innovation Mapping: Identify racial solutions and innovation, connected to deep ecosystems of innovators, start-ups, academics, and strategic partners.
Category Intelligence: Customized intelligence that is relevant to their supply Markets will enable them to make smarter sourcing decisions and improve their category management.
Public Company Transcript Analysis: To improve the investment performance by generating new alpha and making better-informed decisions.
Social Media Listening: To analyze the conversations and trends happening not just around your brand, but around your industry as a whole, and use those insights to make better Marketing decisions.
REQUEST FOR SAMPLE
 REQUEST FREE CUSTOMIZATION
Global Automated Visual Field Analyzer Market size was valued at USD 208.66 Million in 2024 and is poised to grow from USD 221.43 Million in 2025 to USD 356.13 Million by 2033, growing at a CAGR of 6.12% during the forecast period (2026-2033).
Competitive pressure in the global automated visual field analyzer market is concentrated on technology differentiation and route to market consolidation, with incumbents using acquisitions and platform partnerships while VR native firms pursue FDA and CE pathways and distributor deals. Notable examples include Topcon’s acquisition of AI company Toku to expand oculomics and VEO Ophthalmics’ commercial partnership to roll out PeriVision’s VisionOne VR platform, showing M&A plus distribution alliances and product innovation as active competitive strategies. 'PeriVision SA: Established in 2022, their main objective is to develop AI and VR powered visual field testing platforms that shorten test time and integrate cloud analytics into glaucoma care. Recent development: raised a CHF 2.4 million seed round, secured CE marking and U.S. regulatory registration, and entered a U.S. distribution partnership with VEO Ophthalmics to launch the VisionOne platform combining proprietary SORS AI perimetry with headset hardware and cloud workflow to speed clinical adoption.', 'Virtual Vision Health: Established in 2020, their main objective is to deliver cloud enabled VR headset based visual field testing for clinics and remote care, making standard perimetry more portable and patient friendly. Recent development: completed clinical pilots and commercial deployments in U.S. clinics, raised venture capital from Govo Venture Partners and GT Ventures, and expanded commercial channels to integrate test results into practice electronic records and telehealth workflows.', 'Carl Zeiss Meditec', 'Topcon Corporation', 'Haag-Streit', 'Nidek', 'OCULUS Optikgeräte', 'Kowa Company', 'Heidelberg Engineering', 'Takagi Seiko', 'CenterVue', 'Metrovision', 'Medmont International', 'Konan Medical', 'Optopol Technology', 'Visionix', 'Frey', 'Righton', 'Icare Finland', 'Humphrey', 'Henson', 'Virtual Field'
The rising prevalence of glaucoma and other visual field impairments expands the pool of patients requiring routine assessment, which increases demand for automated visual field analyzers. Clinicians prioritize reliable, reproducible testing to support diagnosis, monitoring, and treatment decisions, prompting clinics to acquire advanced instruments. Screening initiatives and heightened disease awareness encourage earlier detection and follow-up, creating steady clinical utilization. This sustained clinical need stimulates manufacturers to enhance device capabilities and distribution, reinforcing market expansion through broader adoption across ophthalmic care settings.
Ai Enabled Diagnostics: Advanced machine learning algorithms are increasingly embedded in automated visual field analyzers to enhance pattern recognition, prioritize clinically meaningful abnormalities, and deliver consistent decision support. This qualitative shift improves clinician confidence by reducing subjective variability and streamlining interpretation workflows. Integration with electronic health records promotes contextualized insights and longitudinal monitoring. Vendors emphasize explainability and clinician-in-the-loop designs to foster adoption, while iterative model refinement through routine clinical use sustains continuous performance improvements and aligns devices with evolving clinical practice.
Why does North America Dominate the Global Automated Visual Field Analyzer Market? |@12


Want to customize this report? This report can be personalized according to your needs. Our analysts and industry experts will work directly with you to understand your requirements and provide you with customized data in a short amount of time. We offer $1000 worth of FREE customization at the time of purchase.
Feedback From Our Clients


 USA (+1) 351-333-4748

