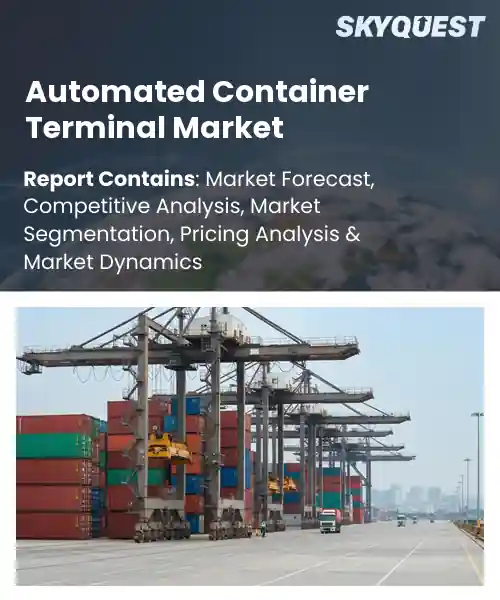
Automated Container Terminal Market
Report ID: SQMIG20Y2021
Report ID: SQMIG20Y2021
[email protected]
USA +1 351-333-4748
Report ID:
SQMIG20Y2021 |
Region:
Global |
Published Date: July, 2026
Pages:
157
|Tables:
172
|Figures:
79


Global Automated Container Terminal Market size was valued at USD 12.45 Billion in 2024 and is poised to grow from USD 13.39 Billion in 2025 to USD 23.93 Billion by 2033, growing at a CAGR of 7.53% during the forecast period (2026-2033).
The global automated container terminal industry deploys robotic cranes, guided vehicles, and intelligent software to move containers without human hands. Its importance arises from the relentless rise in world trade, which forces ports to accommodate larger vessels while maintaining berth times. The primary driver is the surge in TEU throughput; as ships double in size, manual handling becomes a bottleneck, compelling operators to invest in automation to stay competitive.
Automation cuts dependence on shore‑based labor, lowering operating expenses and reducing safety incidents, which makes the investment attractive. Policy incentives for emission equipment boost adoption; electric guided vehicles diminish port carbon footprints and help meet regulatory targets. Cases include Port of Los Angeles, where an AI yard‑planning tool introduced in 2022 trimmed container‑move time by 15 percent, and Dubai’s DP World, which launched a electric quay‑crane fleet that secured eco‑focused contracts. These developments reveal how labor, cost, and sustainability pressures converge to expand market opportunity.
How are AI and IoT driving efficiency in the automated container terminal market?
AI and IoT are reshaping automated container terminals by linking equipment, vessels and yard operations into a single data fabric. Machine learning models predict crane cycles, berth availability and maintenance needs while sensors stream real time location, load and environmental information. The combined insight enables dynamic scheduling, reduces idle time and lowers energy consumption. Operators now see a more responsive yard where autonomous straddle carriers adjust routes on the fly and gantry cranes fine tune speeds based on cargo weight. This convergence creates a self optimizing ecosystem that boosts throughput and supports the growing demand for faster, greener supply chains.
DP World in June 2023, introduced its AI driven MarePort platform at the Jebel Ali terminal integrating IoT sensor data from cranes and yard vehicles. The system continuously optimizes berth allocation and equipment dispatch delivering smoother flows and higher productivity that illustrate how AI and IoT fuel market growth.
Market snapshot - (2026-2033)
Global Market Size
USD 12.45 Billion
Largest Segment
Semi-Automated Container Terminal
Fastest Growth
Fully Automated Container Terminal
Growth Rate
7.53% CAGR
To get more insights on this market click here to Request a Free Sample Report
Global automated container terminal market is segmented by automation level, automation solution, terminal size, cargo throughput capacity, deployment, end user and region. Based on automation level, the market is segmented into Semi-Automated Container Terminal and Fully Automated Container Terminal. Based on automation solution, the market is segmented into Automated Guided Vehicles (AGVs), Automated Stacking Cranes (ASCs), Ship-to-Shore (STS) Cranes, Terminal Operating Systems (TOS), Gate Automation Systems and Others. Based on terminal size, the market is segmented into Small Terminal, Medium Terminal and Large Terminal. Based on cargo throughput capacity, the market is segmented into Below 1 Million TEU, 1–3 Million TEU and Above 3 Million TEU. Based on deployment, the market is segmented into Greenfield Automation Projects and Brownfield Automation Projects. Based on end user, the market is segmented into Port Authorities, Terminal Operators and Shipping Line-Owned Terminals. Based on region, the market is segmented into North America, Europe, Asia Pacific, Latin America and Middle East & Africa.
Fully automated container terminal segment dominates because it eliminates manual handling, thereby accelerating vessel turnaround and reducing labor costs. The integration of advanced robotics, AI driven scheduling, and seamless data exchange creates a consistently high productivity environment. Operators value the reliability and scalability that full automation offers, which drives investment decisions and secures its leadership position within the market. These benefits also align with sustainability goals, as reduced diesel equipment lowers emissions, further encouraging ports to adopt full automation.
As per automated container terminal market outlook, semi automated container terminal segment is witnessing the strongest growth momentum because ports seek incremental efficiency while managing capital constraints. The modular nature of semi automation allows gradual integration of robotic equipment, which meets immediate productivity needs and streamlines technology adoption pathways, fueling rapid market expansion and new investment opportunities.
Automated stacking cranes segment leads because they maximize yard density, enhance stack precision, and operate continuously with minimal human oversight. Their ability to handle diverse container sizes and integrate with terminal operating systems streamlines space utilization, which is critical for high throughput ports. The proven reliability and cost efficiency of ASCs reinforce their preferred status among operators. Because they reduce dwell time and support real time inventory tracking, terminals can achieve higher equipment productivity and meet demanding service level expectations, solidifying their leadership role.
As per automated container terminal market analysis, automated guided vehicles segment emerges as the key high growth segment because they provide flexible, point to point transport without fixed infrastructure. Their scalability enables ports to quickly adapt to fluctuating volumes, and advances in battery technology extend operational endurance. As terminals pursue greater automation agility, AGVs accelerate overall system efficiency and open new pathways for expansion.
To get detailed segments analysis, Request a Free Sample Report
Asia Pacific leads the global automated container terminal market due to a confluence of advanced logistics networks, high trade volumes, and strong governmental commitment to modern port infrastructure. The region benefits from deep‑water ports that accommodate ultra‑large vessels, fostering demand for sophisticated handling systems. Leading shipbuilders and technology providers collaborate closely with port authorities, accelerating adoption of robotics, AI‑driven scheduling, and integrated terminal operating systems. Port authorities in key hubs align infrastructure upgrades with national green agendas, further incentivizing deployment of electric yard tractors and hybrid crane systems. Educational initiatives and research partnerships with maritime academies ensure a skilled workforce capable of managing sophisticated automated environments, reinforcing Asia Pacific’s dominant market position and setting a global standard for efficient, sustainable container handling.
As per automated container terminal market regional outlook, Japan demonstrates a strong alignment between domestic shipping giants and cutting‑edge technology firms, fostering rapid deployment of high‑precision robotic systems. Collaboration with leading electronics manufacturers enables integration of advanced sensor networks and real‑time analytics, improving vessel turnaround. Emphasis on safety standards and workforce upskilling ensures smooth transitions, while policy incentives support green energy adoption, positioning Japan as a showcase of resilient, eco‑focused terminal automation.
South Korea leverages a robust manufacturing base and a proactive government agenda to accelerate adoption of autonomous handling equipment. Partnerships with global robotics leaders facilitate integration of AI‑driven stacking solutions that optimize yard space. Investment in digital twin platforms enhances predictive maintenance, reducing unplanned downtime. The focus on export‑oriented ports combined with sustainability targets reinforces South Korea’s reputation as a hub for innovative, high‑efficiency container operations.
Europe experiences rapid expansion of the automated container terminal market as ports prioritize digital transformation, environmental stewardship, and integration of cross‑border logistics networks. Strong regulatory frameworks encourage investment in low‑emission equipment and energy‑efficient crane technologies, while collaborative consortia between operators and technology providers accelerate standardization of software platforms. The region’s dense trade corridors and intermodal connectivity demand highly reliable, automated solutions to maintain competitiveness. Growing emphasis on data‑driven decision making, supported by advanced analytics and machine‑learning applications, enhances capacity planning and reduces congestion. Port authorities in key hubs align infrastructure upgrades with national green agendas, further incentivizing deployment of electric yard tractors and hybrid crane systems. Educational initiatives and research partnerships with maritime academies ensure a skilled workforce capable of managing sophisticated automated environments, reinforcing Europe’s position as a leader in sustainable terminal innovation.
As per automated container terminal market regional forecast, Germany benefits from an engineering sector and a logistics strategy that places automation at the core of port modernization. Collaboration between equipment manufacturers and terminal operators drives adoption of gantry cranes and AI‑enabled yard management systems. Emphasis on energy efficiency aligns with climate commitments, prompting integration of electric propulsion and renewable power sources. This creates a reliable environment that sets benchmarks for operational excellence in Europe.
United Kingdom stands as a dominant hub due to smart‑port investment and a regulatory framework that supports innovation. Leading terminals use autonomous straddle carriers and data platforms to improve vessel berthing efficiency. Academic research centres and industry speed development of predictive analytics for yard operations. Commitment to green standards drives adoption of low‑emission equipment, reinforcing the United Kingdom’s position as a modern benchmark for container handling.
France is emerging as a focal point for automation pilots, supported by incentives for digitalization and compliance. Ports experiment with modular robotic systems and AI‑driven scheduling tools that can be scaled across terminal layouts. Ties with European research institutions foster development of vision systems for container identification. This collaborative ecosystem nurtures a flexible, future‑ready approach that positions France as a catalyst for next‑generation automated terminal solutions.
North America is strengthening its position in the automated container terminal market through a combination of strategic infrastructure upgrades, robust private‑sector investment, and a focus on integrating advanced data analytics with existing terminal operations. Leading ports are adopting autonomous yard tractors and AI‑optimized crane scheduling to boost throughput while reducing labor intensity. Collaboration between technology startups and legacy terminal operators accelerates the rollout of digital twin environments that enhance predictive maintenance and operational planning. Governmental support for clean‑energy initiatives encourages the shift to electric‑powered handling equipment, aligning with broader sustainability goals. Port authorities also prioritize workforce development programs that equip operators with the skills required to manage sophisticated automated systems, ensuring a seamless transition toward higher productivity.
United States leads with deployments of autonomous crane fleets and AI‑driven yard orchestration platforms that streamline vessel turnaround. Coastal hubs integrate cloud‑based analytics to monitor equipment health and optimize resource allocation in time. Partnerships with technology innovators foster improvement of machine‑vision systems for container identification. Commitment to decarbonization drives adoption of electric straddle carriers, positioning the United States as a benchmark for environmentally conscious terminal automation.
Canada emphasizes automation solutions that can be tailored to a range of port sizes and cargo mixes. Investments focus on autonomous guided vehicles and AI‑based dispatch software that enhance flexibility and reduce operational costs. Collaboration with institutions accelerates development of sensor fusion technologies for container tracking. Environmental priorities drive adoption of power systems for handling equipment, positioning Canada as a market that balances efficiency with sustainability.
To know more about the market opportunities by region and country, click here to
Buy The Complete Report
Increasing Port Throughput Demands
Labor Shortages Accelerating Adoption
High Capital Investment Requirements
Regulatory and Safety Compliance Complexities
Request Free Customization of this report to help us to meet your business objectives.
The competitive landscape of the global automated container terminal indutry is shaped by intense rivalry among technology providers and terminal operators, each leveraging strategic mergers, joint ventures, and advanced robotics to secure market share. Recent M&A activity includes acquisitions aimed at integrating AI‑driven yard management systems, while partnerships focus on deploying autonomous straddle carriers and digital twins to improve throughput and reduce labor costs. Innovation drives differentiation, with firms investing in modular automation solutions that can be retrofitted into existing terminals, accelerating adoption across emerging ports.
SkyQuest’s ABIRAW (Advanced Business Intelligence, Research & Analysis Wing) is our Business Information Services team that Collects, Collates, Correlates, and Analyses the Data collected by means of Primary Exploratory Research backed by robust Secondary Desk research.
As per SkyQuest analysis, the market is being propelled primarily by the surge in global port throughput which pushes terminals to adopt automation for faster vessel turnaround, while a second important driver is the persistent labor shortage that forces operators to replace manual handling with robotic systems. However, the high capital investment required for cranes, guided vehicles and control software acts as a restraint, especially for smaller ports. Asia Pacific remains the dominant region, benefitting from massive trade volumes and strong government support. The fully automated container terminal segment leads the market, offering end‑to‑end robotic handling that maximizes productivity and aligns with sustainability goals. The global automated container terminal market trend is witnessing significant growth, driven by the increasing need for efficient port operations, rising container volumes, labor optimization requirements, and the adoption of advanced automation technologies in maritime logistics.
| Report Metric | Details |
|---|---|
| Market size value in 2024 | USD 12.45 Billion |
| Market size value in 2033 | USD 88.44 Billion |
| Growth Rate | 7.53% |
| Base year | 2024 |
| Forecast period | (2026-2033) |
| Forecast Unit (Value) | USD Billion |
| Segments covered |
|
| Regions covered | North America (US, Canada), Europe (Germany, France, United Kingdom, Italy, Spain, Rest of Europe), Asia Pacific (China, India, Japan, Rest of Asia-Pacific), Latin America (Brazil, Rest of Latin America), Middle East & Africa (South Africa, GCC Countries, Rest of MEA) |
| Companies covered |
|
| Customization scope | Free report customization with purchase. Customization includes:-
|
To get a free trial access to our platform which is a one stop solution for all your data requirements for quicker decision making. This platform allows you to compare markets, competitors who are prominent in the market, and mega trends that are influencing the dynamics in the market. Also, get access to detailed SkyQuest exclusive matrix.
Table Of Content
Executive Summary
Market overview
Parent Market Analysis
Market overview
Market size
KEY MARKET INSIGHTS
COVID IMPACT
MARKET DYNAMICS & OUTLOOK
Market Size by Region
KEY COMPANY PROFILES
Methodology
For the Automated Container Terminal Market, our research methodology involved a mixture of primary and secondary data sources. Key steps involved in the research process are listed below:
1. Information Procurement: This stage involved the procurement of Market data or related information via primary and secondary sources. The various secondary sources used included various company websites, annual reports, trade databases, and paid databases such as Hoover's, Bloomberg Business, Factiva, and Avention. Our team did 45 primary interactions Globally which included several stakeholders such as manufacturers, customers, key opinion leaders, etc. Overall, information procurement was one of the most extensive stages in our research process.
2. Information Analysis: This step involved triangulation of data through bottom-up and top-down approaches to estimate and validate the total size and future estimate of the Automated Container Terminal Market.
3. Report Formulation: The final step entailed the placement of data points in appropriate Market spaces in an attempt to deduce viable conclusions.
4. Validation & Publishing: Validation is the most important step in the process. Validation & re-validation via an intricately designed process helped us finalize data points to be used for final calculations. The final Market estimates and forecasts were then aligned and sent to our panel of industry experts for validation of data. Once the validation was done the report was sent to our Quality Assurance team to ensure adherence to style guides, consistency & design.
Analyst Support
Customization Options
With the given market data, our dedicated team of analysts can offer you the following customization options are available for the Automated Container Terminal Market:
Product Analysis: Product matrix, which offers a detailed comparison of the product portfolio of companies.
Regional Analysis: Further analysis of the Automated Container Terminal Market for additional countries.
Competitive Analysis: Detailed analysis and profiling of additional Market players & comparative analysis of competitive products.
Go to Market Strategy: Find the high-growth channels to invest your marketing efforts and increase your customer base.
Innovation Mapping: Identify racial solutions and innovation, connected to deep ecosystems of innovators, start-ups, academics, and strategic partners.
Category Intelligence: Customized intelligence that is relevant to their supply Markets will enable them to make smarter sourcing decisions and improve their category management.
Public Company Transcript Analysis: To improve the investment performance by generating new alpha and making better-informed decisions.
Social Media Listening: To analyze the conversations and trends happening not just around your brand, but around your industry as a whole, and use those insights to make better Marketing decisions.
REQUEST FOR SAMPLE
 REQUEST FREE CUSTOMIZATION
Global Automated Container Terminal Market size was valued at USD 12.45 Billion in 2024 and is poised to grow from USD 13.39 Billion in 2025 to USD 88.44 Billion by 2033, growing at a CAGR of 7.53% during the forecast period (2026-2033).
The competitive landscape of the global automated container terminal market is shaped by intense rivalry among technology providers and terminal operators, each leveraging strategic mergers, joint ventures, and advanced robotics to secure market share. Recent M&A activity includes acquisitions aimed at integrating AI‑driven yard management systems, while partnerships focus on deploying autonomous straddle carriers and digital twins to improve throughput and reduce labor costs. Innovation drives differentiation, with firms investing in modular automation solutions that can be retrofitted into existing terminals, accelerating adoption across emerging ports. 'Cargotec Corporation', 'Konecranes Oyj', 'ZPMC', 'Liebherr-International AG', 'Mitsui E&S Holdings Co Ltd', 'Terberg Group BV', 'ABB Ltd', 'Siemens AG', 'Trelleborg AB', 'Cavotec SA', 'Conductix-Wampfler GmbH', 'Gaussin SA', 'Hyster-Yale Materials Handling Inc', 'Toyota Industries Corporation', 'Kuenz', 'ORBCOMM Inc', 'Identec Solutions AG', 'Inmarsat Global Product', 'Navis LLC', 'CyberLogitec'
The surge in global trade volumes pushes ports to handle larger container flows, prompting operators to adopt automated handling systems that can process ships faster and with fewer human errors, thereby enhancing overall terminal efficiency and reducing vessel turnaround times, which directly supports market expansion as stakeholders seek solutions that align with growing throughput requirements and competitive logistics strategies. The integration of advanced sensors, AI-driven scheduling, and remote monitoring enables continuous performance optimisation, further encouraging investment in automation technologies across emerging and established ports worldwide.
Ai-Powered Predictive Scheduling: Port operators are increasingly adopting AI-driven predictive scheduling platforms that continuously analyze vessel arrival patterns, equipment availability, and yard congestion to generate dynamic work orders. By forecasting bottlenecks minutes in advance, these systems enable real‑time reallocation of automated stackers and quay cranes, reducing idle time and accelerating container flow. The resulting operational agility enhances service reliability, supports tighter shipping windows, and strengthens competitive positioning for terminals that embed intelligent orchestration into their automation layer, driving long‑term profitability growth and resilience.
Why does Asia Pacific Dominate the Global Automated Container Terminal Market? |@12


Want to customize this report? This report can be personalized according to your needs. Our analysts and industry experts will work directly with you to understand your requirements and provide you with customized data in a short amount of time. We offer $1000 worth of FREE customization at the time of purchase.
Feedback From Our Clients


 USA (+1) 351-333-4748

