Augmented Reality (AR) Shopping Market

Augmented Reality (AR) Shopping Market Size, Share, Growth Analysis, By End Use(Retail / In-Store, E-Commerce / Out of Store), By AR Technology(Marker-based AR, Passive Marker), By Offering(Hardware, Displays and Projectors), By Device Type(AR Head-Mounted Displays (HMD), Smart AR Mirror), By Application(Try-on Solutions, Planning & Designing), By Market Type(Apparel, Furniture & Lighting), By Region(North America, Europe) - Industry Forecast 2024-2031


Report ID: UCMIG45A2114 | Region: Global | Published Date: Upcoming |
Pages: 165 | Tables: 55 | Figures: 60

Augmented Reality (AR) Shopping Market Insights

Market Overview:

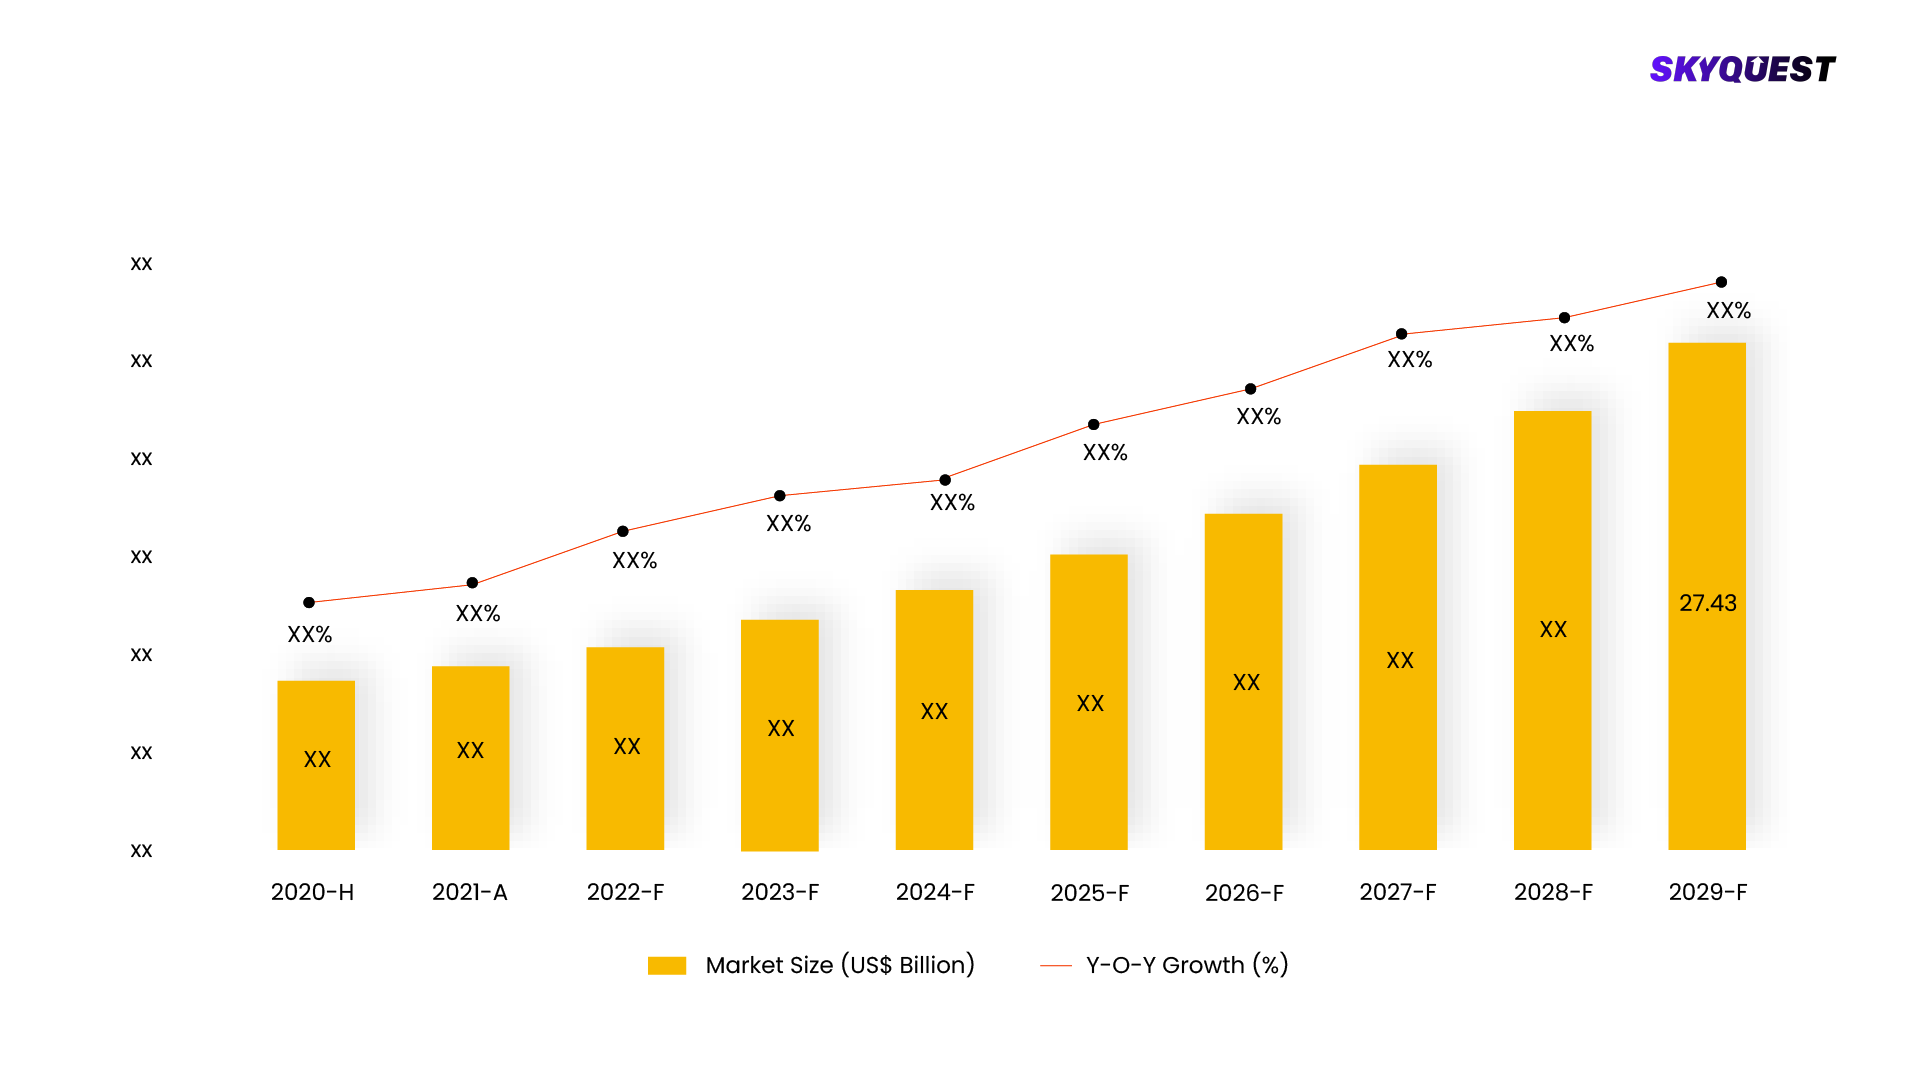
The market for augmented reality (AR) shopping is anticipated to grow at a CAGR of 28.0% from 2023 to 2028, when it is expected to reach USD 3.4 billion.One of the main drivers fueling the augmented shopping market's expansion is the rising need for customized try-on and try-in options, both online and in-store.

Augmented Reality (AR) Shopping Market, Forecast & Y-O-Y Growth Rate, 2020 - 2028
ForecastGrowthRate
To get more reports on the above market click here to
GET FREE SAMPLE

This report is being written to illustrate the market opportunity by region and by segments, indicating opportunity areas for the vendors to tap upon. To estimate the opportunity, it was very important to understand the current market scenario and the way it will grow in future.

Production and consumption patterns are being carefully compared to forecast the market. Other factors considered to forecast the market are the growth of the adjacent market, revenue growth of the key market vendors, scenario-based analysis, and market segment growth.

The market size was determined by estimating the market through a top-down and bottom-up approach, which was further validated with industry interviews. Considering the nature of the market we derived the Internet Software & Services by segment aggregation, the contribution of the Internet Software & Services in Software & Services and vendor share.

To determine the growth of the market factors such as drivers, trends, restraints, and opportunities were identified, and the impact of these factors was analyzed to determine the market growth. To understand the market growth in detail, we have analyzed the year-on-year growth of the market. Also, historic growth rates were compared to determine growth patterns.

Segmentation Analysis:

The Augmented Reality (AR) Shopping Market is segmented by End Use, AR Technology, Offering, Device Type, Application, Market Type, Region. We are analyzing the market of these segments to identify which segment is the largest now and in the future, which segment has the highest growth rate, and the segment which offers the opportunity in the future.

Augmented Reality (AR) Shopping Market Basis Point Share Analysis, 2021 Vs. 2028
BasisPointShareAnalysis
To get detailed analysis on all segments
BUY NOW
  • Based on End Use the market is segmented as, Retail / In-Store, E-Commerce / Out of Store
  • Based on AR Technology the market is segmented as, Marker-based AR, Passive Marker, Active Marker, Markerless AR, Markerless AR, by Technology,, Model-based Tracking, Image-based Tracking, Markerless AR, by Type, Projection-based AR, Superimposition-based AR, Location-based AR
  • Based on Offering the market is segmented as, Hardware, Displays and Projectors, Cameras, Sensors, Accelerometer, Gyroscope, Magnetometer, Proximity Sensor, Others, Software, Software Development Kit, AR Visualization Software, AR Content Management System, Others, Services
  • Based on Device Type the market is segmented as, AR Head-Mounted Displays (HMD), Smart AR Mirror, Handheld Devices
  • Based on Application the market is segmented as, Try-on Solutions, Planning & Designing, Advertising & Marketing, Information Systems
  • Based on Market Type the market is segmented as, Apparel, Furniture & Lighting, Jewelry, Beauty & Cosmetics, Footwear, Groceries, Others
  • Based on Region the market is segmented as, North America, Europe, Asia Pacific, Rest of the World, KEY MARKET PLAYERS, PTC, Alphabet Inc., Microsoft, Apple

Regional Analysis:

Augmented Reality (AR) Shopping Market is being analyzed by North America, Europe, Asia-Pacific (APAC), Latin America (LATAM), Middle East & Africa (MEA) regions. Key countries including the U.S., Canada, Germany, France, UK, Italy, Spain, China, India, Japan, Brazil, GCC Countries, and South Africa among others were analyzed considering various micro and macro trends.

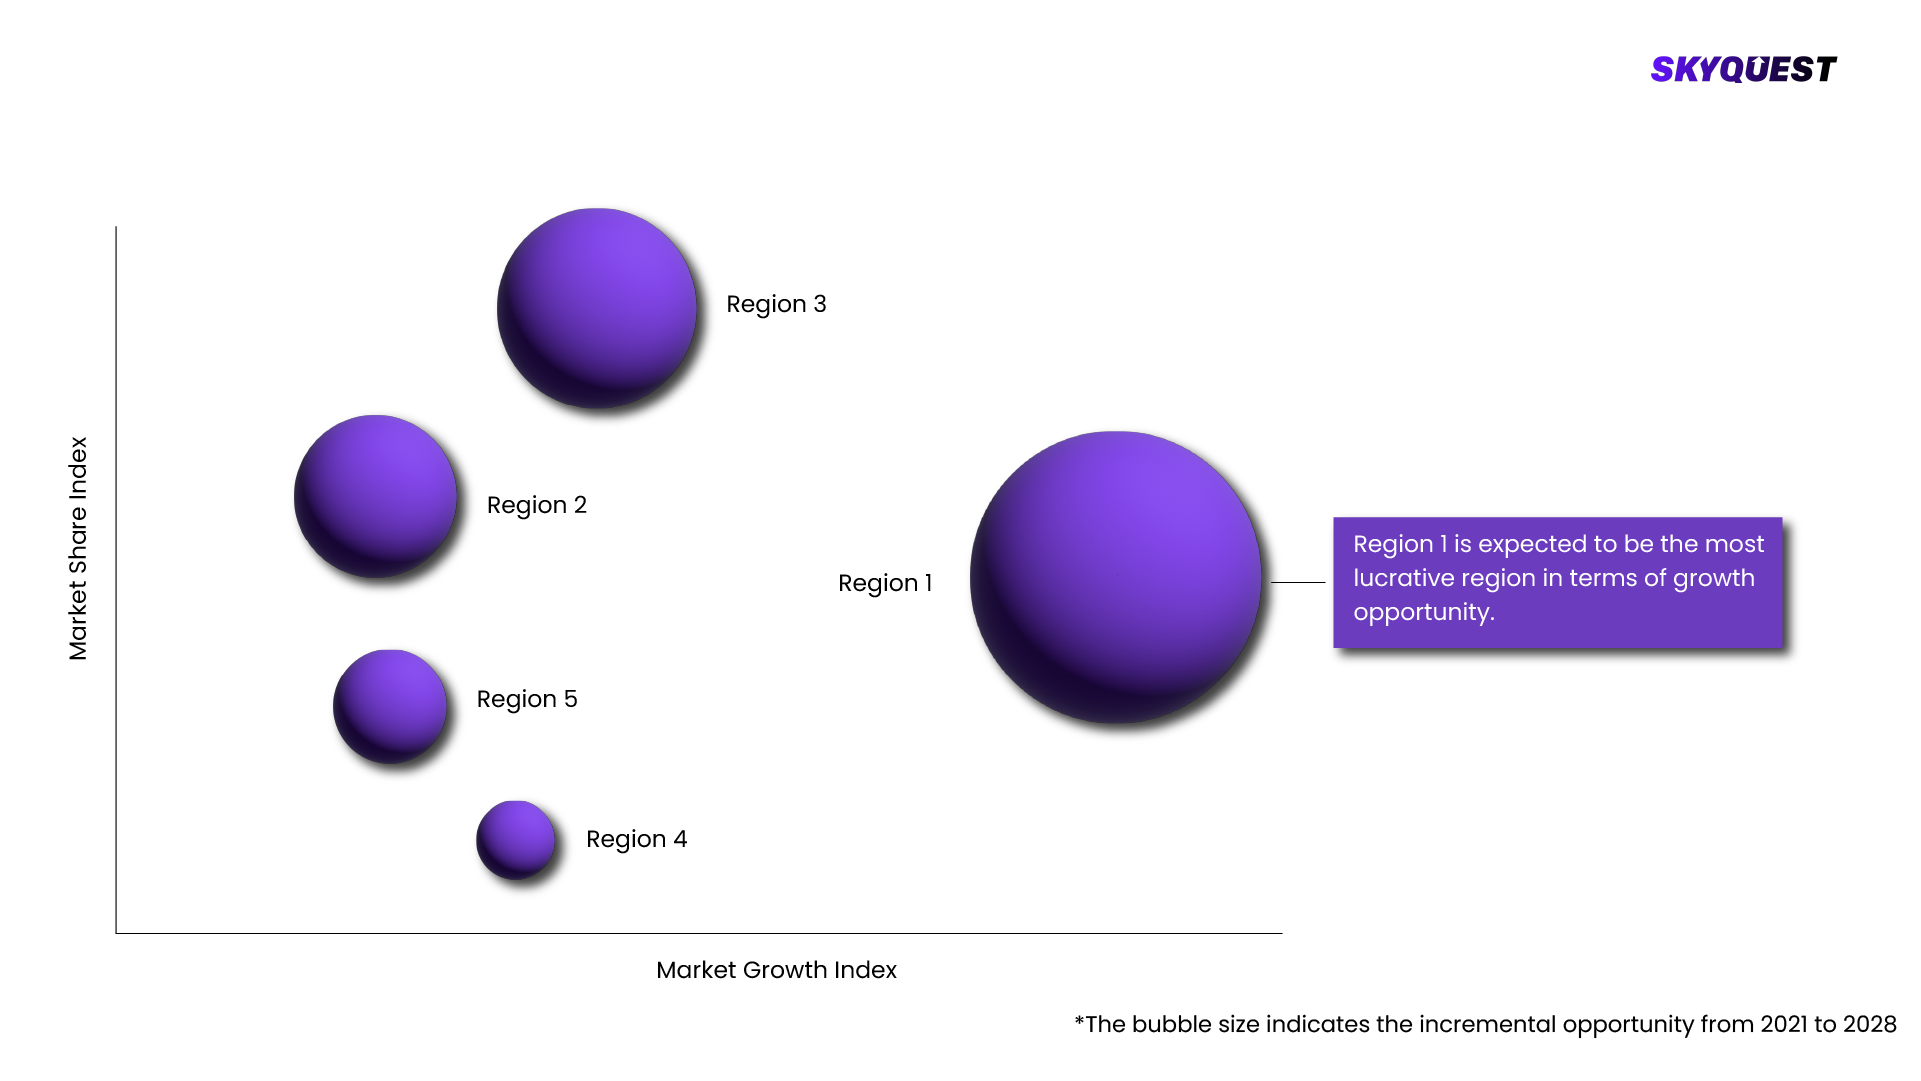
Augmented Reality (AR) Shopping Market Attractiveness Analysis, By Region 2020-2028
AttractivenessAnalysis
To know more about the market opportunities by region and country, click here to
REQUEST FREE CUSTOMIZATION

Augmented Reality (AR) Shopping Market : Risk Analysis

SkyQuest's expert analysts have conducted a risk analysis to understand the impact of external extremities on Augmented Reality (AR) Shopping Market. We analyzed how geopolitical influence, natural disasters, climate change, legal scenario, economic impact, trade & economic policies, social & ethnic concerns, and demographic changes might affect Augmented Reality (AR) Shopping Market's supply chain, distribution, and total revenue growth.

Competitive landscaping:

To understand the competitive landscape, we are analyzing key Augmented Reality (AR) Shopping Market vendors in the market. To understand the competitive rivalry, we are comparing the revenue, expenses, resources, product portfolio, region coverage, market share, key initiatives, product launches, and any news related to the Augmented Reality (AR) Shopping Market.

To validate our hypothesis and validate our findings on the market ecosystem, we are also conducting a detailed porter's five forces analysis. Competitive Rivalry, Supplier Power, Buyer Power, Threat of Substitution, and Threat of New Entry each force is analyzed by various parameters governing those forces.

Key Players Covered in the Report:

  • ed Reality (AR) shopping market is projected to reach USD 11.6 billion by 2028 from USD 3.4 billion in 2023 at a CAGR of 28.0% during the forecast period. Growing adoption of online shopping and e-commerce platforms, rising competition in market driving the need for brand differentiation, growing demand for personalized shopping experience are some of the major factors driving the market growth globally.
  • Driver: Growing demand for personalized shopping experience
  • Augmented reality (AR) is revolutionizing the shopping experience by offering personalized interactions. Unlike traditional online shopping, AR allows us to use our phones or devices to preview products in our own homes before making a purchase. This reduces the chances of disappointment and returns, enabling better decision-making. Retailers from various industries are utilizing AR to enhance personalization. Furniture stores like IKEA provide AR experiences to visualize furniture in our homes. Makeup brands such as NYX Professional Makeup and Sally Hansen offer virtual makeup try-ons. Nike even utilizes AR to measure our feet accurately for the right shoe size. Moreover, AR significantly impacts purchase behavior. Products with AR content have a higher chance of being bought compared to those without AR. When we can digitally interact and virtually try on products, we gain confidence in our purchases and reduce the likelihood of returns. AR creates a sense of being present in the store, making shopping enjoyable and leading to smarter choices.
  • Restraint: High cost of AR technology
  • AR technology requires specialized hardware, such as advanced cameras, sensors, and processors, to deliver immersive and interactive experiences. These hardware components can be expensive, making it challenging for retailers and brands to adopt AR shopping solutions on a large scale. In addition, developing AR applications and content requires specialized skills and expertise, which can also be costly. Businesses need to invest in hiring or training professionals who are proficient in AR development, adding to the overall cost.
  • The implementation costs associated with integrating AR infrastructure into existing e-commerce platforms or developing dedicated AR shopping apps can be a significant barrier. This encompasses the development of backend systems, ongoing maintenance, and continuous updates to ensure a seamless and high-quality AR shopping experience. Additionally, the high cost of AR hardware, such as headsets and smart glasses, presents a challenge for consumer adoption, as the investment required may deter potential users.
  • Opportunity: Lower costs of storage and efficient inventory management
  • The lower cost of storage and efficient inventory management present significant opportunities for the AR shopping industry . Augmented reality technology enables virtual shopping experiences, allowing consumers to explore and interact with virtual products in a realistic way. By integrating AR into the shopping experience, retailers can overcome traditional limitations of physical store space and inventory management.
  • The lower cost of storage becomes an opportunity as AR shopping eliminates the need for retailers to stock large quantities of physical inventory. Instead, retailers can maintain a virtual inventory of products, reducing the costs associated with warehousing, logistics, and physical store space. AR allows customers to virtually try on or test products, browse through virtual shelves, and make purchase decisions without the need for physical stock on hand. This streamlined approach to inventory management lowers costs and increases efficiency for retailers.
  • Challenge: Consumer Acceptance
  • Consumer acceptance poses a significant challenge for the AR shopping market. While augmented reality (AR) technology holds immense potential for enhancing shopping experiences, it relies on consumer adoption and acceptance to achieve widespread success. There are several factors which contribute to the challenge of gaining consumer acceptance.
  • Firstly, AR shopping requires users to embrace and adopt new technology. Not all consumers are familiar with AR or comfortable using it in their shopping routines. There may be a learning curve associated with understanding how to interact with AR interfaces and navigate virtual shopping experiences. This lack of familiarity can create a barrier to entry, hindering the adoption of AR shopping platforms.
  • Augmented Reality (AR) Shopping Market Ecosystem
  • The major players in the Augmented Reality (AR) shopping market with a significant global presence include PTC (US), Alphabet Inc., (US), Microsoft (US), Apple (US), Meta (US). These companies not only boast a comprehensive product portfolio but also have a strong geographic footprint.
  • Information System to register highest CAGR during the forecast period
  • The integration of information systems in AR Shopping apps and devices enhances transparency and empowers customers with relevant and accurate information. For instance, a customer using an AR Shopping app on their smartphone can scan a product's barcode and instantly retrieve detailed information about it, including specifications, pricing, and customer reviews. This allows customers to evaluate the product's features and quality, compare prices, and make well-informed decisions. Additionally, the app can provide real-time data on product availability, allowing customers to check if the item is in stock at nearby stores or online retailers is expected to drive the growth of AR shopping market.
  • AR Smart Mirror to account for the largest share of Augmented Reality (AR) shopping market during the forecast period
  • AR smart mirrors also benefit retailers by streamlining the fitting room process, reducing wait times, and enabling personalized recommendations. Beyond retail, AR smart mirrors have found applications in other industries, such as sports stadiums, where they provide fans with interactive experiences and opportunities to capture memorable moments. The increasing integration of AR technology in smart mirrors demonstrates its potential to revolutionize the way we shop and engage with our surroundings. Renowned brands like Ralph Lauren and H&M have successfully implemented smart mirrors in their stores, providing customers with convenient and customized try-on experiences. These are the major factor driving the growth of AR smart mirrors.
  • Software to account for the largest share of Augmented Reality (AR) shopping market during the forecast period
  • The software segment of augmented reality (AR) encompasses key components essential for AR development, visualization, and management. It includes Software Development Kits (SDKs) that provide developers with tools, libraries, and APIs to access AR functionalities like object tracking and spatial mapping. AR Visualization Software utilizes computer vision techniques and graphics rendering to seamlessly overlay virtual content onto the real-world environment, ensuring immersive experiences. AR Content Management Systems enable the organization, storage, and delivery of AR assets, allowing content creators to manage 3D models, animations, and videos. This comprehensive software ecosystem empowers developers and content creators to build and deploy engaging AR applications across different platforms and devices is expected to drive the growth of AR shopping market.
  • Asia Pacific to register the highest growth during the forecast period
  • Asia Pacific is expected to register the highest CAGR in the Augmented Reality (AR) shopping market from 2023 to 2028. The AR shopping market in Asia Pacific has witnessed numerous new developments and innovations. Companies like YouCam Makeup have pioneered such AR solutions in the region. Prominent retailers across the Asia Pacific region have embraced AR technology to enhance customer engagement and drive sales. For instance, Alibaba's e-commerce platform Taobao utilizes AR to enable virtual try-ons for cosmetic products, while JD.com has implemented AR features to visualize furniture and home decor items in customers' homes. These retailers provide immersive and interactive experiences, enhancing the shopping journey. The growth of the AR market in Asia Pacific can also be attributed to factors such as increasing usage of internet-based platforms, the continued rollout of high-speed 5G networks, and and advancements in technology.
  • Recent Developments
  • In November 2022, Google released new AR shopping features for finding the perfect foundation match and trying on sneakers in AR, providing a realistic and immersive online shopping experience.
  • In March 2021, PTC has launched Vuforia Engine Area Targets, the first offering in the market that supports the creation of immersive AR experiences for spaces up to 300,000 square feet. With the use of Area Targets, industrial organizations can create AR interfaces within their facilities.
  • In March 2021, Seiko Epson announced the enhancement of the AR glasses – Moverio BT-40 and BT – 40S by using Si-OLED technology to expand the field of view with full HD 1080p display resolution, improved connectivity, and comfort.
  • In September 2020, Microsoft partnershiped with Avatar Dimension, and selected it as the exclusive licensee for its volumetric capture technology in the Washington, D.C. area. Microsoft Mixed Reality Capture Studios certified the new studio after a rigorous testing process. The studio captures volumetric digital humans for business and governments, essential for powerful new virtual experiences across all categories.
  • In October 2020, Meta launched Oculus Quest 2, which can run as both a standalone headset with the internal android-based operating system and with Oculus compatible VR software running on desktop computers.
  • In March 2020, Apple released ARKi 3.5, which is an updated version of ARKi. The upgraded version has a new Scene Geometry application program interface (API) that uses the LiDAR scanner to create a 3D map of the space, differentiating between floors, walls, ceilings, windows, doors, and seats.
  • KEY MARKET SEGMENTS
  • By End Use
  • Retail / In-Store
  • E-Commerce / Out of Store
  • By AR Technology
  • Marker-based AR
  • Passive Marker
  • Active Marker
  • Markerless AR
  • Markerless AR, by Technology,
  • Model-based Tracking
  • Image-based Tracking
  • Markerless AR, by Type
  • Projection-based AR
  • Superimposition-based AR
  • Location-based AR
  • By Offering
  • Hardware
  • Displays and Projectors
  • Cameras
  • Sensors
  • Accelerometer
  • Gyroscope
  • Magnetometer
  • Proximity Sensor
  • Others
  • Software
  • Software Development Kit
  • AR Visualization Software
  • AR Content Management System
  • Others
  • Services
  • By Device Type
  • AR Head-Mounted Displays (HMD)
  • Smart AR Mirror
  • Handheld Devices
  • By Application
  • Try-on Solutions
  • Planning & Designing
  • Advertising & Marketing
  • Information Systems
  • By Market Type
  • Apparel
  • Furniture & Lighting
  • Jewelry
  • Beauty & Cosmetics
  • Footwear
  • Groceries
  • Others
  • By Region
  • North America
  • Europe
  • Asia Pacific
  • Rest of the World
  • KEY MARKET PLAYERS
  • PTC
  • Alphabet Inc.
  • Microsoft
  • Apple
  • Meta

SkyQuest's Expertise:

The Augmented Reality (AR) Shopping Market is being analyzed by SkyQuest's analysts with the help of 20+ scheduled Primary interviews from both the demand and supply sides. We have already invested more than 250 hours on this report and are still refining our date to provide authenticated data to your readers and clients. Exhaustive primary and secondary research is conducted to collect information on the market, peer market, and parent market.

Our cross-industry experts and revenue-impact consultants at SkyQuest enable our clients to convert market intelligence into actionable, quantifiable results through personalized engagement.

Scope Of Report

Report Attribute Details
The base year for estimation 2021
Historical data 2016 – 2022
Forecast period 2022 – 2028
Report coverage Revenue forecast, volume forecast, company ranking, competitive landscape, growth factors, and trends, Pricing Analysis
Segments covered
  • By End Use - Retail / In-Store, E-Commerce / Out of Store
  • By AR Technology - Marker-based AR, Passive Marker, Active Marker, Markerless AR, Markerless AR, by Technology,, Model-based Tracking, Image-based Tracking, Markerless AR, by Type, Projection-based AR, Superimposition-based AR, Location-based AR
  • By Offering - Hardware, Displays and Projectors, Cameras, Sensors, Accelerometer, Gyroscope, Magnetometer, Proximity Sensor, Others, Software, Software Development Kit, AR Visualization Software, AR Content Management System, Others, Services
  • By Device Type - AR Head-Mounted Displays (HMD), Smart AR Mirror, Handheld Devices
  • By Application - Try-on Solutions, Planning & Designing, Advertising & Marketing, Information Systems
  • By Market Type - Apparel, Furniture & Lighting, Jewelry, Beauty & Cosmetics, Footwear, Groceries, Others
  • By Region - North America, Europe, Asia Pacific, Rest of the World, KEY MARKET PLAYERS, PTC, Alphabet Inc., Microsoft, Apple
Regional scope North America, Europe, Asia-Pacific (APAC), Latin America (LATAM), Middle East & Africa (MEA)
Country scope U.S., Canada, Germany, France, UK, Italy, Spain, China, India, Japan, Brazil, GCC Countries, South Africa
Key companies profiled
  • ed Reality (AR) shopping market is projected to reach USD 11.6 billion by 2028 from USD 3.4 billion in 2023 at a CAGR of 28.0% during the forecast period. Growing adoption of online shopping and e-commerce platforms, rising competition in market driving the need for brand differentiation, growing demand for personalized shopping experience are some of the major factors driving the market growth globally.
  • Driver: Growing demand for personalized shopping experience
  • Augmented reality (AR) is revolutionizing the shopping experience by offering personalized interactions. Unlike traditional online shopping, AR allows us to use our phones or devices to preview products in our own homes before making a purchase. This reduces the chances of disappointment and returns, enabling better decision-making. Retailers from various industries are utilizing AR to enhance personalization. Furniture stores like IKEA provide AR experiences to visualize furniture in our homes. Makeup brands such as NYX Professional Makeup and Sally Hansen offer virtual makeup try-ons. Nike even utilizes AR to measure our feet accurately for the right shoe size. Moreover, AR significantly impacts purchase behavior. Products with AR content have a higher chance of being bought compared to those without AR. When we can digitally interact and virtually try on products, we gain confidence in our purchases and reduce the likelihood of returns. AR creates a sense of being present in the store, making shopping enjoyable and leading to smarter choices.
  • Restraint: High cost of AR technology
  • AR technology requires specialized hardware, such as advanced cameras, sensors, and processors, to deliver immersive and interactive experiences. These hardware components can be expensive, making it challenging for retailers and brands to adopt AR shopping solutions on a large scale. In addition, developing AR applications and content requires specialized skills and expertise, which can also be costly. Businesses need to invest in hiring or training professionals who are proficient in AR development, adding to the overall cost.
  • The implementation costs associated with integrating AR infrastructure into existing e-commerce platforms or developing dedicated AR shopping apps can be a significant barrier. This encompasses the development of backend systems, ongoing maintenance, and continuous updates to ensure a seamless and high-quality AR shopping experience. Additionally, the high cost of AR hardware, such as headsets and smart glasses, presents a challenge for consumer adoption, as the investment required may deter potential users.
  • Opportunity: Lower costs of storage and efficient inventory management
  • The lower cost of storage and efficient inventory management present significant opportunities for the AR shopping industry . Augmented reality technology enables virtual shopping experiences, allowing consumers to explore and interact with virtual products in a realistic way. By integrating AR into the shopping experience, retailers can overcome traditional limitations of physical store space and inventory management.
  • The lower cost of storage becomes an opportunity as AR shopping eliminates the need for retailers to stock large quantities of physical inventory. Instead, retailers can maintain a virtual inventory of products, reducing the costs associated with warehousing, logistics, and physical store space. AR allows customers to virtually try on or test products, browse through virtual shelves, and make purchase decisions without the need for physical stock on hand. This streamlined approach to inventory management lowers costs and increases efficiency for retailers.
  • Challenge: Consumer Acceptance
  • Consumer acceptance poses a significant challenge for the AR shopping market. While augmented reality (AR) technology holds immense potential for enhancing shopping experiences, it relies on consumer adoption and acceptance to achieve widespread success. There are several factors which contribute to the challenge of gaining consumer acceptance.
  • Firstly, AR shopping requires users to embrace and adopt new technology. Not all consumers are familiar with AR or comfortable using it in their shopping routines. There may be a learning curve associated with understanding how to interact with AR interfaces and navigate virtual shopping experiences. This lack of familiarity can create a barrier to entry, hindering the adoption of AR shopping platforms.
  • Augmented Reality (AR) Shopping Market Ecosystem
  • The major players in the Augmented Reality (AR) shopping market with a significant global presence include PTC (US), Alphabet Inc., (US), Microsoft (US), Apple (US), Meta (US). These companies not only boast a comprehensive product portfolio but also have a strong geographic footprint.
  • Information System to register highest CAGR during the forecast period
  • The integration of information systems in AR Shopping apps and devices enhances transparency and empowers customers with relevant and accurate information. For instance, a customer using an AR Shopping app on their smartphone can scan a product's barcode and instantly retrieve detailed information about it, including specifications, pricing, and customer reviews. This allows customers to evaluate the product's features and quality, compare prices, and make well-informed decisions. Additionally, the app can provide real-time data on product availability, allowing customers to check if the item is in stock at nearby stores or online retailers is expected to drive the growth of AR shopping market.
  • AR Smart Mirror to account for the largest share of Augmented Reality (AR) shopping market during the forecast period
  • AR smart mirrors also benefit retailers by streamlining the fitting room process, reducing wait times, and enabling personalized recommendations. Beyond retail, AR smart mirrors have found applications in other industries, such as sports stadiums, where they provide fans with interactive experiences and opportunities to capture memorable moments. The increasing integration of AR technology in smart mirrors demonstrates its potential to revolutionize the way we shop and engage with our surroundings. Renowned brands like Ralph Lauren and H&M have successfully implemented smart mirrors in their stores, providing customers with convenient and customized try-on experiences. These are the major factor driving the growth of AR smart mirrors.
  • Software to account for the largest share of Augmented Reality (AR) shopping market during the forecast period
  • The software segment of augmented reality (AR) encompasses key components essential for AR development, visualization, and management. It includes Software Development Kits (SDKs) that provide developers with tools, libraries, and APIs to access AR functionalities like object tracking and spatial mapping. AR Visualization Software utilizes computer vision techniques and graphics rendering to seamlessly overlay virtual content onto the real-world environment, ensuring immersive experiences. AR Content Management Systems enable the organization, storage, and delivery of AR assets, allowing content creators to manage 3D models, animations, and videos. This comprehensive software ecosystem empowers developers and content creators to build and deploy engaging AR applications across different platforms and devices is expected to drive the growth of AR shopping market.
  • Asia Pacific to register the highest growth during the forecast period
  • Asia Pacific is expected to register the highest CAGR in the Augmented Reality (AR) shopping market from 2023 to 2028. The AR shopping market in Asia Pacific has witnessed numerous new developments and innovations. Companies like YouCam Makeup have pioneered such AR solutions in the region. Prominent retailers across the Asia Pacific region have embraced AR technology to enhance customer engagement and drive sales. For instance, Alibaba's e-commerce platform Taobao utilizes AR to enable virtual try-ons for cosmetic products, while JD.com has implemented AR features to visualize furniture and home decor items in customers' homes. These retailers provide immersive and interactive experiences, enhancing the shopping journey. The growth of the AR market in Asia Pacific can also be attributed to factors such as increasing usage of internet-based platforms, the continued rollout of high-speed 5G networks, and and advancements in technology.
  • Recent Developments
  • In November 2022, Google released new AR shopping features for finding the perfect foundation match and trying on sneakers in AR, providing a realistic and immersive online shopping experience.
  • In March 2021, PTC has launched Vuforia Engine Area Targets, the first offering in the market that supports the creation of immersive AR experiences for spaces up to 300,000 square feet. With the use of Area Targets, industrial organizations can create AR interfaces within their facilities.
  • In March 2021, Seiko Epson announced the enhancement of the AR glasses – Moverio BT-40 and BT – 40S by using Si-OLED technology to expand the field of view with full HD 1080p display resolution, improved connectivity, and comfort.
  • In September 2020, Microsoft partnershiped with Avatar Dimension, and selected it as the exclusive licensee for its volumetric capture technology in the Washington, D.C. area. Microsoft Mixed Reality Capture Studios certified the new studio after a rigorous testing process. The studio captures volumetric digital humans for business and governments, essential for powerful new virtual experiences across all categories.
  • In October 2020, Meta launched Oculus Quest 2, which can run as both a standalone headset with the internal android-based operating system and with Oculus compatible VR software running on desktop computers.
  • In March 2020, Apple released ARKi 3.5, which is an updated version of ARKi. The upgraded version has a new Scene Geometry application program interface (API) that uses the LiDAR scanner to create a 3D map of the space, differentiating between floors, walls, ceilings, windows, doors, and seats.
  • KEY MARKET SEGMENTS
  • By End Use
  • Retail / In-Store
  • E-Commerce / Out of Store
  • By AR Technology
  • Marker-based AR
  • Passive Marker
  • Active Marker
  • Markerless AR
  • Markerless AR, by Technology,
  • Model-based Tracking
  • Image-based Tracking
  • Markerless AR, by Type
  • Projection-based AR
  • Superimposition-based AR
  • Location-based AR
  • By Offering
  • Hardware
  • Displays and Projectors
  • Cameras
  • Sensors
  • Accelerometer
  • Gyroscope
  • Magnetometer
  • Proximity Sensor
  • Others
  • Software
  • Software Development Kit
  • AR Visualization Software
  • AR Content Management System
  • Others
  • Services
  • By Device Type
  • AR Head-Mounted Displays (HMD)
  • Smart AR Mirror
  • Handheld Devices
  • By Application
  • Try-on Solutions
  • Planning & Designing
  • Advertising & Marketing
  • Information Systems
  • By Market Type
  • Apparel
  • Furniture & Lighting
  • Jewelry
  • Beauty & Cosmetics
  • Footwear
  • Groceries
  • Others
  • By Region
  • North America
  • Europe
  • Asia Pacific
  • Rest of the World
  • KEY MARKET PLAYERS
  • PTC
  • Alphabet Inc.
  • Microsoft
  • Apple
  • Meta
Customization scope Free report customization (15% Free customization) with purchase. Addition or alteration to country, regional & segment scope.
Pricing and purchase options Reap the benefits of customized purchase options to fit your specific research requirements.

Objectives of the Study

  • To forecast the market size, in terms of value, for various segments with respect to five main regions, namely, North America, Europe, Asia-Pacific (APAC), Latin America (LATAM), Middle East & Africa (MEA)
  • To provide detailed information regarding the major factors influencing the growth of the Market (drivers, restraints, opportunities, and challenges)
  • To strategically analyze the micro markets with respect to the individual growth trends, future prospects, and contribution to the total market
  • To provide a detailed overview of the value chain and analyze market trends with the Porter's five forces analysis
  • To analyze the opportunities in the market for various stakeholders by identifying the high-growth Segments
  • To identify the key players and comprehensively analyze their market position in terms of ranking and core competencies, along with detailing the competitive landscape for the market leaders
  • To analyze competitive development such as joint ventures, mergers and acquisitions, new product launches and development, and research and development in the market

What does this Report Deliver?

  • Market Estimation for 20+ Countries
  • Historical data coverage: 2016 to 2022
  • Growth projections: 2022 to 2028
  • SkyQuest's premium market insights: Innovation matrix, IP analysis, Production Analysis, Value chain analysis, Technological trends, and Trade analysis
  • Customization on Segments, Regions, and Company Profiles
  • 100+ tables, 150+ Figures, 10+ matrix
  • Global and Country Market Trends
  • Comprehensive Mapping of Industry Parameters
  • Attractive Investment Proposition
  • Competitive Strategies Adopted by Leading Market Participants
  • Market drivers, restraints, opportunities, and its impact on the market
  • Regulatory scenario, regional dynamics, and insights of leading countries in each region
  • Segment trends analysis, opportunity, and growth
  • Opportunity analysis by region and country
  • Porter's five force analysis to know the market's condition
  • Pricing analysis
  • Parent market analysis
  • Product portfolio benchmarking

Table Of Content

Executive Summary

Market overview

  • Exhibit: Executive Summary – Chart on Market Overview
  • Exhibit: Executive Summary – Data Table on Market Overview
  • Exhibit: Executive Summary – Chart on Augmented Reality (AR) Shopping Market Characteristics
  • Exhibit: Executive Summary – Chart on Market by Geography
  • Exhibit: Executive Summary – Chart on Market Segmentation
  • Exhibit: Executive Summary – Chart on Incremental Growth
  • Exhibit: Executive Summary – Data Table on Incremental Growth
  • Exhibit: Executive Summary – Chart on Vendor Market Positioning

Parent Market Analysis

Market overview

Market size

  • Market Dynamics
    • Exhibit: Impact analysis of DROC, 2021
      • Drivers
      • Opportunities
      • Restraints
      • Challenges
  • SWOT Analysis

KEY MARKET INSIGHTS

  • Technology Analysis
    • (Exhibit: Data Table: Name of technology and details)
  • Pricing Analysis
    • (Exhibit: Data Table: Name of technology and pricing details)
  • Supply Chain Analysis
    • (Exhibit: Detailed Supply Chain Presentation)
  • Value Chain Analysis
    • (Exhibit: Detailed Value Chain Presentation)
  • Ecosystem Of the Market
    • Exhibit: Parent Market Ecosystem Market Analysis
    • Exhibit: Market Characteristics of Parent Market
  • IP Analysis
    • (Exhibit: Data Table: Name of product/technology, patents filed, inventor/company name, acquiring firm)
  • Trade Analysis
    • (Exhibit: Data Table: Import and Export data details)
  • Startup Analysis
    • (Exhibit: Data Table: Emerging startups details)
  • Raw Material Analysis
    • (Exhibit: Data Table: Mapping of key raw materials)
  • Innovation Matrix
    • (Exhibit: Positioning Matrix: Mapping of new and existing technologies)
  • Pipeline product Analysis
    • (Exhibit: Data Table: Name of companies and pipeline products, regional mapping)
  • Macroeconomic Indicators

COVID IMPACT

  • Introduction
  • Impact On Economy—scenario Assessment
    • Exhibit: Data on GDP - Year-over-year growth 2016-2022 (%)
  • Revised Market Size
    • Exhibit: Data Table on Augmented Reality (AR) Shopping Market size and forecast 2021-2027 ($ million)
  • Impact Of COVID On Key Segments
    • Exhibit: Data Table on Segment Market size and forecast 2021-2027 ($ million)
  • COVID Strategies By Company
    • Exhibit: Analysis on key strategies adopted by companies

MARKET DYNAMICS & OUTLOOK

  • Market Dynamics
    • Exhibit: Impact analysis of DROC, 2021
      • Drivers
      • Opportunities
      • Restraints
      • Challenges
  • Regulatory Landscape
    • Exhibit: Data Table on regulation from different region
  • SWOT Analysis
  • Porters Analysis
    • Competitive rivalry
      • Exhibit: Competitive rivalry Impact of key factors, 2021
    • Threat of substitute products
      • Exhibit: Threat of Substitute Products Impact of key factors, 2021
    • Bargaining power of buyers
      • Exhibit: buyers bargaining power Impact of key factors, 2021
    • Threat of new entrants
      • Exhibit: Threat of new entrants Impact of key factors, 2021
    • Bargaining power of suppliers
      • Exhibit: Threat of suppliers bargaining power Impact of key factors, 2021
  • Skyquest special insights on future disruptions
    • Political Impact
    • Economic impact
    • Social Impact
    • Technical Impact
    • Environmental Impact
    • Legal Impact

Market Size by Region

  • Chart on Market share by geography 2021-2027 (%)
  • Data Table on Market share by geography 2021-2027(%)
  • North America
    • Chart on Market share by country 2021-2027 (%)
    • Data Table on Market share by country 2021-2027(%)
    • USA
      • Exhibit: Chart on Market share 2021-2027 (%)
      • Exhibit: Market size and forecast 2021-2027 ($ million)
    • Canada
      • Exhibit: Chart on Market share 2021-2027 (%)
      • Exhibit: Market size and forecast 2021-2027 ($ million)
  • Europe
    • Chart on Market share by country 2021-2027 (%)
    • Data Table on Market share by country 2021-2027(%)
    • Germany
      • Exhibit: Chart on Market share 2021-2027 (%)
      • Exhibit: Market size and forecast 2021-2027 ($ million)
    • Spain
      • Exhibit: Chart on Market share 2021-2027 (%)
      • Exhibit: Market size and forecast 2021-2027 ($ million)
    • France
      • Exhibit: Chart on Market share 2021-2027 (%)
      • Exhibit: Market size and forecast 2021-2027 ($ million)
    • UK
      • Exhibit: Chart on Market share 2021-2027 (%)
      • Exhibit: Market size and forecast 2021-2027 ($ million)
    • Rest of Europe
      • Exhibit: Chart on Market share 2021-2027 (%)
      • Exhibit: Market size and forecast 2021-2027 ($ million)
  • Asia Pacific
    • Chart on Market share by country 2021-2027 (%)
    • Data Table on Market share by country 2021-2027(%)
    • China
      • Exhibit: Chart on Market share 2021-2027 (%)
      • Exhibit: Market size and forecast 2021-2027 ($ million)
    • India
      • Exhibit: Chart on Market share 2021-2027 (%)
      • Exhibit: Market size and forecast 2021-2027 ($ million)
    • Japan
      • Exhibit: Chart on Market share 2021-2027 (%)
      • Exhibit: Market size and forecast 2021-2027 ($ million)
    • South Korea
      • Exhibit: Chart on Market share 2021-2027 (%)
      • Exhibit: Market size and forecast 2021-2027 ($ million)
    • Rest of Asia Pacific
      • Exhibit: Chart on Market share 2021-2027 (%)
      • Exhibit: Market size and forecast 2021-2027 ($ million)
  • Latin America
    • Chart on Market share by country 2021-2027 (%)
    • Data Table on Market share by country 2021-2027(%)
    • Brazil
      • Exhibit: Chart on Market share 2021-2027 (%)
      • Exhibit: Market size and forecast 2021-2027 ($ million)
    • Rest of South America
      • Exhibit: Chart on Market share 2021-2027 (%)
      • Exhibit: Market size and forecast 2021-2027 ($ million)
  • Middle East & Africa (MEA)
    • Chart on Market share by country 2021-2027 (%)
    • Data Table on Market share by country 2021-2027(%)
    • GCC Countries
      • Exhibit: Chart on Market share 2021-2027 (%)
      • Exhibit: Market size and forecast 2021-2027 ($ million)
    • South Africa
      • Exhibit: Chart on Market share 2021-2027 (%)
      • Exhibit: Market size and forecast 2021-2027 ($ million)
    • Rest of MEA
      • Exhibit: Chart on Market share 2021-2027 (%)
      • Exhibit: Market size and forecast 2021-2027 ($ million)

KEY COMPANY PROFILES

  • Competitive Landscape
    • Total number of companies covered
      • Exhibit: companies covered in the report, 2021
    • Top companies market positioning
      • Exhibit: company positioning matrix, 2021
    • Top companies market Share
      • Exhibit: Pie chart analysis on company market share, 2021(%)
  • ed Reality (AR) shopping market is projected to reach USD 11.6 billion by 2028 from USD 3.4 billion in 2023 at a CAGR of 28.0% during the forecast period. Growing adoption of online shopping and e-commerce platforms, rising competition in market driving the need for brand differentiation, growing demand for personalized shopping experience are some of the major factors driving the market growth globally.
    • Exhibit Company Overview
    • Exhibit Business Segment Overview
    • Exhibit Financial Updates
    • Exhibit Key Developments
  • Driver: Growing demand for personalized shopping experience
    • Exhibit Company Overview
    • Exhibit Business Segment Overview
    • Exhibit Financial Updates
    • Exhibit Key Developments
  • Augmented reality (AR) is revolutionizing the shopping experience by offering personalized interactions. Unlike traditional online shopping, AR allows us to use our phones or devices to preview products in our own homes before making a purchase. This reduces the chances of disappointment and returns, enabling better decision-making. Retailers from various industries are utilizing AR to enhance personalization. Furniture stores like IKEA provide AR experiences to visualize furniture in our homes. Makeup brands such as NYX Professional Makeup and Sally Hansen offer virtual makeup try-ons. Nike even utilizes AR to measure our feet accurately for the right shoe size. Moreover, AR significantly impacts purchase behavior. Products with AR content have a higher chance of being bought compared to those without AR. When we can digitally interact and virtually try on products, we gain confidence in our purchases and reduce the likelihood of returns. AR creates a sense of being present in the store, making shopping enjoyable and leading to smarter choices.
    • Exhibit Company Overview
    • Exhibit Business Segment Overview
    • Exhibit Financial Updates
    • Exhibit Key Developments
  • Restraint: High cost of AR technology
    • Exhibit Company Overview
    • Exhibit Business Segment Overview
    • Exhibit Financial Updates
    • Exhibit Key Developments
  • AR technology requires specialized hardware, such as advanced cameras, sensors, and processors, to deliver immersive and interactive experiences. These hardware components can be expensive, making it challenging for retailers and brands to adopt AR shopping solutions on a large scale. In addition, developing AR applications and content requires specialized skills and expertise, which can also be costly. Businesses need to invest in hiring or training professionals who are proficient in AR development, adding to the overall cost.
    • Exhibit Company Overview
    • Exhibit Business Segment Overview
    • Exhibit Financial Updates
    • Exhibit Key Developments
  • The implementation costs associated with integrating AR infrastructure into existing e-commerce platforms or developing dedicated AR shopping apps can be a significant barrier. This encompasses the development of backend systems, ongoing maintenance, and continuous updates to ensure a seamless and high-quality AR shopping experience. Additionally, the high cost of AR hardware, such as headsets and smart glasses, presents a challenge for consumer adoption, as the investment required may deter potential users.
    • Exhibit Company Overview
    • Exhibit Business Segment Overview
    • Exhibit Financial Updates
    • Exhibit Key Developments
  • Opportunity: Lower costs of storage and efficient inventory management
    • Exhibit Company Overview
    • Exhibit Business Segment Overview
    • Exhibit Financial Updates
    • Exhibit Key Developments
  • The lower cost of storage and efficient inventory management present significant opportunities for the AR shopping industry . Augmented reality technology enables virtual shopping experiences, allowing consumers to explore and interact with virtual products in a realistic way. By integrating AR into the shopping experience, retailers can overcome traditional limitations of physical store space and inventory management.
    • Exhibit Company Overview
    • Exhibit Business Segment Overview
    • Exhibit Financial Updates
    • Exhibit Key Developments
  • The lower cost of storage becomes an opportunity as AR shopping eliminates the need for retailers to stock large quantities of physical inventory. Instead, retailers can maintain a virtual inventory of products, reducing the costs associated with warehousing, logistics, and physical store space. AR allows customers to virtually try on or test products, browse through virtual shelves, and make purchase decisions without the need for physical stock on hand. This streamlined approach to inventory management lowers costs and increases efficiency for retailers.
    • Exhibit Company Overview
    • Exhibit Business Segment Overview
    • Exhibit Financial Updates
    • Exhibit Key Developments
  • Challenge: Consumer Acceptance
    • Exhibit Company Overview
    • Exhibit Business Segment Overview
    • Exhibit Financial Updates
    • Exhibit Key Developments
  • Consumer acceptance poses a significant challenge for the AR shopping market. While augmented reality (AR) technology holds immense potential for enhancing shopping experiences, it relies on consumer adoption and acceptance to achieve widespread success. There are several factors which contribute to the challenge of gaining consumer acceptance.
    • Exhibit Company Overview
    • Exhibit Business Segment Overview
    • Exhibit Financial Updates
    • Exhibit Key Developments
  • Firstly, AR shopping requires users to embrace and adopt new technology. Not all consumers are familiar with AR or comfortable using it in their shopping routines. There may be a learning curve associated with understanding how to interact with AR interfaces and navigate virtual shopping experiences. This lack of familiarity can create a barrier to entry, hindering the adoption of AR shopping platforms.
    • Exhibit Company Overview
    • Exhibit Business Segment Overview
    • Exhibit Financial Updates
    • Exhibit Key Developments
  • Augmented Reality (AR) Shopping Market Ecosystem
    • Exhibit Company Overview
    • Exhibit Business Segment Overview
    • Exhibit Financial Updates
    • Exhibit Key Developments
  • The major players in the Augmented Reality (AR) shopping market with a significant global presence include PTC (US), Alphabet Inc., (US), Microsoft (US), Apple (US), Meta (US). These companies not only boast a comprehensive product portfolio but also have a strong geographic footprint.
    • Exhibit Company Overview
    • Exhibit Business Segment Overview
    • Exhibit Financial Updates
    • Exhibit Key Developments
  • Information System to register highest CAGR during the forecast period
    • Exhibit Company Overview
    • Exhibit Business Segment Overview
    • Exhibit Financial Updates
    • Exhibit Key Developments
  • The integration of information systems in AR Shopping apps and devices enhances transparency and empowers customers with relevant and accurate information. For instance, a customer using an AR Shopping app on their smartphone can scan a product's barcode and instantly retrieve detailed information about it, including specifications, pricing, and customer reviews. This allows customers to evaluate the product's features and quality, compare prices, and make well-informed decisions. Additionally, the app can provide real-time data on product availability, allowing customers to check if the item is in stock at nearby stores or online retailers is expected to drive the growth of AR shopping market.
    • Exhibit Company Overview
    • Exhibit Business Segment Overview
    • Exhibit Financial Updates
    • Exhibit Key Developments
  • AR Smart Mirror to account for the largest share of Augmented Reality (AR) shopping market during the forecast period
    • Exhibit Company Overview
    • Exhibit Business Segment Overview
    • Exhibit Financial Updates
    • Exhibit Key Developments
  • AR smart mirrors also benefit retailers by streamlining the fitting room process, reducing wait times, and enabling personalized recommendations. Beyond retail, AR smart mirrors have found applications in other industries, such as sports stadiums, where they provide fans with interactive experiences and opportunities to capture memorable moments. The increasing integration of AR technology in smart mirrors demonstrates its potential to revolutionize the way we shop and engage with our surroundings. Renowned brands like Ralph Lauren and H&M have successfully implemented smart mirrors in their stores, providing customers with convenient and customized try-on experiences. These are the major factor driving the growth of AR smart mirrors.
    • Exhibit Company Overview
    • Exhibit Business Segment Overview
    • Exhibit Financial Updates
    • Exhibit Key Developments
  • Software to account for the largest share of Augmented Reality (AR) shopping market during the forecast period
    • Exhibit Company Overview
    • Exhibit Business Segment Overview
    • Exhibit Financial Updates
    • Exhibit Key Developments
  • The software segment of augmented reality (AR) encompasses key components essential for AR development, visualization, and management. It includes Software Development Kits (SDKs) that provide developers with tools, libraries, and APIs to access AR functionalities like object tracking and spatial mapping. AR Visualization Software utilizes computer vision techniques and graphics rendering to seamlessly overlay virtual content onto the real-world environment, ensuring immersive experiences. AR Content Management Systems enable the organization, storage, and delivery of AR assets, allowing content creators to manage 3D models, animations, and videos. This comprehensive software ecosystem empowers developers and content creators to build and deploy engaging AR applications across different platforms and devices is expected to drive the growth of AR shopping market.
    • Exhibit Company Overview
    • Exhibit Business Segment Overview
    • Exhibit Financial Updates
    • Exhibit Key Developments
  • Asia Pacific to register the highest growth during the forecast period
    • Exhibit Company Overview
    • Exhibit Business Segment Overview
    • Exhibit Financial Updates
    • Exhibit Key Developments
  • Asia Pacific is expected to register the highest CAGR in the Augmented Reality (AR) shopping market from 2023 to 2028. The AR shopping market in Asia Pacific has witnessed numerous new developments and innovations. Companies like YouCam Makeup have pioneered such AR solutions in the region. Prominent retailers across the Asia Pacific region have embraced AR technology to enhance customer engagement and drive sales. For instance, Alibaba's e-commerce platform Taobao utilizes AR to enable virtual try-ons for cosmetic products, while JD.com has implemented AR features to visualize furniture and home decor items in customers' homes. These retailers provide immersive and interactive experiences, enhancing the shopping journey. The growth of the AR market in Asia Pacific can also be attributed to factors such as increasing usage of internet-based platforms, the continued rollout of high-speed 5G networks, and and advancements in technology.
    • Exhibit Company Overview
    • Exhibit Business Segment Overview
    • Exhibit Financial Updates
    • Exhibit Key Developments
  • Recent Developments
    • Exhibit Company Overview
    • Exhibit Business Segment Overview
    • Exhibit Financial Updates
    • Exhibit Key Developments
  • In November 2022, Google released new AR shopping features for finding the perfect foundation match and trying on sneakers in AR, providing a realistic and immersive online shopping experience.
    • Exhibit Company Overview
    • Exhibit Business Segment Overview
    • Exhibit Financial Updates
    • Exhibit Key Developments
  • In March 2021, PTC has launched Vuforia Engine Area Targets, the first offering in the market that supports the creation of immersive AR experiences for spaces up to 300,000 square feet. With the use of Area Targets, industrial organizations can create AR interfaces within their facilities.
    • Exhibit Company Overview
    • Exhibit Business Segment Overview
    • Exhibit Financial Updates
    • Exhibit Key Developments
  • In March 2021, Seiko Epson announced the enhancement of the AR glasses – Moverio BT-40 and BT – 40S by using Si-OLED technology to expand the field of view with full HD 1080p display resolution, improved connectivity, and comfort.
    • Exhibit Company Overview
    • Exhibit Business Segment Overview
    • Exhibit Financial Updates
    • Exhibit Key Developments
  • In September 2020, Microsoft partnershiped with Avatar Dimension, and selected it as the exclusive licensee for its volumetric capture technology in the Washington, D.C. area. Microsoft Mixed Reality Capture Studios certified the new studio after a rigorous testing process. The studio captures volumetric digital humans for business and governments, essential for powerful new virtual experiences across all categories.
    • Exhibit Company Overview
    • Exhibit Business Segment Overview
    • Exhibit Financial Updates
    • Exhibit Key Developments
  • In October 2020, Meta launched Oculus Quest 2, which can run as both a standalone headset with the internal android-based operating system and with Oculus compatible VR software running on desktop computers.
    • Exhibit Company Overview
    • Exhibit Business Segment Overview
    • Exhibit Financial Updates
    • Exhibit Key Developments
  • In March 2020, Apple released ARKi 3.5, which is an updated version of ARKi. The upgraded version has a new Scene Geometry application program interface (API) that uses the LiDAR scanner to create a 3D map of the space, differentiating between floors, walls, ceilings, windows, doors, and seats.
    • Exhibit Company Overview
    • Exhibit Business Segment Overview
    • Exhibit Financial Updates
    • Exhibit Key Developments
  • KEY MARKET SEGMENTS
    • Exhibit Company Overview
    • Exhibit Business Segment Overview
    • Exhibit Financial Updates
    • Exhibit Key Developments
  • By End Use
    • Exhibit Company Overview
    • Exhibit Business Segment Overview
    • Exhibit Financial Updates
    • Exhibit Key Developments
  • Retail / In-Store
    • Exhibit Company Overview
    • Exhibit Business Segment Overview
    • Exhibit Financial Updates
    • Exhibit Key Developments
  • E-Commerce / Out of Store
    • Exhibit Company Overview
    • Exhibit Business Segment Overview
    • Exhibit Financial Updates
    • Exhibit Key Developments
  • By AR Technology
    • Exhibit Company Overview
    • Exhibit Business Segment Overview
    • Exhibit Financial Updates
    • Exhibit Key Developments
  • Marker-based AR
    • Exhibit Company Overview
    • Exhibit Business Segment Overview
    • Exhibit Financial Updates
    • Exhibit Key Developments
  • Passive Marker
    • Exhibit Company Overview
    • Exhibit Business Segment Overview
    • Exhibit Financial Updates
    • Exhibit Key Developments
  • Active Marker
    • Exhibit Company Overview
    • Exhibit Business Segment Overview
    • Exhibit Financial Updates
    • Exhibit Key Developments
  • Markerless AR
    • Exhibit Company Overview
    • Exhibit Business Segment Overview
    • Exhibit Financial Updates
    • Exhibit Key Developments
  • Markerless AR, by Technology,
    • Exhibit Company Overview
    • Exhibit Business Segment Overview
    • Exhibit Financial Updates
    • Exhibit Key Developments
  • Model-based Tracking
    • Exhibit Company Overview
    • Exhibit Business Segment Overview
    • Exhibit Financial Updates
    • Exhibit Key Developments
  • Image-based Tracking
    • Exhibit Company Overview
    • Exhibit Business Segment Overview
    • Exhibit Financial Updates
    • Exhibit Key Developments
  • Markerless AR, by Type
    • Exhibit Company Overview
    • Exhibit Business Segment Overview
    • Exhibit Financial Updates
    • Exhibit Key Developments
  • Projection-based AR
    • Exhibit Company Overview
    • Exhibit Business Segment Overview
    • Exhibit Financial Updates
    • Exhibit Key Developments
  • Superimposition-based AR
    • Exhibit Company Overview
    • Exhibit Business Segment Overview
    • Exhibit Financial Updates
    • Exhibit Key Developments
  • Location-based AR
    • Exhibit Company Overview
    • Exhibit Business Segment Overview
    • Exhibit Financial Updates
    • Exhibit Key Developments
  • By Offering
    • Exhibit Company Overview
    • Exhibit Business Segment Overview
    • Exhibit Financial Updates
    • Exhibit Key Developments
  • Hardware
    • Exhibit Company Overview
    • Exhibit Business Segment Overview
    • Exhibit Financial Updates
    • Exhibit Key Developments
  • Displays and Projectors
    • Exhibit Company Overview
    • Exhibit Business Segment Overview
    • Exhibit Financial Updates
    • Exhibit Key Developments
  • Cameras
    • Exhibit Company Overview
    • Exhibit Business Segment Overview
    • Exhibit Financial Updates
    • Exhibit Key Developments
  • Sensors
    • Exhibit Company Overview
    • Exhibit Business Segment Overview
    • Exhibit Financial Updates
    • Exhibit Key Developments
  • Accelerometer
    • Exhibit Company Overview
    • Exhibit Business Segment Overview
    • Exhibit Financial Updates
    • Exhibit Key Developments
  • Gyroscope
    • Exhibit Company Overview
    • Exhibit Business Segment Overview
    • Exhibit Financial Updates
    • Exhibit Key Developments
  • Magnetometer
    • Exhibit Company Overview
    • Exhibit Business Segment Overview
    • Exhibit Financial Updates
    • Exhibit Key Developments
  • Proximity Sensor
    • Exhibit Company Overview
    • Exhibit Business Segment Overview
    • Exhibit Financial Updates
    • Exhibit Key Developments
  • Others
    • Exhibit Company Overview
    • Exhibit Business Segment Overview
    • Exhibit Financial Updates
    • Exhibit Key Developments
  • Software
    • Exhibit Company Overview
    • Exhibit Business Segment Overview
    • Exhibit Financial Updates
    • Exhibit Key Developments
  • Software Development Kit
    • Exhibit Company Overview
    • Exhibit Business Segment Overview
    • Exhibit Financial Updates
    • Exhibit Key Developments
  • AR Visualization Software
    • Exhibit Company Overview
    • Exhibit Business Segment Overview
    • Exhibit Financial Updates
    • Exhibit Key Developments
  • AR Content Management System
    • Exhibit Company Overview
    • Exhibit Business Segment Overview
    • Exhibit Financial Updates
    • Exhibit Key Developments
  • Others
    • Exhibit Company Overview
    • Exhibit Business Segment Overview
    • Exhibit Financial Updates
    • Exhibit Key Developments
  • Services
    • Exhibit Company Overview
    • Exhibit Business Segment Overview
    • Exhibit Financial Updates
    • Exhibit Key Developments
  • By Device Type
    • Exhibit Company Overview
    • Exhibit Business Segment Overview
    • Exhibit Financial Updates
    • Exhibit Key Developments
  • AR Head-Mounted Displays (HMD)
    • Exhibit Company Overview
    • Exhibit Business Segment Overview
    • Exhibit Financial Updates
    • Exhibit Key Developments
  • Smart AR Mirror
    • Exhibit Company Overview
    • Exhibit Business Segment Overview
    • Exhibit Financial Updates
    • Exhibit Key Developments
  • Handheld Devices
    • Exhibit Company Overview
    • Exhibit Business Segment Overview
    • Exhibit Financial Updates
    • Exhibit Key Developments
  • By Application
    • Exhibit Company Overview
    • Exhibit Business Segment Overview
    • Exhibit Financial Updates
    • Exhibit Key Developments
  • Try-on Solutions
    • Exhibit Company Overview
    • Exhibit Business Segment Overview
    • Exhibit Financial Updates
    • Exhibit Key Developments
  • Planning & Designing
    • Exhibit Company Overview
    • Exhibit Business Segment Overview
    • Exhibit Financial Updates
    • Exhibit Key Developments
  • Advertising & Marketing
    • Exhibit Company Overview
    • Exhibit Business Segment Overview
    • Exhibit Financial Updates
    • Exhibit Key Developments
  • Information Systems
    • Exhibit Company Overview
    • Exhibit Business Segment Overview
    • Exhibit Financial Updates
    • Exhibit Key Developments
  • By Market Type
    • Exhibit Company Overview
    • Exhibit Business Segment Overview
    • Exhibit Financial Updates
    • Exhibit Key Developments
  • Apparel
    • Exhibit Company Overview
    • Exhibit Business Segment Overview
    • Exhibit Financial Updates
    • Exhibit Key Developments
  • Furniture & Lighting
    • Exhibit Company Overview
    • Exhibit Business Segment Overview
    • Exhibit Financial Updates
    • Exhibit Key Developments
  • Jewelry
    • Exhibit Company Overview
    • Exhibit Business Segment Overview
    • Exhibit Financial Updates
    • Exhibit Key Developments
  • Beauty & Cosmetics
    • Exhibit Company Overview
    • Exhibit Business Segment Overview
    • Exhibit Financial Updates
    • Exhibit Key Developments
  • Footwear
    • Exhibit Company Overview
    • Exhibit Business Segment Overview
    • Exhibit Financial Updates
    • Exhibit Key Developments
  • Groceries
    • Exhibit Company Overview
    • Exhibit Business Segment Overview
    • Exhibit Financial Updates
    • Exhibit Key Developments
  • Others
    • Exhibit Company Overview
    • Exhibit Business Segment Overview
    • Exhibit Financial Updates
    • Exhibit Key Developments
  • By Region
    • Exhibit Company Overview
    • Exhibit Business Segment Overview
    • Exhibit Financial Updates
    • Exhibit Key Developments
  • North America
    • Exhibit Company Overview
    • Exhibit Business Segment Overview
    • Exhibit Financial Updates
    • Exhibit Key Developments
  • Europe
    • Exhibit Company Overview
    • Exhibit Business Segment Overview
    • Exhibit Financial Updates
    • Exhibit Key Developments
  • Asia Pacific
    • Exhibit Company Overview
    • Exhibit Business Segment Overview
    • Exhibit Financial Updates
    • Exhibit Key Developments
  • Rest of the World
    • Exhibit Company Overview
    • Exhibit Business Segment Overview
    • Exhibit Financial Updates
    • Exhibit Key Developments
  • KEY MARKET PLAYERS
    • Exhibit Company Overview
    • Exhibit Business Segment Overview
    • Exhibit Financial Updates
    • Exhibit Key Developments
  • PTC
    • Exhibit Company Overview
    • Exhibit Business Segment Overview
    • Exhibit Financial Updates
    • Exhibit Key Developments
  • Alphabet Inc.
    • Exhibit Company Overview
    • Exhibit Business Segment Overview
    • Exhibit Financial Updates
    • Exhibit Key Developments
  • Microsoft
    • Exhibit Company Overview
    • Exhibit Business Segment Overview
    • Exhibit Financial Updates
    • Exhibit Key Developments
  • Apple
    • Exhibit Company Overview
    • Exhibit Business Segment Overview
    • Exhibit Financial Updates
    • Exhibit Key Developments
  • Meta
    • Exhibit Company Overview
    • Exhibit Business Segment Overview
    • Exhibit Financial Updates
    • Exhibit Key Developments

Methodology

For the Augmented Reality (AR) Shopping Market, our research methodology involved a mixture of primary and secondary data sources. Key steps involved in the research process are listed below:

1. Information Procurement: This stage involved the procurement of Market data or related information via primary and secondary sources. The various secondary sources used included various company websites, annual reports, trade databases, and paid databases such as Hoover's, Bloomberg Business, Factiva, and Avention. Our team did 45 primary interactions Globally which included several stakeholders such as manufacturers, customers, key opinion leaders, etc. Overall, information procurement was one of the most extensive stages in our research process.

2. Information Analysis: This step involved triangulation of data through bottom-up and top-down approaches to estimate and validate the total size and future estimate of the Augmented Reality (AR) Shopping Market.

3. Report Formulation: The final step entailed the placement of data points in appropriate Market spaces in an attempt to deduce viable conclusions.

4. Validation & Publishing: Validation is the most important step in the process. Validation & re-validation via an intricately designed process helped us finalize data points to be used for final calculations. The final Market estimates and forecasts were then aligned and sent to our panel of industry experts for validation of data. Once the validation was done the report was sent to our Quality Assurance team to ensure adherence to style guides, consistency & design.

Analyst Support

Customization Options

With the given market data, our dedicated team of analysts can offer you the following customization options are available for the Augmented Reality (AR) Shopping Market:

Product Analysis: Product matrix, which offers a detailed comparison of the product portfolio of companies.

Regional Analysis: Further analysis of the Augmented Reality (AR) Shopping Market for additional countries.

Competitive Analysis: Detailed analysis and profiling of additional Market players & comparative analysis of competitive products.

Go to Market Strategy: Find the high-growth channels to invest your marketing efforts and increase your customer base.

Innovation Mapping: Identify racial solutions and innovation, connected to deep ecosystems of innovators, start-ups, academics, and strategic partners.

Category Intelligence: Customized intelligence that is relevant to their supply Markets will enable them to make smarter sourcing decisions and improve their category management.

Public Company Transcript Analysis: To improve the investment performance by generating new alpha and making better-informed decisions.

Social Media Listening: To analyze the conversations and trends happening not just around your brand, but around your industry as a whole, and use those insights to make better Marketing decisions.

$5,300
BUY NOW GET FREE SAMPLE
Want to customize this report?

Our industry expert will work with you to provide you with customized data in a short amount of time.

REQUEST FREE CUSTOMIZATION

FAQs

The global market for Augmented Reality (AR) Shopping was estimated to be valued at US$ XX Mn in 2021.

The global Augmented Reality (AR) Shopping Market is estimated to grow at a CAGR of XX% by 2028.

The global Augmented Reality (AR) Shopping Market is segmented on the basis of End Use, AR Technology, Offering, Device Type, Application, Market Type, Region.

Based on region, the global Augmented Reality (AR) Shopping Market is segmented into North America, Europe, Asia Pacific, Middle East & Africa and Latin America.

The key players operating in the global Augmented Reality (AR) Shopping Market are ed Reality (AR) shopping market is projected to reach USD 11.6 billion by 2028 from USD 3.4 billion in 2023 at a CAGR of 28.0% during the forecast period. Growing adoption of online shopping and e-commerce platforms, rising competition in market driving the need for brand differentiation, growing demand for personalized shopping experience are some of the major factors driving the market growth globally. , Driver: Growing demand for personalized shopping experience , Augmented reality (AR) is revolutionizing the shopping experience by offering personalized interactions. Unlike traditional online shopping, AR allows us to use our phones or devices to preview products in our own homes before making a purchase. This reduces the chances of disappointment and returns, enabling better decision-making. Retailers from various industries are utilizing AR to enhance personalization. Furniture stores like IKEA provide AR experiences to visualize furniture in our homes. Makeup brands such as NYX Professional Makeup and Sally Hansen offer virtual makeup try-ons. Nike even utilizes AR to measure our feet accurately for the right shoe size. Moreover, AR significantly impacts purchase behavior. Products with AR content have a higher chance of being bought compared to those without AR. When we can digitally interact and virtually try on products, we gain confidence in our purchases and reduce the likelihood of returns. AR creates a sense of being present in the store, making shopping enjoyable and leading to smarter choices. , Restraint: High cost of AR technology , AR technology requires specialized hardware, such as advanced cameras, sensors, and processors, to deliver immersive and interactive experiences. These hardware components can be expensive, making it challenging for retailers and brands to adopt AR shopping solutions on a large scale. In addition, developing AR applications and content requires specialized skills and expertise, which can also be costly. Businesses need to invest in hiring or training professionals who are proficient in AR development, adding to the overall cost. , The implementation costs associated with integrating AR infrastructure into existing e-commerce platforms or developing dedicated AR shopping apps can be a significant barrier. This encompasses the development of backend systems, ongoing maintenance, and continuous updates to ensure a seamless and high-quality AR shopping experience. Additionally, the high cost of AR hardware, such as headsets and smart glasses, presents a challenge for consumer adoption, as the investment required may deter potential users. , Opportunity: Lower costs of storage and efficient inventory management , The lower cost of storage and efficient inventory management present significant opportunities for the AR shopping industry . Augmented reality technology enables virtual shopping experiences, allowing consumers to explore and interact with virtual products in a realistic way. By integrating AR into the shopping experience, retailers can overcome traditional limitations of physical store space and inventory management. , The lower cost of storage becomes an opportunity as AR shopping eliminates the need for retailers to stock large quantities of physical inventory. Instead, retailers can maintain a virtual inventory of products, reducing the costs associated with warehousing, logistics, and physical store space. AR allows customers to virtually try on or test products, browse through virtual shelves, and make purchase decisions without the need for physical stock on hand. This streamlined approach to inventory management lowers costs and increases efficiency for retailers. , Challenge: Consumer Acceptance , Consumer acceptance poses a significant challenge for the AR shopping market. While augmented reality (AR) technology holds immense potential for enhancing shopping experiences, it relies on consumer adoption and acceptance to achieve widespread success. There are several factors which contribute to the challenge of gaining consumer acceptance. , Firstly, AR shopping requires users to embrace and adopt new technology. Not all consumers are familiar with AR or comfortable using it in their shopping routines. There may be a learning curve associated with understanding how to interact with AR interfaces and navigate virtual shopping experiences. This lack of familiarity can create a barrier to entry, hindering the adoption of AR shopping platforms. , Augmented Reality (AR) Shopping Market Ecosystem , The major players in the Augmented Reality (AR) shopping market with a significant global presence include PTC (US), Alphabet Inc., (US), Microsoft (US), Apple (US), Meta (US). These companies not only boast a comprehensive product portfolio but also have a strong geographic footprint. , Information System to register highest CAGR during the forecast period , The integration of information systems in AR Shopping apps and devices enhances transparency and empowers customers with relevant and accurate information. For instance, a customer using an AR Shopping app on their smartphone can scan a product's barcode and instantly retrieve detailed information about it, including specifications, pricing, and customer reviews. This allows customers to evaluate the product's features and quality, compare prices, and make well-informed decisions. Additionally, the app can provide real-time data on product availability, allowing customers to check if the item is in stock at nearby stores or online retailers is expected to drive the growth of AR shopping market. , AR Smart Mirror to account for the largest share of Augmented Reality (AR) shopping market during the forecast period , AR smart mirrors also benefit retailers by streamlining the fitting room process, reducing wait times, and enabling personalized recommendations. Beyond retail, AR smart mirrors have found applications in other industries, such as sports stadiums, where they provide fans with interactive experiences and opportunities to capture memorable moments. The increasing integration of AR technology in smart mirrors demonstrates its potential to revolutionize the way we shop and engage with our surroundings. Renowned brands like Ralph Lauren and H&M have successfully implemented smart mirrors in their stores, providing customers with convenient and customized try-on experiences. These are the major factor driving the growth of AR smart mirrors. , Software to account for the largest share of Augmented Reality (AR) shopping market during the forecast period , The software segment of augmented reality (AR) encompasses key components essential for AR development, visualization, and management. It includes Software Development Kits (SDKs) that provide developers with tools, libraries, and APIs to access AR functionalities like object tracking and spatial mapping. AR Visualization Software utilizes computer vision techniques and graphics rendering to seamlessly overlay virtual content onto the real-world environment, ensuring immersive experiences. AR Content Management Systems enable the organization, storage, and delivery of AR assets, allowing content creators to manage 3D models, animations, and videos. This comprehensive software ecosystem empowers developers and content creators to build and deploy engaging AR applications across different platforms and devices is expected to drive the growth of AR shopping market. , Asia Pacific to register the highest growth during the forecast period , Asia Pacific is expected to register the highest CAGR in the Augmented Reality (AR) shopping market from 2023 to 2028. The AR shopping market in Asia Pacific has witnessed numerous new developments and innovations. Companies like YouCam Makeup have pioneered such AR solutions in the region. Prominent retailers across the Asia Pacific region have embraced AR technology to enhance customer engagement and drive sales. For instance, Alibaba's e-commerce platform Taobao utilizes AR to enable virtual try-ons for cosmetic products, while JD.com has implemented AR features to visualize furniture and home decor items in customers' homes. These retailers provide immersive and interactive experiences, enhancing the shopping journey. The growth of the AR market in Asia Pacific can also be attributed to factors such as increasing usage of internet-based platforms, the continued rollout of high-speed 5G networks, and and advancements in technology. , Recent Developments , In November 2022, Google released new AR shopping features for finding the perfect foundation match and trying on sneakers in AR, providing a realistic and immersive online shopping experience. , In March 2021, PTC has launched Vuforia Engine Area Targets, the first offering in the market that supports the creation of immersive AR experiences for spaces up to 300,000 square feet. With the use of Area Targets, industrial organizations can create AR interfaces within their facilities. , In March 2021, Seiko Epson announced the enhancement of the AR glasses – Moverio BT-40 and BT – 40S by using Si-OLED technology to expand the field of view with full HD 1080p display resolution, improved connectivity, and comfort. , In September 2020, Microsoft partnershiped with Avatar Dimension, and selected it as the exclusive licensee for its volumetric capture technology in the Washington, D.C. area. Microsoft Mixed Reality Capture Studios certified the new studio after a rigorous testing process. The studio captures volumetric digital humans for business and governments, essential for powerful new virtual experiences across all categories. , In October 2020, Meta launched Oculus Quest 2, which can run as both a standalone headset with the internal android-based operating system and with Oculus compatible VR software running on desktop computers. , In March 2020, Apple released ARKi 3.5, which is an updated version of ARKi. The upgraded version has a new Scene Geometry application program interface (API) that uses the LiDAR scanner to create a 3D map of the space, differentiating between floors, walls, ceilings, windows, doors, and seats. , KEY MARKET SEGMENTS, By End Use , Retail / In-Store , E-Commerce / Out of Store , By AR Technology , Marker-based AR , Passive Marker , Active Marker , Markerless AR , Markerless AR, by Technology, , Model-based Tracking , Image-based Tracking , Markerless AR, by Type , Projection-based AR , Superimposition-based AR , Location-based AR , By Offering , Hardware , Displays and Projectors , Cameras , Sensors , Accelerometer , Gyroscope , Magnetometer , Proximity Sensor , Others , Software , Software Development Kit , AR Visualization Software , AR Content Management System , Others , Services , By Device Type , AR Head-Mounted Displays (HMD) , Smart AR Mirror , Handheld Devices , By Application , Try-on Solutions , Planning & Designing , Advertising & Marketing , Information Systems , By Market Type , Apparel , Furniture & Lighting , Jewelry , Beauty & Cosmetics , Footwear , Groceries , Others , By Region , North America , Europe , Asia Pacific , Rest of the World, KEY MARKET PLAYERS , PTC , Alphabet Inc. , Microsoft , Apple , Meta .

Request Free Customization

Want to customize this report? This report can be personalized according to your needs. Our analysts and industry experts will work directly with you to understand your requirements and provide you with customized data in a short amount of time. We offer $1000 worth of FREE customization at the time of purchase.

logo-images

Feedback From Our Clients

Augmented Reality (AR) Shopping Market

Product ID: UCMIG45A2114

$5,300
BUY NOW GET FREE SAMPLE