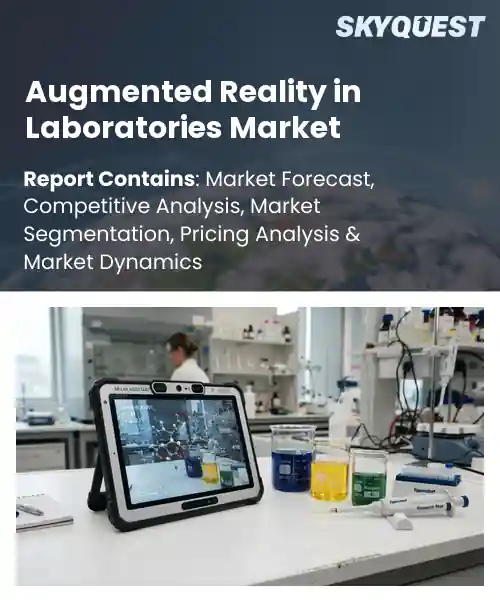
Augmented Reality in Laboratories Market
Report ID: SQMIG45E3313
Report ID: SQMIG45E3313
[email protected]
USA +1 351-333-4748
Report ID:
SQMIG45E3313 |
Region:
Global |
Published Date: September, 2026
Pages:
157
|Tables:
123
|Figures:
77


Global Augmented Reality In Laboratories Market size was valued at USD 390.0 Million in 2024 and is poised to grow from USD 473.85 Million in 2025 to USD 2250.36 Million by 2033, growing at a CAGR of 21.5% during the forecast period (2026-2033).
Augmented reality (AR) in laboratories overlays information onto experimental spaces, letting scientists view data, protocols, and molecular models instantly. The primary driver of this market is the relentless demand for faster, more accurate research, which forces institutions to adopt tools that cut manual errors and speed discovery. Historically, labs depended on paper logs and static screens; the early 2020s saw head mounted displays and tablet based overlays turn routine assays into interactive workflows. A genomic research center, for example, used AR guidance for pipetting, reducing reagent waste by fifteen percent and shrinking assay time from hours to minutes in modern labs. The second key factor propelling AR adoption is the convergence of high resolution sensors, cloud computing, and data security, which together create a scalable infrastructure for experimentation. When institutions integrate AR platforms, they can share 3D models across sites, enabling troubleshooting of syntheses and reducing duplication of effort. A pharmaceutical firm recently deployed a cloud linked AR system that projected time reaction parameters onto a chemist’s visor, allowing experts to intervene instantly and preventing a batch failure. This cause and effect loop connectivity generating insights, which then lower operational risk, opens lucrative opportunities for software vendors and hardware manufacturers alike.
How is AI-driven AR reshaping laboratory workflow automation?
AI driven augmented reality merges intelligent data processing with visual overlays to streamline laboratory tasks. By projecting step by step instructions onto equipment, the technology reduces manual entry and error while keeping scientists’ hands free. Current deployments blend computer vision with predictive models to recognize samples, suggest reagents and log results automatically. The market is moving from experimental pilots to routine use as manufacturers embed AI chips in headsets and software platforms integrate lab information systems. Examples include virtual pipette guidance, real time safety alerts and remote expert assistance that keep workflows fluid and reproducible.In April 2024, Microsoft introduced an AI enhanced HoloLens module for laboratory workflow automation, allowing scientists to see live protocol overlays while the system captures data and suggests next steps, accelerating experiment setup and reducing errors, which fuels market growth and operational efficiency.
Market snapshot - (2026-2033)
Global Market Size
USD 390.0 Million
Largest Segment
Hardware
Fastest Growth
Services
Growth Rate
21.5% CAGR
To get more insights on this market click here to Request a Free Sample Report
Global augmented reality in laboratories market is segmented by offering, device type, application, laboratory type and region. Based on offering, the market is segmented into Hardware, Software and Services. Based on device type, the market is segmented into AR Smart Glasses, Head-Mounted Displays, Mobile & Tablet Devices and Other AR Devices. Based on application, the market is segmented into Laboratory Training, Equipment Maintenance, Data Visualization, Remote Assistance, Laboratory Workflow Management and Other Applications. Based on laboratory type, the market is segmented into Research Laboratories, Clinical Laboratories, Pharmaceutical Laboratories, Industrial Laboratories and Academic Laboratories. Based on region, the market is segmented into North America, Europe, Asia Pacific, Latin America and Middle East & Africa.
AR smart glasses segment dominates because they provide hands free immersive overlay that aligns directly with a scientist’s line of sight, enabling real time guidance without disrupting sterile protocols. Their lightweight form factor and seamless integration with laboratory information systems reduce cognitive load and accelerate procedural accuracy. This ease of use drives widespread preference among lab technicians seeking immediate contextual data, positioning the hardware as the core enabler of augmented reality deployments in lab environments.
However, AR head mounted displays segment emerges as the fastest growing because modular optics and higher field of view designs are attracting advanced experimental setups that demand richer visualizations. Continuous improvements in ergonomics and battery life fuel adoption in complex assays, expanding market reach and creating new opportunities for immersive data interaction across diverse laboratory workflows.
Data visualization segment leads because it translates complex experimental results into intuitive three dimensional overlays, allowing researchers to instantly interpret trends without leaving the bench. By coupling real time sensor feeds with graphic models, it shortens analysis cycles and enhances reproducibility. This capability satisfies the core demand for rapid insight generation in research settings, making visualization the primary driver of augmented reality uptake among scientific teams across multidisciplinary projects and collaborative environments globally today.
On the other hand, Remote assistance segment emerges as the most rapidly expanding because enterprises are deploying real time expert support to bridge expertise gaps in decentralized labs. Advancements in low latency streaming and AI guided troubleshooting enable specialists to guide procedures remotely, reducing downtime and training costs. This growth propels broader AR diffusion and unlocks new service models for laboratory support.
To get detailed segments analysis, Request a Free Sample Report
North America leads the global Augmented Reality in Laboratories market due to a mature research ecosystem, strong investment in digital transformation, and close collaboration between technology providers and academic institutions. The United States hosts a concentration of pioneering biotech firms and university labs that prioritize immersive visualization for complex experimental workflows. Canada contributes a supportive regulatory environment and government‑backed innovation programs that accelerate adoption across pharmaceutical and environmental testing sectors. Both countries benefit from a robust supply chain of hardware manufacturers, software developers, and skilled talent pools, creating an integrated value network that fuels rapid prototyping and iterative development. In addition, the presence of leading venture capital communities drives continuous funding for startups focused on AR‑enabled instrumentation, reinforcing the region’s position as the benchmark for laboratory modernization.
United States Augmented Reality in Laboratories Market
Augmented Reality in Laboratories Market in the United States is propelled by a vibrant ecosystem of research universities that integrate immersive tools into chemistry and molecular biology curricula. Industry partners leverage this technology to accelerate drug discovery pipelines, reducing reliance on physical prototypes. Collaborative consortia between hardware vendors and federal research agencies foster standardization of interfaces, while a strong culture of open‑source development encourages rapid iteration and cross‑disciplinary innovation across academic and commercial settings.
Canada Augmented Reality in Laboratories Market
Augmented Reality in Laboratories Market in Canada benefits from federal research grants that prioritize digital augmentation of analytical processes. Canadian universities collaborate closely with biotech startups to embed AR overlays into microscopy and spectrometry workflows, enhancing data interpretation. The emphasis on sustainable laboratory practices encourages virtual instrumentation to reduce consumable waste. A supportive policy framework stimulates partnerships between provincial health agencies and technology incubators, accelerating the translation of prototype solutions into routine laboratory operations.
Europe experiences rapid expansion of the Augmented Reality in Laboratories market driven by strong collaboration between research institutions and industry clusters that prioritize precision and efficiency. The region’s deep expertise in chemical engineering and life sciences creates a demand for immersive visualization that shortens experimental cycles. Governmental innovation agendas encourage cross‑border projects, fostering harmonized standards and shared data platforms. Leading academic hubs in Germany, the United Kingdom and France attract multinational equipment manufacturers seeking to integrate AR interfaces into legacy laboratory infrastructure. A culture of sustainability further motivates the adoption of virtual prototyping to lower material consumption. Together, these factors generate a fertile environment for continuous advancement and market growth across European laboratories.
Germany Augmented Reality in Laboratories Market
Augmented Reality in Laboratories Market in Germany leverages the country’s strong engineering tradition and extensive pharmaceutical research base. Leading university labs integrate AR overlays with automated synthesis platforms to enhance precision and repeatability. Collaborative initiatives between industrial consortia and federal research institutes promote the development of standardized toolkits, facilitating broader adoption across academic and commercial settings. The focus on high‑value drug discovery and advanced materials drives continuous investment in immersive technologies that streamline complex experimental workflows.
United Kingdom Augmented Reality in Laboratories Market
Augmented Reality in Laboratories Market in the United Kingdom is propelled by a vibrant biotech sector and progressive research funding frameworks. University laboratories incorporate AR visualizations to accelerate molecular modeling and chemical analysis, reducing time to insight. Strategic partnerships between technology start‑ups and national health research bodies foster rapid prototyping of AR‑enabled diagnostic devices. Emphasis on open innovation and collaborative data sharing establishes the United Kingdom as a leading arena for pioneering laboratory augmentation solutions.
France Augmented Reality in Laboratories Market
Augmented Reality in Laboratories Market in France is emerging alongside strong governmental support for digital transformation in scientific research. French academic labs adopt AR interfaces to enhance spectroscopy interpretation and to visualize complex reaction pathways. Partnerships with regional technology clusters facilitate the customization of AR software for specific laboratory protocols, fostering localized innovation. The commitment to eco‑friendly research practices further encourages the substitution of physical mock‑ups with virtual simulations, positioning France as a growing hub for sustainable laboratory technologies.
Asia Pacific is strengthening its position in the Augmented Reality in Laboratories market through concerted investments in smart laboratory infrastructure and a rapidly expanding base of technology‑focused enterprises. Japan’s precision manufacturing culture aligns with the development of high‑resolution AR displays tailored for intricate analytical instruments, while South Korea’s robust semiconductor and biotech sectors drive demand for immersive visualization that accelerates process optimization. Regional research collaborations emphasize integration of AI with AR to create predictive lab environments, enhancing decision‑making speed. Government incentives that prioritize digital innovation in scientific domains encourage start‑ups to explore niche applications, and cross‑border trade agreements facilitate the diffusion of cutting‑edge hardware across the region. This synergistic ecosystem propels Asia Pacific toward becoming a leading source of advanced laboratory augmentation solutions.
Japan Augmented Reality in Laboratories Market
Augmented Reality in Laboratories Market in Japan benefits from the nation’s expertise in precision engineering and a strong culture of continuous improvement. Leading research institutes integrate AR overlays with microscopy and nanofabrication tools to provide real‑time guidance and error reduction. Collaboration between major electronics manufacturers and university labs drives the creation of compact, high‑fidelity head‑mounted displays optimized for laboratory environments. The government’s focus on next‑generation manufacturing and health research further incentivizes the deployment of immersive technologies that enhance experimental accuracy and efficiency.
South Korea Augmented Reality in Laboratories Market
Augmented Reality in Laboratories Market in South Korea is advancing rapidly owing to the country’s leadership in semiconductor research and a thriving biotech ecosystem. Academic laboratories employ AR visualizations to monitor microfluidic experiments and to streamline complex assay development. Partnerships with leading display manufacturers enable the production of lightweight, high‑resolution AR devices that integrate seamlessly with existing lab instrumentation. National innovation programs prioritize digital transformation of scientific workflows, encouraging enterprises to adopt immersive tools that reduce development cycles and improve reproducibility across pharmaceutical and material science research.
To know more about the market opportunities by region and country, click here to
Buy The Complete Report
Enhanced Experimental Visualization
Remote Collaboration leveraging Immersive Tools
High Implementation Cost
Technical Integration Challenges
Request Free Customization of this report to help us to meet your business objectives.
Insufficient data to generate the requested section.
Top Player’s Company Profile
Recent Developments
SkyQuest’s ABIRAW (Advanced Business Intelligence, Research & Analysis Wing) is our Business Information Services team that Collects, Collates, Correlates, and Analyses the Data collected by means of Primary Exploratory Research backed by robust Secondary Desk research. As per SkyQuest analysis the global AR in laboratories market is being propelled primarily by enhanced experimental visualization that lets researchers overlay digital models directly onto specimens, dramatically speeding insight generation. A second strong driver is the rise of remote collaboration using immersive tools, enabling dispersed teams to share real‑time annotations and reduce travel. The hardware segment centered on AR smart glasses leads the market because its hands‑free view aligns with laboratory workflows. North America dominates due to its mature research ecosystem and strong investment in digital transformation. However, high implementation cost remains a notable restraint, slowing adoption in budget‑constrained labs.
| Report Metric | Details |
|---|---|
| Market size value in 2024 | USD 390.0 Million |
| Market size value in 2033 | USD 2250.36 Million |
| Growth Rate | 21.5% |
| Base year | 2024 |
| Forecast period | (2026-2033) |
| Forecast Unit (Value) | USD Million |
| Segments covered |
|
| Regions covered | North America (US, Canada), Europe (Germany, France, United Kingdom, Italy, Spain, Rest of Europe), Asia Pacific (China, India, Japan, Rest of Asia-Pacific), Latin America (Brazil, Rest of Latin America), Middle East & Africa (South Africa, GCC Countries, Rest of MEA) |
| Companies covered |
|
| Customization scope | Free report customization with purchase. Customization includes:-
|
To get a free trial access to our platform which is a one stop solution for all your data requirements for quicker decision making. This platform allows you to compare markets, competitors who are prominent in the market, and mega trends that are influencing the dynamics in the market. Also, get access to detailed SkyQuest exclusive matrix.
Table Of Content
Executive Summary
Market overview
Parent Market Analysis
Market overview
Market size
KEY MARKET INSIGHTS
COVID IMPACT
MARKET DYNAMICS & OUTLOOK
Market Size by Region
KEY COMPANY PROFILES
Methodology
For the Augmented Reality in Laboratories Market, our research methodology involved a mixture of primary and secondary data sources. Key steps involved in the research process are listed below:
1. Information Procurement: This stage involved the procurement of Market data or related information via primary and secondary sources. The various secondary sources used included various company websites, annual reports, trade databases, and paid databases such as Hoover's, Bloomberg Business, Factiva, and Avention. Our team did 45 primary interactions Globally which included several stakeholders such as manufacturers, customers, key opinion leaders, etc. Overall, information procurement was one of the most extensive stages in our research process.
2. Information Analysis: This step involved triangulation of data through bottom-up and top-down approaches to estimate and validate the total size and future estimate of the Augmented Reality in Laboratories Market.
3. Report Formulation: The final step entailed the placement of data points in appropriate Market spaces in an attempt to deduce viable conclusions.
4. Validation & Publishing: Validation is the most important step in the process. Validation & re-validation via an intricately designed process helped us finalize data points to be used for final calculations. The final Market estimates and forecasts were then aligned and sent to our panel of industry experts for validation of data. Once the validation was done the report was sent to our Quality Assurance team to ensure adherence to style guides, consistency & design.
Analyst Support
Customization Options
With the given market data, our dedicated team of analysts can offer you the following customization options are available for the Augmented Reality in Laboratories Market:
Product Analysis: Product matrix, which offers a detailed comparison of the product portfolio of companies.
Regional Analysis: Further analysis of the Augmented Reality in Laboratories Market for additional countries.
Competitive Analysis: Detailed analysis and profiling of additional Market players & comparative analysis of competitive products.
Go to Market Strategy: Find the high-growth channels to invest your marketing efforts and increase your customer base.
Innovation Mapping: Identify racial solutions and innovation, connected to deep ecosystems of innovators, start-ups, academics, and strategic partners.
Category Intelligence: Customized intelligence that is relevant to their supply Markets will enable them to make smarter sourcing decisions and improve their category management.
Public Company Transcript Analysis: To improve the investment performance by generating new alpha and making better-informed decisions.
Social Media Listening: To analyze the conversations and trends happening not just around your brand, but around your industry as a whole, and use those insights to make better Marketing decisions.
REQUEST FOR SAMPLE
 REQUEST FREE CUSTOMIZATION


Want to customize this report? This report can be personalized according to your needs. Our analysts and industry experts will work directly with you to understand your requirements and provide you with customized data in a short amount of time. We offer $1000 worth of FREE customization at the time of purchase.
Feedback From Our Clients


 USA (+1) 351-333-4748

