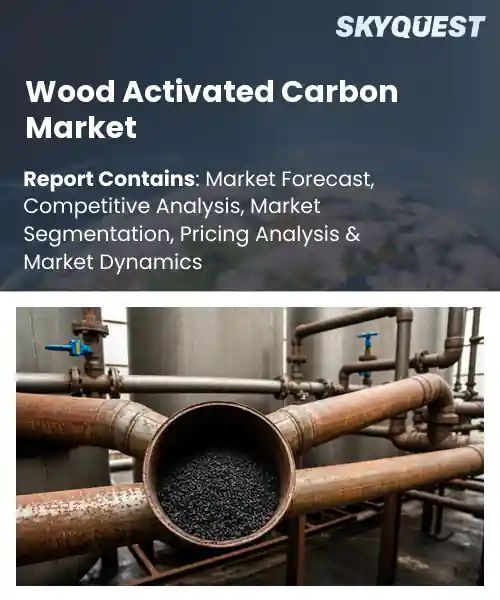
Wood Activated Carbon Market
Report ID: SQMIG15E3829
Report ID: SQMIG15E3829
[email protected]
USA +1 351-333-4748
Report ID:
SQMIG15E3829 |
Region:
Global |
Published Date: June, 2026
Pages:
157
|Tables:
147
|Figures:
78


Global Wood Activated Carbon Market size was valued at USD 600.0 Million in 2024 and is poised to grow from USD 666.0 Million in 2025 to USD 1534.82 Million by 2033, growing at a CAGR of 11.0% during the forecast period (2026-2033).
Wood activated carbon is a porous adsorbent made from sustainably sourced timber, and sits at the intersection of environmental remediation and industrial processing. The main market driver for wood activated carbon is growing regulatory pressure on water and air quality. In the last few decades, the sector moved from small charcoal filtration to high surface area engineered products for municipal water treatment, gold recovery and solvent purification, and manufacturers scaled production and used chemical activation to increase microporosity. With corporate targets rising and the public more concerned about contaminants such as PFAS and volatile organics, utilities and industries are turning to wood-based activated carbon for its renewability and effectiveness.
The global wood activated carbon market is driven by technological innovation in tailoring pore structures to target adsorption of specific contaminants, which has opened applications in industrial emissions control and advanced water remediation, building on regulatory momentum. As manufacturers optimize activation, product surface area and pore structure are aligned with the removal of PFAS, heavy metals or mercury and plants retrofit filters rather than invest in costly tertiary treatments. The ability to deliver on this creates opportunities within high value industries such as pharmaceuticals and food grade purification where consistent purity and low ash content command premium pricing and long term supply contracts. It also encourages regional hubs.
How is AI improving quality control in the wood activated carbon market?
AI is enhancing quality control in the wood activated carbon market through real-time monitoring of pore structure, particle size and surface chemistry using sensors and machine learning. The shape of the granule and surface defects are analyzed by computer vision and the adsorption active sites are deduced by spectroscopic models. Predictive analytics detect process drift before defects occur and digital twins allow engineers to test set points without shutting down lines. AI feeds into quality management systems to improve traceability and repeatability across facilities. This is important because buyers of water treatment and energy storage value consistent performance of materials and reliable supply.
Haycarb, February 2026. Launching new advanced carbon facility. This capacity expansion coupled with AI enabled quality management such as ETQ Reliance AI helps faster product onboarding, more consistent grades and reduced rework which helps scale up wood activated carbon supply to meet the growing industrial demand.
Market snapshot - (2026-2033)
Global Market Size
USD 600.0 Million
Largest Segment
Granular Activated Carbon (GAC)
Fastest Growth
Powdered Activated Carbon (PAC)
Growth Rate
11.0% CAGR
To get more insights on this market click here to Request a Free Sample Report
Global wood activated carbon market is segmented by product form, production method, application, function, end-use industry and region. Based on product form, the market is segmented into Powdered Activated Carbon (PAC), Granular Activated Carbon (GAC) and Pelletized Activated Carbon. Based on production method, the market is segmented into Chemical Activation and Physical Activation. Based on application, the market is segmented into Water Treatment, Air Purification, Food & Beverage Processing, Pharmaceutical Processing and Industrial Processing. Based on function, the market is segmented into Adsorption, Filtration and Catalytic Support. Based on end-use industry, the market is segmented into Water & Wastewater Treatment, Food & Beverage Industry, Pharmaceutical Industry, Chemical Industry and Environmental & Air Treatment. Based on region, the market is segmented into North America, Europe, Asia Pacific, Latin America and Middle East & Africa.
The Granular Activated Carbon segment leads the way because its physical form and mechanical strength make it better suited for fixed bed and continuous flow systems which are generally used in wood activated carbon applications. The larger particle size reduces the pressure drop, allows for longer operational cycles and easier regeneration, which in turn reduces lifecycle operational costs and encourages adoption by water treatment and industrial processors looking for reliable long duration adsorption performance and seamless integration with existing infrastructure.
However, Powdered Activated Carbon is enjoying the strongest growth momentum as users appreciate its rapid uptake, high surface area and simple dosing flexibility for emergency treatment and fine contaminant control. Increased demand from food, beverage and pharmaceutical applications and advances in slurry dosing and dispersion technologies are accelerating new application development and market penetration.
The Chemical Activation segment dominates the market due to its process chemistry which offers highly developed pore networks and customized surface chemistry to maximize adsorption capacity for a wide range of contaminants in wood activated carbon. Manufacturers and end users prefer consistent high performance grades, which promote investment in chemical activation facilities and product differentiation for demanding applications such as water purification and pharmaceutical processing.
However, Physical Activation is the fastest growing segment driven by technological improvements in steam and gas activation which reduce environmental footprint and enable scalable production. The increasing preference for cleaner processing routes and the demand for medium and large pore structures for the control of industrial gases and odors is creating opportunities and expanding manufacturing capacity.
To get detailed segments analysis, Request a Free Sample Report
The Asia Pacific region is leading the way in the global wood activated carbon market owing to the easy availability of wood feedstock, huge manufacturing infrastructure, and strong end-use sectors that create regular demand. Integrated supply chains link forestry resources to activation facilities and down-stream water treatment, air purification and industrial applications, benefiting regional suppliers. Differential grades for demanding applications supported by technical know-how in activation technologies and a strong focus on product quality. Uptake is also driven by policy settings that emphasize controlling emissions and improving water quality. Cross-border trade and the export orientation of leading producers further enhance scale advantages. The constant collaboration between industry and research guarantees innovation and process optimization in the region. Proximity to major consumer markets and the development of processing hubs drive cost efficiencies, lower delivered costs and competitiveness. Motors for development and certification of higher value products to meet international standards are private investment and public support for industrial upgrading.
Wood Activated Carbon Market Japan is very advanced in activation processes and offers specialty grades for electronics, water purification and automotive filtration. Domestic manufacturers rely on precision manufacturing, quality control and product certification to meet stringent application requirements. Cooperation between industry and technical institutes supports development of tailored solutions and specialty products. Integration of supply chain with regional forestry and logistics networks helps availability of feedstock.
Wood Activated Carbon South Korea High Purity applications for the semiconductor, chemical processing and industrial air treatment markets. Producers are considering controlled activation and hard purification for applications where consistency is needed. Strong links with manufacturers and fabrication industries enable customisation of product development and qualifications. Investment in process improvement and collaboration with research organisations underpin the speciality grades. reach and reliability of supply for export channels and logistic support
The European wood activated carbon market is growing at a fast pace due to strict environmental norms, high demand for advanced water and air treatment solutions and a well-established industrial base demanding high-quality adsorption media. Municipal water utilities, chemical processing and specialty manufacturing end-use sectors are looking for certified products that meet rigorous performance criteria. The market expectations are supported by an ecosystem of laboratories for testing and quality assurance frameworks, and provide impetus for the producers to innovate. Sustainable, traceable and feedstock-friendly procurement practices incentivize suppliers to show responsible sourcing. The close cooperation between manufacturers and research institutions and service providers leads to a faster adoption of higher value grades and application specific formulations in the diverse European markets. Faster qualification and supply through end-user cluster access and investments in specialty capacity and technical services help suppliers tackle complex purification challenges.
Wood Germany Activated Carbon Market has a sound chemical and engineering base for large scale production of high quality adsorption materials. A diverse product portfolio is supported by domestic demand from municipal water treatment, industrial purification and specialty manufacturing. Producers cite stringent quality control and certification to meet demanding application requirements. Efficient distribution and reliable support of purification projects close to European supply chains and networks of technical service providers.
The UK wood activated carbon market is driven by regulations on water quality and air emissions, which is leading to a rise in demand for sophisticated sorbents. Investment in localized treatment projects and upgrades to industrial purification drive growth. Fast qualification, special formulations and technical services are highlighted by suppliers as ways of meeting customers’ needs. Partnerships with research centres and technology providers allow development of application specific products for urban and industrial deployment and adoption.
Wood Activated Carbon Market France is being driven by environmental projects and growing municipal demand for dependable adsorption solutions. Local producers are attentive to sustainable sourcing and certification to meet procurement preferences. Specialty grades for purification of food, beverage and pharmaceuticals are developed by niche suppliers. Products are integrated into treatment systems working with engineering firms and service providers. Targeted investment in processing capabilities supports incremental growth in domestic supply and selective export market opportunities.
North America is growing in the wood activated carbon market with a focus on resilience of supply chain, technological innovation, and change in environmental and industrial demands. Regional manufacturers are investing in upgraded facilities and quality assurance for the higher purity grades needed by water utilities, industrial customers and specialty manufacturers. The collaboration of producers, technology providers and research organisations accelerates the development of specific formulations and technical services. The preference for sustainable sourcing and traceable feedstock procurement is pushing suppliers towards greater transparency and certification. Together with strong logistics networks and targeted investments in domestic processing capacity, these factors make North America a competitive and reliable supplier of specialty and commodity wood activated carbon products. The regulatory frameworks are supportive and service networks are established, so that advanced products are easily deployable, and export channels allow regional suppliers to reach their neighbouring markets.
Wood Activated Carbon Market, In the United States there is a strong demand for certified, high performance products in the municipal water treatment and industrial purification markets. For domestic producers the focus is on higher purity grades, technical support and fast qualification for difficult applications. With modernized facilities and resilient supply chains, manufacturers of customized formulations can now be more agile. Logistics for broad distribution. Work with service providers and labs to help with product validation.
The Wood Activated Carbon Market Canada is supported by the country’s rich forestry resources, and focuses on sustainable sourcing for both the domestic and export markets. For municipal and industrial water treatment applications, producers are focused on traceability and certification to meet procurement expectations. Specialty producers manufacture tailored grades for food and pharma purification, and alliances with environmental service companies provide integrated treatment solutions. Logistical problems in remote areas result in new packaging and distribution methods so there is always a steady supply.
To know more about the market opportunities by region and country, click here to
Buy The Complete Report
Rising Demand From Water Treatment
Growth In Air Purification Applications
Feedstock Supply Variability
Environmental Regulation and Compliance
Request Free Customization of this report to help us to meet your business objectives.
The competitive landscape is characterised by consolidation among traditional producers, while bio-based specialists and material innovators increase the competitive pressure. The incumbents are locking in capacity and capabilities via acquisitions and strategic deals, as we have seen in Kuraray’s Calgon Carbon acquisition and Calgon Carbon’s recent purchase of a reactivation business, driven by regulatory-driven demand for PFAS remediation and indoor air solutions. Incumbents are challenged by startups and tech partners who are innovating products and piloting partnerships with cellulose-based and pyrolysis-based adsorbents.
SkyQuest’s ABIRAW (Advanced Business Intelligence, Research & Analysis Wing) is our Business Information Services team that Collects, Collates, Correlates, and Analyses the Data collected by means of Primary Exploratory Research backed by robust Secondary Desk research.
As per SkyQuest analysis, the global wood activated carbon market is poised for robust expansion. A key driver is tightening regulatory pressure on water and air quality that accelerates procurement for municipal and industrial remediation. A second driver is rapid technological innovation in tailored pore structures and AI-enabled quality control which improves performance and consistency for high-value applications. Granular Activated Carbon is the dominating segment because its mechanical strength and suitability for fixed bed systems lower operating costs, while Asia Pacific is the dominating region due to abundant feedstock, manufacturing scale and export orientation. A key restraint is feedstock supply variability that can undermine batch uniformity and complicate scaling of consistent grades.
| Report Metric | Details |
|---|---|
| Market size value in 2024 | USD 600.0 Million |
| Market size value in 2033 | USD 1534.82 Million |
| Growth Rate | 11.0% |
| Base year | 2024 |
| Forecast period | (2026-2033) |
| Forecast Unit (Value) | USD Million |
| Segments covered |
|
| Regions covered | North America (US, Canada), Europe (Germany, France, United Kingdom, Italy, Spain, Rest of Europe), Asia Pacific (China, India, Japan, Rest of Asia-Pacific), Latin America (Brazil, Rest of Latin America), Middle East & Africa (South Africa, GCC Countries, Rest of MEA) |
| Companies covered |
|
| Customization scope | Free report customization with purchase. Customization includes:-
|
To get a free trial access to our platform which is a one stop solution for all your data requirements for quicker decision making. This platform allows you to compare markets, competitors who are prominent in the market, and mega trends that are influencing the dynamics in the market. Also, get access to detailed SkyQuest exclusive matrix.
Table Of Content
Executive Summary
Market overview
Parent Market Analysis
Market overview
Market size
KEY MARKET INSIGHTS
COVID IMPACT
MARKET DYNAMICS & OUTLOOK
Market Size by Region
KEY COMPANY PROFILES
Methodology
For the Wood Activated Carbon Market, our research methodology involved a mixture of primary and secondary data sources. Key steps involved in the research process are listed below:
1. Information Procurement: This stage involved the procurement of Market data or related information via primary and secondary sources. The various secondary sources used included various company websites, annual reports, trade databases, and paid databases such as Hoover's, Bloomberg Business, Factiva, and Avention. Our team did 45 primary interactions Globally which included several stakeholders such as manufacturers, customers, key opinion leaders, etc. Overall, information procurement was one of the most extensive stages in our research process.
2. Information Analysis: This step involved triangulation of data through bottom-up and top-down approaches to estimate and validate the total size and future estimate of the Wood Activated Carbon Market.
3. Report Formulation: The final step entailed the placement of data points in appropriate Market spaces in an attempt to deduce viable conclusions.
4. Validation & Publishing: Validation is the most important step in the process. Validation & re-validation via an intricately designed process helped us finalize data points to be used for final calculations. The final Market estimates and forecasts were then aligned and sent to our panel of industry experts for validation of data. Once the validation was done the report was sent to our Quality Assurance team to ensure adherence to style guides, consistency & design.
Analyst Support
Customization Options
With the given market data, our dedicated team of analysts can offer you the following customization options are available for the Wood Activated Carbon Market:
Product Analysis: Product matrix, which offers a detailed comparison of the product portfolio of companies.
Regional Analysis: Further analysis of the Wood Activated Carbon Market for additional countries.
Competitive Analysis: Detailed analysis and profiling of additional Market players & comparative analysis of competitive products.
Go to Market Strategy: Find the high-growth channels to invest your marketing efforts and increase your customer base.
Innovation Mapping: Identify racial solutions and innovation, connected to deep ecosystems of innovators, start-ups, academics, and strategic partners.
Category Intelligence: Customized intelligence that is relevant to their supply Markets will enable them to make smarter sourcing decisions and improve their category management.
Public Company Transcript Analysis: To improve the investment performance by generating new alpha and making better-informed decisions.
Social Media Listening: To analyze the conversations and trends happening not just around your brand, but around your industry as a whole, and use those insights to make better Marketing decisions.
REQUEST FOR SAMPLE
 REQUEST FREE CUSTOMIZATION
Global Wood Activated Carbon Market size was valued at USD 600.0 Million in 2024 and is poised to grow from USD 666.0 Million in 2025 to USD 1534.82 Million by 2033, growing at a CAGR of 11.0% during the forecast period (2026-2033).
Competitive landscape shows consolidation among legacy producers while bio-based specialists and material innovators increase competitive pressure. Regulatory driven demand for PFAS remediation and indoor air solutions forces incumbents to secure capacity and capabilities via acquisitions and strategic deals, as seen in Kuraray’s Calgon Carbon acquisition and Calgon Carbon’s recent reactivation-business purchase. Startups and technology partners push product innovation and pilot partnerships to challenge incumbents with cellulose based and pyrolysis based adsorbents. 'Cabot Corporation', 'Kuraray Co., Ltd.', 'Haycarb PLC', 'Ingevity Corporation', 'Jacobi Carbons Group', 'Calgon Carbon Corporation', 'Osaka Gas Chemicals Co., Ltd.', 'Kureha Corporation', 'Donau Carbon GmbH', 'Silcarbon Aktivkohle GmbH', 'Evoqua Water Technologies LLC', 'Arkema S.A.', 'Carbon Activated Corporation', 'Adsorbent Carbons Pvt. Ltd.', 'Acuro Organics Limited', 'Chemtex Speciality Limited', 'Fujian Zhixing Activated Carbon Co., Ltd.', 'Induceramic', 'ADA Carbon Solutions', 'Datong Coal Jinding Activated Carbon Co., Ltd.'
Activated carbon produced from wood is increasingly adopted in water treatment applications due to its favorable pore structure, adsorption profile, and sustainability credentials, prompting utilities and industries to prefer it for removing organic contaminants, taste and odor compounds, and discoloration. This widening preference drives procurement and long term contracts, encourages capacity expansion among suppliers, and stimulates innovation in tailored wood carbon grades for specific treatment needs, collectively supporting market growth by aligning product attributes with regulatory compliance priorities and customer demand for effective, renewable adsorbents.
Advanced Water Purification Demand: Growing concerns over emerging contaminants and customer expectations for cleaner drinking water are driving utilities and industrial end users toward higher-performance adsorbents. Wood-based activated carbon is gaining preference for its renewable origin, tunable pore structure, and compatibility with regeneration systems. Producers are responding with tailored grades, technical service, and supply assurances that align with treatment plant operations. This shift emphasizes long-term vendor partnerships, product consistency, and integrated lifecycle support rather than commodity pricing alone.
Why does Asia Pacific Dominate the Global Wood Activated Carbon Market? |@12


Want to customize this report? This report can be personalized according to your needs. Our analysts and industry experts will work directly with you to understand your requirements and provide you with customized data in a short amount of time. We offer $1000 worth of FREE customization at the time of purchase.
Feedback From Our Clients


 USA (+1) 351-333-4748

