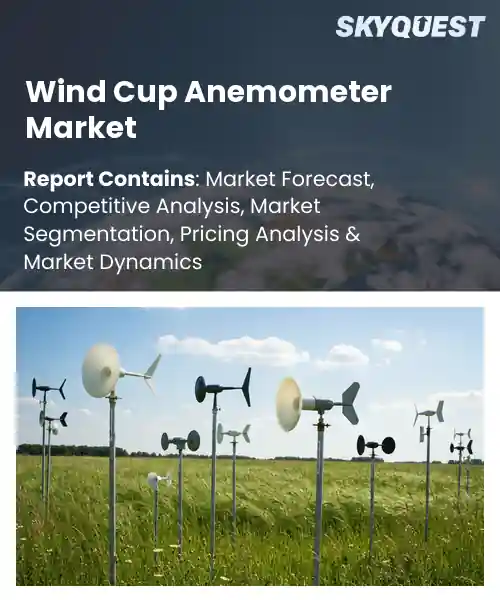
Wind Cup Anemometer Market
Report ID: SQMIG45J2760
Report ID: SQMIG45J2760
[email protected]
USA +1 351-333-4748
Report ID:
SQMIG45J2760 |
Region:
Global |
Published Date: August, 2026
Pages:
157
|Tables:
145
|Figures:
78


Global Wind Cup Anemometer Market size was valued at USD 286.4 Million in 2024 and is poised to grow from USD 303.87 Million in 2025 to USD 488.0 Million by 2033, growing at a CAGR of 6.1% during the forecast period (2026-2033).
The wind cup anemometer market growth is driven due to the push for exact wind measurements for things like turbine siting, performance tracking, and operational improvement. Also, there’s this rising investment in automated meteorological stations and real-time environmental monitoring; that part is boosting adoption across meteorology, aviation, marine, agriculture, and industrial settings. On top of that, improvements in wireless connectivity, IoT integration, data logging, and sensor precision are making modern cup anemometers more and more helpful for remote supervision and smart weather programs. People also keep buying cup anemometers because they’re relatively affordable, they’re dependable over time, and they’re already widely used in wind-energy related work.
The wind cup anemometer market outlook is currently shifting, with AI and IoT making it move away from basic mechanical sensing toward something more like smart data centers. In practice, IoT connectivity pushes calibrated readings up to cloud platforms so it offers real time analytics. Then AI based algorithms help strip out turbulence noise, correct for sensor misalignment, and even help forecast short term wind patterns. Today, there are hybrid devices that still keep the classic cup design, but pair it with digital twins for predictive diagnostics and for smoother integration into broader weather monitoring networks. This combination enables operators to gain better insight into site performance, reduces maintenance visits and supports more accurate turbine control. These improvements are making wind farms more reliable and allowing developers to optimize power generation across a variety of terrains.
Market snapshot - (2026-2033)
Global Market Size
USD 286.4 Million
Largest Segment
Fixed
Fastest Growth
Portable
Growth Rate
6.1% CAGR
To get more insights on this market click here to Request a Free Sample Report
The global wind cup anemometer market is segmented by mounting type, number of cups, output type, application, end user and region. Based on mounting type, the market is segmented into Fixed and Portable. Based on number of cups, the market is segmented into Two-Cup, Three-Cup and Four-Cup. Based on output type, the market is segmented into Analog, Digital and Wireless. Based on application, the market is segmented into Meteorology, Wind Energy, Agriculture, Marine and Industrial Monitoring. Based on end user, the market is segmented into Weather Stations, Research Institutes and Industrial Facilities. Based on region, the market is segmented into North America, Europe, Asia Pacific, Latin America and Middle East & Africa.
As per the wind cup anemometer market analysis, the fixed segment is dominant because it obviates the need for periodic recalibration and provides the inherent stability required for long-term observational requirements. It is rugged and very well suited for permanent stations for the weather, where it is continuously in the air stream but not disturbed by motion. Users are drawn to the repeatability in tough conditions and the low maintenance demands. This adds to its ongoing popularity with research facilities and utility operators who need a dependable, consistent wind measurement source, seasonally and year-round.
However, due to campaigns and short term site evaluations, the portable category is having the fastest development speed, requiring quick fixes. Manufacturers are working on modular designs to grow the market and increase project opportunities. The lightweight design’s portability enables users to better record fleeting wind events over a landscape.
According to the wind cup anemometer market forecast, the digital category is leading the way in solving the increasing demand for accurate real-time analytics as it is able to provide high-resolution data that can be immediately linked to current monitoring platforms. Standardized protocol output means faster deployment in automated weather networks and research institutions, and easier data handling. Users, both domestic and international, benefit from the consistency and lower error rates for a wide range of industry applications that enhance confidence in wind resource estimates and operational decision making.
At the same time, wireless is emerging as a major high-growth area as remote monitoring projects look for untethered communications. With advances in battery technology and low power transmission, it is now possible to operate without a lot of wiring – opening up prospects in harsh agricultural regions and offshore buoys. Such flexibility enables new service models and accelerates market penetration.
To get detailed segments analysis, Request a Free Sample Report
As per the wind cup anemometer market regional forecast, Asia Pacific is well poised as it has a mature industrial ecosystem that can manufacture high-quality instruments, a strong government push for renewable energy and abundant coastal wind resources. In this area investments in R&D are made in a strategic way to continuously improve the durability and accuracy of sensors. Close cooperation between wind farm developers and technology vendors accelerates implementation of wind cup anemometers for site assessment and performance monitoring. The engineering know-how behind strong supply chains allows for rapid expansion of production with lower prices. A self-reinforcing cycle of market demand, technical know-how and regulatory support props up the region's leadership position in the global market.
Japan Wind Cup Anemometer Market
The Japan wind cup anemometer industry is propelled by early involvement in offshore wind projects and a legislative framework that promotes accurate wind measurement. Local research institutes offer innovative calibration methods, and instruments are made in the country with state-of-the-art materials and precision engineering to guaranty reliability. At the same time, the focus on high-resolution data for turbine optimization is in line with Japan’s determination to grow its renewable energy sources portfolio, thus creating a constant demand for advanced wind cup solutions.
South Korea Wind Cup Anemometer Market
The South Korean wind cup anemometer sector is gaining momentum with a proactive energy transition strategy that emphasizes accurate wind resource assessment. The country’s strong industrial base allows it to produce strong and affordable anemometers, and collaborations between academic institutions and private companies speed up technological progress. Reliable wind measurement becomes more and more necessary due to government subsidies for renewable energy installations. This is promoting the market growth and application of wind cup devices in new developing wind farms.
Europe’s rise is powered by a vast network of onshore and offshore wind farms, a tradition of engineering excellence that ensures high standards of data accuracy and ambitious decarbonization goals. The cooperative research initiatives in the continent stimulate the continuous development of sensor technology and the strict certification requirements ask for accurate measuring instruments. There are two major reasons why operators use sophisticated wind cup anemometers: grid integration and performance optimization. The use of digital platforms for real-time monitoring adds value to accurate wind data, to support the growing trend of the market across the region.
Germany Wind Cup Anemometers Market
Germany has a long history of engineering and a strong supply chain for the Wind Cup Anemometer industry to provide the latest equipment. The nation’s aggressive offshore wind development program is driving innovation and requiring very precise wind measurements. Research institutes, in collaboration with industry experts, develop advanced calibration methods and the focus on sustainability promotes the deployment of robust, low-maintenance devices at several project sites.
United Kingdom Wind Cup Anemometer Market
The UK wind cup anemometer market penetration is expanding fast, driven by aggressive offshore wind pipelines and supportive policy frameworks. There is a network of specialized manufacturers that serve this industry and value accuracy and durability in harsh marine environments. Industry and academia collaboration is accelerating next generation anemometer designs, while data-driven asset management practices are driving the need for reliable wind measurement solutions.
France Wind Cup Anemometer Market
The Wind Cup Anemometer Market in France is becoming a key player in the broader renewable sector, driven by the growth of offshore wind projects and a commitment to technological innovation. French research organizations have the ambition to improve the accuracy of sensors and their integration with digital analytics systems. Local manufacturers are increasingly marketing themselves as high performance wind cup providers to deliver reliable wind data to local and nearby market operators.
The major forces driving the North America wind cup anemometer market are growth in wind energy, automated weather monitoring, environmental research and industrial applications. The demand is also being driven by the need for accurate wind-resource evaluation and turbine performance monitoring. The region includes the US, Canada and Mexico, with the US being the primary market.
United States Wind Cup Anemometer Market
The United States is the dominant market in North America and it has a developed wind energy infrastructure and a steady demand for wind resource assessment, turbine instrumentation, meteorological stations and environmental applications. Cup anemometers remain in widespread use due to their reliability and suitability for wind speed monitoring. However, regulatory issues and policy uncertainties could slow the pace of new wind energy generation.
Canada Wind Cup Anemometer Market
The growth of renewable energy, meteorological monitoring and environmental assessment is primarily driving the well-established and growing Canadian wind cup anemometer market. The criterion is especially related to the operational monitoring of wind farms and estimation of wind resources. The country is likely to witness an increased use of reliable wind measurement equipment with greater emphasis on sustainable electricity generation and growth of wind capacity.
To know more about the market opportunities by region and country, click here to
Buy The Complete Report
Increasing Renewable Energy Policies
Across the globe, governments are formulating favorable policies that support clean energy production, leading to a regulatory environment that is conducive to the growth of wind power. Such policies include subsidies, tax breaks and faster approval procedures that cut project development schedules and reduce financial barriers. This results in an increasing demand by turbine manufacturers and service providers for reliable wind measurement equipment that requires regular investments into state-of-the-art anemometer technologies that meet strict performance requirements, improve operational efficiency in new wind farms and support grid stability.
Growing Demand for Accurate Data
Accurate data on wind speed and direction is important for energy operators to optimize turbine location, performance monitoring and predictive maintenance. Better data means more reliable power output, less downtime and greater wind project ROI. This has led to a growing demand for high-resolution and low-maintenance anemometers by producers who are developing sensors with improved durability, shorter response times and easy integration with digital monitoring systems. Such a technical focus will accelerate market growth in terms of higher equipment procurement thru adoption in both onshore and offshore sites.
High Initial Capital Expenditure
Advanced anemometer systems are usually associated with high initial cost related to sensor purchase, installation and calibration services. For smaller companies and new entrants to the market, such costs may be a barrier to invest in advanced wind measurement systems when project funds are limited. It means that budget-sensitive stakeholders may opt for less accurate, less costly options, which could limit the total market penetration of premium anemometers and hinder the acceptance of cost-oriented wind energy programs. That would give manufacturers less incentive to continue spending on research and development of the next generation of devices.
Technical Integration Challenges
When integrating anemometer outputs with existing SCADA and energy management systems, there could be issues with compatibility and data standards. Firmware updates, signal processing requirements and other connection protocols often require additional engineering work and specialized knowledge. Some operators are deterred from deploying newer sensor types due to the complexity, which also increases operating costs and project timelines. This means a slower rate of market acceptance. Cutting edge technology can cause delays in data-driven decision making processes and require significant system changes and continuous support.
Request Free Customization of this report to help us to meet your business objectives.
The competitive landscape includes new entrants partnering with turbine manufacturers to embed smart wind-cup solutions in turbine control systems, and existing sensor players expanding their portfolios thru strategic acquisitions (e.g., Vaisala’s acquisition of a niche cup-anemometer company). Technology advances like IoT connectivity and AI data analytics are driving differentiation and market positioning.
Top Player’s Company Profile
Recent Developments in the Wind Cup Anemometer Market
Campbell Scientific has expanded its line of wind measuring devices with the WINDSENSOR P2546C and P2546D three-cup anemometers. WINDSENSOR P2546C and P2546D three-cup anemometers for MEASNET calibration and IEC 61400-12 Class 1 performance for wind-resource evaluation and power performance applications.
Vaisala has been involved in research comparing lidar measurements to conventional cup anemometers for wind-energy applications as part of the work to develop wind measuring systems. In 2025, the research concentrated on enhancing lidar performance and validating the readings with popular cup-anemometer techniques.
SkyQuest’s ABIRAW (Advanced Business Intelligence, Research & Analysis Wing) is our Business Information Services team that Collects, Collates, Correlates, and Analyses the Data collected by means of Primary Exploratory Research backed by robust Secondary Desk research.
As per SkyQuest analysis, the key market driver is increasing demand for precise wind data to facilitate advanced turbine control and predictive maintenance. The second driver is the AI and IoT technologies that employ conventional cup sensors as smart hubs and offer high precision and real-time cloud analytics. Asia Pacific leads the world with strong renewable targets, and a mature supply chain. The segment landscape is dominated by fixed mounting devices, which provide long term stations with reliable and low maintenance measurements. However, the high initial capital expenditure acts as a deterrent to smaller developers who prefer cheaper options and do not adopt it.
| Report Metric | Details |
|---|---|
| Market size value in 2024 | USD 286.4 Million |
| Market size value in 2033 | USD 488.0 Million |
| Growth Rate | 6.1% |
| Base year | 2024 |
| Forecast period | (2026-2033) |
| Forecast Unit (Value) | USD Million |
| Segments covered |
|
| Regions covered | North America (US, Canada), Europe (Germany, France, United Kingdom, Italy, Spain, Rest of Europe), Asia Pacific (China, India, Japan, Rest of Asia-Pacific), Latin America (Brazil, Rest of Latin America), Middle East & Africa (South Africa, GCC Countries, Rest of MEA) |
| Companies covered |
|
| Customization scope | Free report customization with purchase. Customization includes:-
|
To get a free trial access to our platform which is a one stop solution for all your data requirements for quicker decision making. This platform allows you to compare markets, competitors who are prominent in the market, and mega trends that are influencing the dynamics in the market. Also, get access to detailed SkyQuest exclusive matrix.
Table Of Content
Executive Summary
Market overview
Parent Market Analysis
Market overview
Market size
KEY MARKET INSIGHTS
COVID IMPACT
MARKET DYNAMICS & OUTLOOK
Market Size by Region
KEY COMPANY PROFILES
Methodology
For the Wind Cup Anemometer Market, our research methodology involved a mixture of primary and secondary data sources. Key steps involved in the research process are listed below:
1. Information Procurement: This stage involved the procurement of Market data or related information via primary and secondary sources. The various secondary sources used included various company websites, annual reports, trade databases, and paid databases such as Hoover's, Bloomberg Business, Factiva, and Avention. Our team did 45 primary interactions Globally which included several stakeholders such as manufacturers, customers, key opinion leaders, etc. Overall, information procurement was one of the most extensive stages in our research process.
2. Information Analysis: This step involved triangulation of data through bottom-up and top-down approaches to estimate and validate the total size and future estimate of the Wind Cup Anemometer Market.
3. Report Formulation: The final step entailed the placement of data points in appropriate Market spaces in an attempt to deduce viable conclusions.
4. Validation & Publishing: Validation is the most important step in the process. Validation & re-validation via an intricately designed process helped us finalize data points to be used for final calculations. The final Market estimates and forecasts were then aligned and sent to our panel of industry experts for validation of data. Once the validation was done the report was sent to our Quality Assurance team to ensure adherence to style guides, consistency & design.
Analyst Support
Customization Options
With the given market data, our dedicated team of analysts can offer you the following customization options are available for the Wind Cup Anemometer Market:
Product Analysis: Product matrix, which offers a detailed comparison of the product portfolio of companies.
Regional Analysis: Further analysis of the Wind Cup Anemometer Market for additional countries.
Competitive Analysis: Detailed analysis and profiling of additional Market players & comparative analysis of competitive products.
Go to Market Strategy: Find the high-growth channels to invest your marketing efforts and increase your customer base.
Innovation Mapping: Identify racial solutions and innovation, connected to deep ecosystems of innovators, start-ups, academics, and strategic partners.
Category Intelligence: Customized intelligence that is relevant to their supply Markets will enable them to make smarter sourcing decisions and improve their category management.
Public Company Transcript Analysis: To improve the investment performance by generating new alpha and making better-informed decisions.
Social Media Listening: To analyze the conversations and trends happening not just around your brand, but around your industry as a whole, and use those insights to make better Marketing decisions.
REQUEST FOR SAMPLE
 REQUEST FREE CUSTOMIZATION
Global Wind Cup Anemometer Market size was valued at USD 286.4 Million in 2024 and is poised to grow from USD 303.87 Million in 2025 to USD 488.0 Million by 2033, growing at a CAGR of 6.1% during the forecast period (2026-2033).
The competitive landscape is shaped by established sensor leaders expanding portfolios through strategic acquisitions such as Vaisala’s purchase of a niche cup‑anemometer firm, while emerging players form alliances with turbine manufacturers to embed smart wind‑cup solutions directly into turbine control systems. Accelerated tech innovation, including integration of IoT connectivity and AI‑driven data analytics, is driving differentiation and elevating market positioning. 'Vaisala Oyj', 'Campbell Scientific, Inc.', 'Thies Clima GmbH', 'Gill Instruments Limited', 'Lufft Mess- und Regeltechnik GmbH', 'R. M. Young Company', 'Nielsen-Kellerman Co.', 'AIRMAR Technology Corporation', 'OMEGA Engineering, Inc.', 'Davis Instruments', 'Delta OHM S.r.l.', 'PCE Instruments', 'Kestrel Instruments', 'Lambrecht meteo GmbH', 'Biral Ltd.', 'Met One Instruments, Inc.', 'METER Group, Inc.', 'FT Technologies Ltd.', 'NovaLynx Corporation', 'Vector Instruments'
Governments worldwide are implementing supportive policies that prioritize clean energy generation, thereby creating a regulatory environment conducive to wind power expansion. These policies often include subsidies, tax incentives, and streamlined permitting processes that reduce project development timelines and financial barriers. As a result, turbine manufacturers and service providers experience heightened demand for reliable wind measurement equipment, encouraging continuous investment in advanced anemometer technologies that meet stringent performance standards and enhance operational efficiency across emerging wind farms and contribute to overall grid stability.
Digital Twin Integration: Manufacturers are embedding digital twin technologies into anemometer design and deployment, enabling real‑time virtual replicas that mirror sensor performance across diverse wind regimes. This capability allows operators to predict maintenance needs, calibrate outputs remotely, and optimize placement without physical trial‑and‑error. As data fidelity improves, stakeholders gain confidence to scale installations faster, reducing downtime and enhancing lifecycle profitability while supporting renewable integration strategies. It also streamlines regulatory testing, speeds innovation, and encourages joint research among OEMs, utilities, and universities globally.
subheading)". So we must include "(subheading)" after the line.


Want to customize this report? This report can be personalized according to your needs. Our analysts and industry experts will work directly with you to understand your requirements and provide you with customized data in a short amount of time. We offer $1000 worth of FREE customization at the time of purchase.
Feedback From Our Clients


 USA (+1) 351-333-4748

