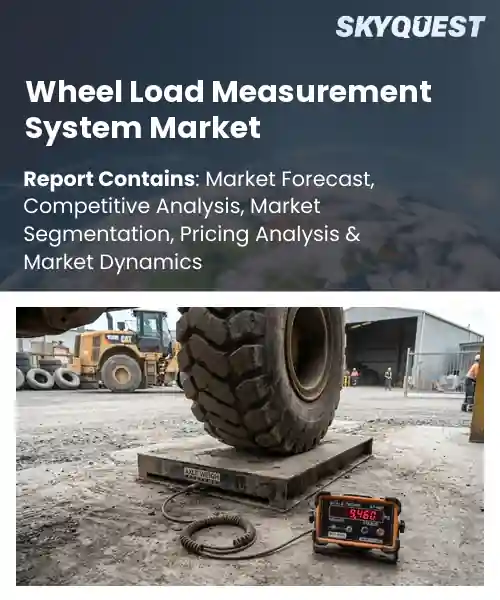
Wheel Load Measurement System Market
Report ID: SQMIG45J2838
Report ID: SQMIG45J2838
[email protected]
USA +1 351-333-4748
Report ID:
SQMIG45J2838 |
Region:
Global |
Published Date: August, 2026
Pages:
157
|Tables:
146
|Figures:
78


Global Wheel Load Measurement System Market size was valued at USD 286.4 Million in 2024 and is poised to grow from USD 304.44 Million in 2025 to USD 496.34 Million by 2033, growing at a CAGR of 6.3% during the forecast period (2026-2033).
The wheel load measurement system market comprises technologies capturing, transmitting, and analyzing forces exerted by vehicle wheels on infrastructure such as bridges, highways, and rail tracks. Its importance stems from the need to prevent over‑loading, which can accelerate structural fatigue, cause costly repairs, and increase accident risk. The primary driver of market expansion is the surge in freight traffic combined with stricter regulatory frameworks that demand load monitoring. Historically, the industry evolved from static weigh‑in‑motion stations to IoT‑enabled sensor arrays; for instance, Federal Highway Administration now deploys strain gauges on bridges, while agencies use analytics to optimize maintenance schedules effectively. Building on the regulatory impetus described earlier, digital integration of wheel load data has become the market’s pivotal growth engine. When sensor streams feed analytics platforms, operators can predict overload events before they occur, thereby averting structural damage and reducing downtime. This predictive capability has spurred deployments such as China’s smart‑highway corridors, where load dashboards inform traffic routing, and Germany’s bridge management system that schedules repairs based on cumulative stress patterns. Consequently, manufacturers are expanding service portfolios to include cloud hosting, edge‑computing modules, and subscription‑based monitoring, unlocking revenue streams and encouraging entry into economies where aging assets demand surveillance solutions.
What role does IoT play in advancing the wheel load measurement system market?
IoT transforms wheel load measurement by embedding sensors that stream data directly to cloud dashboards, allowing operators to see weight distribution in real time. This connectivity eliminates manual checks, reduces downtime, and supports predictive maintenance as patterns of overload are identified before damage occurs. Integrated with fleet management software, IoT devices enable automatic logging of each trip, creating a continuous feedback loop that improves tire lifespan and road safety. The market now favors solutions that combine rugged hardware with intuitive analytics, driving manufacturers to focus on seamless wireless communication and edge processing. As logistics networks become more data‑centric, the demand for smart load measurement grows, reinforcing the role of IoT as a catalyst for efficiency and innovation.In May 2023, a leading provider introduced an IoT‑enabled wheel load sensor that automatically uploads measurements to a centralized platform, demonstrating how connected hardware accelerates adoption and operational gains.
Market snapshot - (2026-2033)
Global Market Size
USD 286.4 Million
Largest Segment
Strain Gauge-Based
Fastest Growth
Piezoelectric-Based
Growth Rate
6.3% CAGR
To get more insights on this market click here to Request a Free Sample Report
Global wheel load measurement system market is segmented by technology, measurement type, vehicle type, application, end-use industry and region. Based on technology, the market is segmented into Strain Gauge-Based, Load Cell-Based, Hydraulic Pressure-Based and Piezoelectric-Based. Based on measurement type, the market is segmented into Static Load Measurement and Dynamic Load Measurement. Based on vehicle type, the market is segmented into Wheel Loaders, Forklifts, Trucks and Mining Vehicles. Based on application, the market is segmented into Load Management, Weighing & Measurement and Fleet Management. Based on end-use industry, the market is segmented into Construction, Mining, Logistics & Transportation and Agriculture. Based on region, the market is segmented into North America, Europe, Asia Pacific, Latin America and Middle East & Africa.
Mining vehicles segment leads because the extreme operating conditions and massive load requirements of underground and surface mining compel operators to seek precise load monitoring for safety and equipment longevity. These machines experience continuous high stress, making realtime weight data essential for preventing overload failures and optimizing haul cycles. Consequently, manufacturers prioritize robust measurement solutions that can endure harsh environments, cementing this vehicle category’s dominant role in market adoption significantly.
On the other hand, forklifts segment is witnessing the strongest growth momentum as ecommerce fulfillment and warehouse automation raise demand for compact material handling equipment. Precise weight verification improves load stability and reduces product damage, prompting rapid adoption of advanced wheel load measurement units and creating fresh opportunities for integrators.
Strain gauge based segment dominates because its proven reliability and cost effectiveness make it the preferred choice for most manufacturers tailoring wheel load measurement systems to a wide range of equipment. The technology delivers accurate load data with minimal calibration effort, which aligns with operator expectations for ease of integration. Its mature supply chain and compatibility with existing electronic architectures reinforce its leading position in the market globally overall.
Meanwhile, hydraulic pressure based segment emerges as the most rapidly expanding because emerging heavyduty equipment demands higher load capacity and robustness, prompting OEMs to adopt hydraulic solutions for their superior pressure tolerance. This shift fuels new design opportunities and stimulates supplier investment, accelerating market expansion and creating fresh revenue streams.
To get detailed segments analysis, Request a Free Sample Report
The region combines a deep engineering heritage with rapid urbanisation that fuels demand for precise axle monitoring. Strong manufacturing bases produce high‑quality sensors and data‑analytics platforms, while extensive highways and rail networks create a pressing need for safety and efficiency solutions. Governmental focus on infrastructure resilience and environmental compliance encourages early adoption of advanced load‑measurement technologies. Collaborative ecosystems linking equipment makers, research institutes, and logistics operators accelerate innovation cycles, giving the region a competitive edge. Together, these factors create a robust demand pipeline and position Asia Pacific as the benchmark for technology standards and implementation practices worldwide.
Wheel Load Measurement System Market in Japan is supported by a long‑standing commitment to precision engineering and a dense freight corridor network. Leading automotive and railway suppliers integrate load‑measurement devices into new vehicle platforms, fostering a culture of continuous improvement. Regulatory emphasis on safety and environmental stewardship further drives adoption across ports and industrial zones. Close cooperation between manufacturers and academic research centres nurtures next‑generation sensing solutions, reinforcing Japan’s reputation as a hub for reliable and sophisticated load‑management technologies.
Wheel Load Measurement System Market in South Korea benefits from aggressive infrastructure upgrades and a vibrant export‑oriented manufacturing sector. National initiatives promoting smart logistics encourage deployment of real‑time monitoring across highways and intermodal terminals. Domestic technology firms leverage advanced semiconductor capabilities to produce compact, high‑resolution sensors that meet rigorous performance expectations. Partnerships between global vehicle OEMs and local system integrators accelerate knowledge transfer, ensuring that South Korean operators remain at the forefront of operational efficiency and asset protection.
Europe’s market momentum stems from stringent safety regulations, a strong emphasis on sustainability, and sophisticated transport corridors that demand accurate load monitoring. Mature automotive and rail industries invest heavily in retrofitting existing fleets with intelligent measurement solutions to reduce wear and optimise fuel consumption. Collaborative research frameworks across the continent foster standardisation and interoperability, while public‑private initiatives promote digital twins of logistics networks. The convergence of environmental targets with cost‑efficiency goals motivates operators to adopt advanced load‑measurement systems, positioning Europe as a leader in integrated, data‑driven transportation management.
Wheel Load Measurement System Market in Germany is anchored by a robust engineering tradition and a dense network of autobahns and freight corridors. Leading industrial groups embed load‑sensing technologies into heavy‑duty vehicles to meet exacting reliability standards. Collaborative clusters linking sensor manufacturers, software developers, and logistics providers accelerate the rollout of predictive maintenance solutions. A strong regulatory framework ensures consistent implementation, reinforcing Germany’s role as a benchmark for precision and operational excellence in the European market.
Wheel Load Measurement System Market in United Kingdom experiences swift growth driven by ambitious infrastructure renewal programmes and a proactive approach to digital transformation. Freight operators adopt real‑time load monitoring to enhance road safety and reduce emissions across congested arterial routes. Innovation hubs in key transport corridors foster partnerships between academia, technology start‑ups, and legacy vehicle manufacturers, accelerating the deployment of cloud‑based analytics platforms. This dynamic ecosystem underpins the United Kingdom’s reputation as a fast‑adopting market within Europe.
Wheel Load Measurement System Market in France is emerging alongside extensive rail modernization and expanding highway freight capacity. Government incentives encourage integration of load‑measurement devices to improve asset lifespan and align with sustainability objectives. Domestic sensor developers collaborate with major logistics firms to tailor solutions for mixed‑traffic environments, emphasizing ease of installation and data accessibility. The growing focus on interoperability and cross‑border compatibility positions France as an increasingly influential participant in the broader European landscape.
North America leverages its extensive road and rail infrastructure, coupled with a strong culture of innovation, to reinforce its market standing. Leading transportation firms prioritize predictive analytics to minimise downtime and extend vehicle life, prompting widespread adoption of sophisticated load‑measurement technologies. Collaborative ecosystems involving major sensor producers, software innovators, and logistics operators drive continuous improvement and integration with broader fleet management platforms. Regulatory encouragement of safety and emissions reductions further motivates investment in data‑rich monitoring solutions. This combination of scale, technology leadership, and policy alignment ensures North America remains a pivotal driver of global market advancement.
Wheel Load Measurement System Market in United States is propelled by vast interstate networks and high freight volumes that demand rigorous load oversight. Leading automotive and railroad manufacturers embed advanced sensors into new vehicle designs, while retrofit initiatives target aging fleets across key logistics corridors. Strong venture capital support fuels the development of AI‑enabled analytics platforms that translate raw load data into actionable insights. This ecosystem of hardware excellence and software sophistication sustains the United States as a central hub for innovative load‑management solutions.
Wheel Load Measurement System Market in Canada benefits from a focus on remote and harsh‑climate operations, where precise load monitoring supports safety and equipment longevity. National transportation agencies endorse smart sensor deployments across rail lines and long‑haul trucking routes to address seasonal wear challenges. Partnerships between local technology firms and international equipment manufacturers enable the customization of robust, weather‑resistant measurement solutions. This collaborative approach enhances Canada's capability to maintain resilient supply chains while advancing its position within the North American market.
To know more about the market opportunities by region and country, click here to
Buy The Complete Report
Growing Integration Of IoT Connectivity
Increasing Demand For Predictive Maintenance
High Initial Capital Expenditure
Limited Standardization Across Regions
Request Free Customization of this report to help us to meet your business objectives.
The Wheel Load Measurement System market is shaped by intense competition as manufacturers race to embed real‑time IoT sensors and cloud‑based analytics, a driver that reduces wheel wear and improves safety. Recent moves include strategic partnerships with telematics providers and acquisitions aimed at expanding sensor portfolios, accelerating product differentiation.
Top Player’s Company Profile
Recent Developments
SkyQuest’s ABIRAW (Advanced Business Intelligence, Research & Analysis Wing) is our Business Information Services team that Collects, Collates, Correlates, and Analyses the Data collected by means of Primary Exploratory Research backed by robust Secondary Desk research. As per SkyQuest analysis, the wheel load measurement system market is being propelled primarily by the growing integration of IoT connectivity, which enables real‑time sensor data to feed cloud analytics and support smarter fleet decisions. A second strong driver is the rising demand for predictive maintenance, as firms seek to anticipate wheel fatigue and reduce unplanned downtime. The market faces a notable restraint in the high initial capital expenditure required for hardware, software and integration, which can delay adoption for budget‑constrained operators. Asia Pacific dominates the landscape thanks to its rapid infrastructure growth and advanced sensor manufacturing, while strain‑gauge‑based technology remains the leading segment due to its reliability and cost‑effectiveness.
| Report Metric | Details |
|---|---|
| Market size value in 2024 | USD 286.4 Million |
| Market size value in 2033 | USD 496.34 Million |
| Growth Rate | 6.3% |
| Base year | 2024 |
| Forecast period | (2026-2033) |
| Forecast Unit (Value) | USD Million |
| Segments covered |
|
| Regions covered | North America (US, Canada), Europe (Germany, France, United Kingdom, Italy, Spain, Rest of Europe), Asia Pacific (China, India, Japan, Rest of Asia-Pacific), Latin America (Brazil, Rest of Latin America), Middle East & Africa (South Africa, GCC Countries, Rest of MEA) |
| Companies covered |
|
| Customization scope | Free report customization with purchase. Customization includes:-
|
To get a free trial access to our platform which is a one stop solution for all your data requirements for quicker decision making. This platform allows you to compare markets, competitors who are prominent in the market, and mega trends that are influencing the dynamics in the market. Also, get access to detailed SkyQuest exclusive matrix.
Table Of Content
Executive Summary
Market overview
Parent Market Analysis
Market overview
Market size
KEY MARKET INSIGHTS
COVID IMPACT
MARKET DYNAMICS & OUTLOOK
Market Size by Region
KEY COMPANY PROFILES
Methodology
For the Wheel Load Measurement System Market, our research methodology involved a mixture of primary and secondary data sources. Key steps involved in the research process are listed below:
1. Information Procurement: This stage involved the procurement of Market data or related information via primary and secondary sources. The various secondary sources used included various company websites, annual reports, trade databases, and paid databases such as Hoover's, Bloomberg Business, Factiva, and Avention. Our team did 45 primary interactions Globally which included several stakeholders such as manufacturers, customers, key opinion leaders, etc. Overall, information procurement was one of the most extensive stages in our research process.
2. Information Analysis: This step involved triangulation of data through bottom-up and top-down approaches to estimate and validate the total size and future estimate of the Wheel Load Measurement System Market.
3. Report Formulation: The final step entailed the placement of data points in appropriate Market spaces in an attempt to deduce viable conclusions.
4. Validation & Publishing: Validation is the most important step in the process. Validation & re-validation via an intricately designed process helped us finalize data points to be used for final calculations. The final Market estimates and forecasts were then aligned and sent to our panel of industry experts for validation of data. Once the validation was done the report was sent to our Quality Assurance team to ensure adherence to style guides, consistency & design.
Analyst Support
Customization Options
With the given market data, our dedicated team of analysts can offer you the following customization options are available for the Wheel Load Measurement System Market:
Product Analysis: Product matrix, which offers a detailed comparison of the product portfolio of companies.
Regional Analysis: Further analysis of the Wheel Load Measurement System Market for additional countries.
Competitive Analysis: Detailed analysis and profiling of additional Market players & comparative analysis of competitive products.
Go to Market Strategy: Find the high-growth channels to invest your marketing efforts and increase your customer base.
Innovation Mapping: Identify racial solutions and innovation, connected to deep ecosystems of innovators, start-ups, academics, and strategic partners.
Category Intelligence: Customized intelligence that is relevant to their supply Markets will enable them to make smarter sourcing decisions and improve their category management.
Public Company Transcript Analysis: To improve the investment performance by generating new alpha and making better-informed decisions.
Social Media Listening: To analyze the conversations and trends happening not just around your brand, but around your industry as a whole, and use those insights to make better Marketing decisions.
REQUEST FOR SAMPLE
 REQUEST FREE CUSTOMIZATION


Want to customize this report? This report can be personalized according to your needs. Our analysts and industry experts will work directly with you to understand your requirements and provide you with customized data in a short amount of time. We offer $1000 worth of FREE customization at the time of purchase.
Feedback From Our Clients


 USA (+1) 351-333-4748

