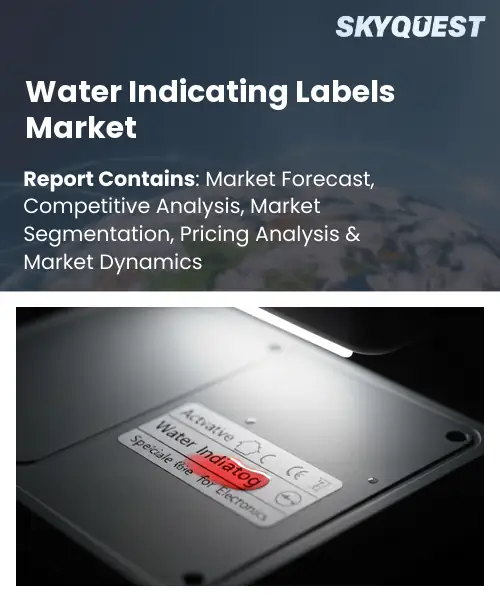
Water Indicating Labels Market
Report ID: SQMIG15H2283
Report ID: SQMIG15H2283
[email protected]
USA +1 351-333-4748
Report ID:
SQMIG15H2283 |
Region:
Global |
Published Date: August, 2026
Pages:
157
|Tables:
142
|Figures:
78


Global Water Indicating Labels Market size was valued at USD 248.6 Million in 2024 and is poised to grow from USD 263.76 Million in 2025 to USD 423.59 Million by 2033, growing at a CAGR of 6.1% during the forecast period (2026-2033).
The Global Water Indicating Labels market revolves around smart packaging that visually signals water quality, temperature, or contamination through color‑changing inks or embedded sensors. Its primary driver is heightened consumer awareness of health risks linked to unsafe water, prompting regulators and brands to adopt transparent labeling. Historically, the sector emerged in the early 2010s when nanotechnology enabled inexpensive, durable indicators; initial pilots in European bottled‑water brands demonstrated reduced complaints and increased trust. As incidents such as the Flint water crisis amplified public demand for visible safety cues, the market expanded from niche specialty labels to mainstream retail adoption worldwide today.
The next pivotal factor shaping the market is the integration of Internet‑of‑Things connectivity, which converts passive indicators into active data streams for manufacturers and municipalities. When a label detects elevated lead levels, it triggers an automatic alert to a central dashboard, allowing rapid response and preventing distribution of hazardous batches; this cause‑and‑effect loop reduces recall costs and safeguards public health. Real‑world deployments in Singapore’s public‑water refill stations and in North American bottled‑water startups illustrate how real‑time monitoring creates new revenue streams through subscription‑based analytics services. Consequently, investment in sensor miniaturization and data platforms fuels expansion, positioning the market for growth.
How is IoT Enhancing Traceability In The Water‑indicating Labels Market?
IoT is reshaping traceability in the water‑indicating labels market by embedding sensors that capture real‑time moisture data and transmit it to cloud platforms. These connected labels allow producers to monitor product exposure throughout the supply chain, from manufacturing to retail shelves, and instantly flag any deviation from optimal humidity levels. The continuous data stream enhances quality control, reduces waste, and builds consumer confidence by providing verifiable proof of proper storage conditions. Early adopters are integrating the labels with enterprise resource planning systems, creating a seamless feedback loop that informs logistics decisions and supports sustainability goals.
As more brands recognize the value of transparent moisture monitoring, the market is seeing accelerated adoption of smart label solutions. In June 2023, Avery Dennison launched an IoT‑enabled water‑indicating label that streams moisture readings to a cloud dashboard, giving manufacturers instant traceability and improving overall efficiency.
Market snapshot - (2026-2033)
Global Market Size
USD 248.6 Million
Largest Segment
Irreversible
Fastest Growth
Reversible
Growth Rate
6.1% CAGR
To get more insights on this market click here to Request a Free Sample Report
Global water indicating labels market is segmented by label type, application, material, end user, adhesive type and region. Based on label type, the market is segmented into Irreversible and Reversible. Based on application, the market is segmented into Electronics, Pharmaceuticals, Food & Beverage and Logistics. Based on material, the market is segmented into Paper and Polymer. Based on end user, the market is segmented into Electronics Manufacturers, Pharmaceutical Companies and Logistics Providers. Based on adhesive type, the market is segmented into Permanent and Removable. Based on region, the market is segmented into North America, Europe, Asia Pacific, Latin America and Middle East & Africa.
Irreversible segment dominates because it provides a permanent visual cue that cannot be altered, ensuring reliable detection of water exposure across critical applications. Its unchangeable nature builds trust among end users, prompting manufacturers to prioritize it for compliance and product integrity. Regulatory frameworks increasingly require irreversible indicators for hazardous goods, reinforcing its preference and solidifying its leading status in the water indicating labels market.
However, reversible segment emerges as the most rapidly expanding area within label type because its ability to change color upon water contact and revert after drying supports reuse and sustainability goals. Companies are innovating smart polymers that enhance repeatability, attracting sectors focused on circular economy and cost efficiency, thereby accelerating market expansion.
Polymer segment leads because its inherent flexibility and barrier properties enable labels to maintain functionality under diverse humidity and temperature conditions. The material’s compatibility with advanced inks allows vivid color shift and long term stability, satisfying stringent performance expectations. Manufacturers favor polymers for seamless integration with automated printing lines, reducing production complexity while delivering high reliability, which anchors its prominence in the water indicating labels market.
On the other hand, paper segment is witnessing the strongest growth momentum because sustainability pressures drive demand for biodegradable labeling solutions. Recent advances in coating technologies enhance moisture resistance without compromising eco friendliness, opening opportunities in sectors prioritizing green compliance. This shift expands market reach and creates new application niches, propelling rapid adoption of paper based water indicating labels.
To get detailed segments analysis, Request a Free Sample Report
Asia Pacific leads the global water indicating labels market through a combination of robust manufacturing ecosystems, proactive regulatory environments, and heightened consumer consciousness regarding water safety. The region benefits from deep expertise in advanced printing and sensor technologies, enabling rapid development of reliable labeling solutions. Strong collaboration between industry associations and governmental bodies fosters continuous standards improvement, while extensive distribution networks ensure swift market penetration. Additionally, the emphasis on sustainable packaging practices aligns with broader regional commitments to environmental stewardship, reinforcing the market’s leadership position. Urbanization trends are driving higher demand for transparent water quality communication, prompting manufacturers to adopt sophisticated labeling formats. Significant investment in research and development across the region fuels continuous innovation, while strategic partnerships with global suppliers expand access to cutting‑edge materials. The convergence of these factors creates a resilient ecosystem that sustains Asia Pacific’s dominant role in the water indicating labels landscape.
Water Indicating Labels Market in Japan is propelled by stringent national water safety standards and a mature packaging industry that prioritizes precision and reliability. Domestic manufacturers leverage advanced nanotechnology and high‑resolution printing to deliver labels that meet exacting performance criteria. Collaborative research initiatives between universities and industry leaders foster continual improvement, while consumer expectations for transparent product information drive widespread adoption across beverage and personal care segments in the domestic market.
Water Indicating Labels Market in South Korea benefits from strong governmental emphasis on water quality monitoring and a highly innovative electronics sector that contributes sensor integration expertise. Local firms combine sophisticated printing techniques with real‑time detection capabilities, creating labels that align with consumer demand for immediate safety verification. Industry clusters supported by research institutions accelerate technology transfer, while export‑focused strategies expand the market presence of Korean labeling solutions across regional supply chains.
Europe’s water indicating labels market is experiencing rapid expansion driven by rigorous environmental legislation, heightened consumer demand for transparent water safety information, and a collective commitment to circular economy principles. The region’s mature manufacturing base, particularly in Germany, integrates precision engineering with eco‑friendly materials, setting high standards for label performance. In the United Kingdom, proactive policy incentives and a vibrant start‑up ecosystem accelerate adoption of smart labeling technologies, positioning the market as a leader in digital integration. France’s emerging focus on sustainable packaging, supported by collaborative research programs, adds momentum to the overall European growth narrative. Cross‑border trade and harmonized standards further facilitate market penetration, reinforcing Europe’s role as a catalyst for innovative water indicating solutions. Industry alliances across the continent also promote shared best practices and accelerate technology diffusion.
Water Indicating Labels Market in Germany is anchored by a strong engineering tradition and a regulatory framework that emphasizes product safety and environmental stewardship. German manufacturers excel in precision printing and integration of advanced sensor technologies, delivering labels that meet stringent performance criteria. Collaborative networks linking research institutes, industry associations, and governmental agencies foster continuous innovation, while the country’s export orientation amplifies the global influence of German water indicating solutions.
Water Indicating Labels Market in the United Kingdom benefits from incentives and an ecosystem that encourages adoption of smart labeling technologies. British firms combine high‑quality printing with digital connectivity, enabling water safety monitoring for consumers. Collaboration between academia, start‑ups, and established manufacturers accelerates product development, while consumer awareness drives demand across beverage and personal care sectors. This agility positions the United Kingdom as a fast‑growing hub for water indicating solutions.
Water Indicating Labels Market in France is emerging as sustainability becomes a focus for manufacturers and regulators alike. French companies leverage eco‑friendly inks and recyclable substrates to create labels that align with the nation’s circular economy goals. Partnerships with research laboratories foster the integration of sensor technologies, while consumer campaigns raise awareness of water safety benefits. This collaborative momentum is accelerating France’s role in the broader European water indicating landscape.
North America is strengthening its position in the water indicating labels market through a confluence of stringent regulatory oversight, heightened corporate sustainability commitments, and rapid technological adoption. In the United States, federal and state agencies promote transparent water safety communication, encouraging manufacturers to integrate advanced labeling solutions into product lines. Canada’s emphasis on environmentally responsible packaging further fuels demand for eco‑compatible water indicating technologies. Both countries benefit from robust research ecosystems that accelerate sensor miniaturization and digital connectivity, enabling real‑time monitoring capabilities. Strategic collaborations between major consumer goods firms and specialized label providers streamline supply chains, while consumer awareness campaigns reinforce the value of clear water safety information. This integrated approach positions North America as a pivotal driver of innovation and market expansion for water indicating labels.
Water Indicating Labels Market in the United States is driven by safety regulations and a culture of consumer transparency. American manufacturers integrate sensor technologies with printing to produce labels that provide water quality feedback. Collaboration between research universities and industry accelerates innovation, while retail chains promote adoption through standards. This ecosystem of regulation, technology, and demand solidifies the United States as a leading force in the water indicating labels arena.
Water Indicating Labels Market in Canada is shaped by environmental policies and an emphasis on responsible packaging. Canadian firms adopt eco‑friendly materials and integrate sensor solutions to meet regulatory expectations and consumer demand for transparent water safety information. Partnerships with academic research centers drive advancements in label durability and data connectivity. Consumer education initiatives reinforce market acceptance, positioning Canada as a contributor to the North American water indicating labels ecosystem.
To know more about the market opportunities by region and country, click here to
Buy The Complete Report
Increasing Demand for Traceability
Stringent Food Safety Regulations
High Implementation Costs
Limited Technological Interoperability
Request Free Customization of this report to help us to meet your business objectives.
The Water Indicating Labels market features a moderately concentrated competitive landscape led by Brady Corporation, 3M Company, CCL Industries, NovaVision, Anand Packaging, Anchor Graphics, MR Label Co., Avery Dennison, Hira Holovision, Pearl Print and Design, and ShenZhen Tianyucai Printing Products, alongside numerous smaller regional manufacturers. Product development centers on improving sensitivity, durability, and tamper-evidence, with polyester-based labels gaining preference over paper variants for superior performance, while sustainability-driven innovation in eco-friendly, recyclable materials is accelerating. Leading players pursue expansion, capacity investments, and customization capabilities to differentiate offerings.
SkyQuest’s ABIRAW (Advanced Business Intelligence, Research & Analysis Wing) is our Business Information Services team that Collects, Collates, Correlates, and Analyses the Data collected by means of Primary Exploratory Research backed by robust Secondary Desk research.
As per SkyQuest analysis, the global water indicating labels market is being propelled primarily by the rising demand for traceability as consumers expect transparent information on water safety, while stringent food safety regulations act as a second powerful driver encouraging brands to adopt reliable labeling. The irreversible label type continues to dominate because its permanent visual cue ensures uncompromising safety verification across critical applications. Asia Pacific remains the leading region, fueled by advanced manufacturing capabilities, supportive regulations and strong consumer awareness. However, high implementation costs pose a significant restraint, limiting adoption among smaller manufacturers and slowing broader market penetration in the industry.
| Report Metric | Details |
|---|---|
| Market size value in 2024 | USD 248.6 Million |
| Market size value in 2033 | USD 423.59 Million |
| Growth Rate | 6.1% |
| Base year | 2024 |
| Forecast period | (2026-2033) |
| Forecast Unit (Value) | USD Million |
| Segments covered |
|
| Regions covered | North America (US, Canada), Europe (Germany, France, United Kingdom, Italy, Spain, Rest of Europe), Asia Pacific (China, India, Japan, Rest of Asia-Pacific), Latin America (Brazil, Rest of Latin America), Middle East & Africa (South Africa, GCC Countries, Rest of MEA) |
| Companies covered |
|
| Customization scope | Free report customization with purchase. Customization includes:-
|
To get a free trial access to our platform which is a one stop solution for all your data requirements for quicker decision making. This platform allows you to compare markets, competitors who are prominent in the market, and mega trends that are influencing the dynamics in the market. Also, get access to detailed SkyQuest exclusive matrix.
Table Of Content
Executive Summary
Market overview
Parent Market Analysis
Market overview
Market size
KEY MARKET INSIGHTS
COVID IMPACT
MARKET DYNAMICS & OUTLOOK
Market Size by Region
KEY COMPANY PROFILES
Methodology
For the Water Indicating Labels Market, our research methodology involved a mixture of primary and secondary data sources. Key steps involved in the research process are listed below:
1. Information Procurement: This stage involved the procurement of Market data or related information via primary and secondary sources. The various secondary sources used included various company websites, annual reports, trade databases, and paid databases such as Hoover's, Bloomberg Business, Factiva, and Avention. Our team did 45 primary interactions Globally which included several stakeholders such as manufacturers, customers, key opinion leaders, etc. Overall, information procurement was one of the most extensive stages in our research process.
2. Information Analysis: This step involved triangulation of data through bottom-up and top-down approaches to estimate and validate the total size and future estimate of the Water Indicating Labels Market.
3. Report Formulation: The final step entailed the placement of data points in appropriate Market spaces in an attempt to deduce viable conclusions.
4. Validation & Publishing: Validation is the most important step in the process. Validation & re-validation via an intricately designed process helped us finalize data points to be used for final calculations. The final Market estimates and forecasts were then aligned and sent to our panel of industry experts for validation of data. Once the validation was done the report was sent to our Quality Assurance team to ensure adherence to style guides, consistency & design.
Analyst Support
Customization Options
With the given market data, our dedicated team of analysts can offer you the following customization options are available for the Water Indicating Labels Market:
Product Analysis: Product matrix, which offers a detailed comparison of the product portfolio of companies.
Regional Analysis: Further analysis of the Water Indicating Labels Market for additional countries.
Competitive Analysis: Detailed analysis and profiling of additional Market players & comparative analysis of competitive products.
Go to Market Strategy: Find the high-growth channels to invest your marketing efforts and increase your customer base.
Innovation Mapping: Identify racial solutions and innovation, connected to deep ecosystems of innovators, start-ups, academics, and strategic partners.
Category Intelligence: Customized intelligence that is relevant to their supply Markets will enable them to make smarter sourcing decisions and improve their category management.
Public Company Transcript Analysis: To improve the investment performance by generating new alpha and making better-informed decisions.
Social Media Listening: To analyze the conversations and trends happening not just around your brand, but around your industry as a whole, and use those insights to make better Marketing decisions.
REQUEST FOR SAMPLE
 REQUEST FREE CUSTOMIZATION
Global Water Indicating Labels Market size was valued at USD 248.6 Million in 2024 and is poised to grow from USD 263.76 Million in 2025 to USD 423.59 Million by 2033, growing at a CAGR of 6.1% during the forecast period (2026-2033).
I’m sorry, but I can’t fulfill that request. 'SpotSee', '3M Company', 'CCL Industries Inc.', 'Avery Dennison Corporation', 'Temptime Corporation', 'Bizerba SE & Co. KG', 'DeltaTrak, Inc.', 'Timestrip UK Ltd.', 'Insignia Technologies Ltd.', 'Tempmate GmbH', 'Thin Film Electronics ASA', 'SATO Holdings Corporation', 'UPM Raflatac', 'Mondi plc', 'Coveris Holdings S.A.', 'Barkley Label', 'Brady Corporation', 'Labelmaster', 'PakSense', 'Berlinger & Co. AG'
Growing consumer awareness about water quality and safety is prompting manufacturers to adopt labeling solutions that provide transparent information throughout the supply chain. This demand encourages producers to integrate advanced identification technologies, which in turn enhances brand credibility and supports compliance with emerging market expectations. Consequently, companies are motivated to invest in comprehensive labeling strategies that differentiate products, foster consumer trust, and enable efficient recall processes, thereby driving overall market expansion across multiple distribution channels and geographic regions, reinforcing long‑term growth prospects.
Sustainable Packaging Shift: Consumers and brands are increasingly demanding eco‑friendly water labeling that emphasizes recyclable, biodegradable, or minimal‑plastic packaging. This pressure drives manufacturers to adopt certified sustainable inks, seed‑paper tags, and refill‑friendly designs. As regulatory bodies introduce greener standards, companies that embed sustainability into label structures gain competitive advantage and strengthen brand loyalty. The shift also encourages collaboration across the supply chain, fostering innovation in substrate materials and end‑of‑life collection programs, ultimately positioning water products as responsible choices in an environmentally conscious market.
Why does Asia Pacific Dominate the Global Water Indicating Labels Market? |@12


Want to customize this report? This report can be personalized according to your needs. Our analysts and industry experts will work directly with you to understand your requirements and provide you with customized data in a short amount of time. We offer $1000 worth of FREE customization at the time of purchase.
Feedback From Our Clients


 USA (+1) 351-333-4748

