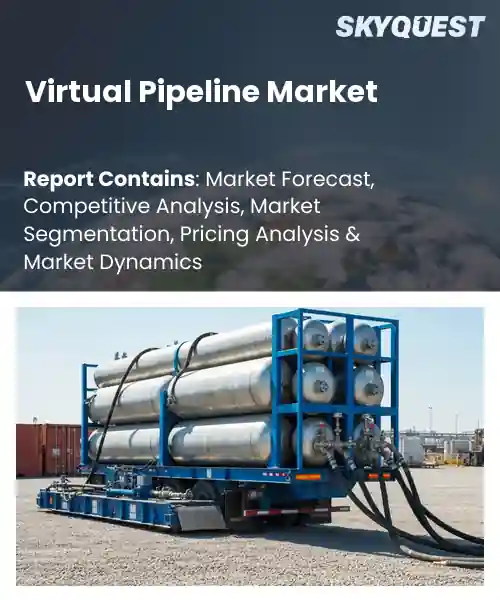
Virtual Pipeline Market
Report ID: SQMIG10F2050
Report ID: SQMIG10F2050
[email protected]
USA +1 351-333-4748
Report ID:
SQMIG10F2050 |
Region:
Global |
Published Date: June, 2026
Pages:
157
|Tables:
116
|Figures:
77


Global Virtual Pipeline Market size was valued at USD 8.52 Billion in 2024 and is poised to grow from USD 9.31 Billion in 2025 to USD 18.85 Billion by 2033, growing at a CAGR of 9.22% during the forecast period (2026-2033).
Platforms mimicking how actual pipelines operate using data gathering, analytics and control make up the virtual pipeline market. The oil and gas industry has been focused on reducing costs, maintaining safety and complying with ever stricter environmental regulations. Virtual pipelines were first developed as a niche solution for monitoring offshore production facilities before gaining wide acceptance in 2016 when Shell employed an extensive sensor array to monitor its West Africa gas pipeline, achieving a 20% decrease in the time needed to detect leaks. Advances in the development of IoT devices, increase in the capabilities of cloud computing and the use of Artificial Intelligence have enabled the virtual pipeline market to transition away from piloting and into the mainstream through commercial solutions being adopted by organizations worldwide.
In addition, the growing emphasis by regulators on monitoring emissions and increasing transparency in operations has created a demand for operators to use data-driven solutions. As governments issue stricter requirements for leak reporting, operators must develop ways to monitor leaks through investments in monitoring technology. This combination of circumstances has also created a significant increase in demand for a virtual pipeline solution that combines and analyzes multiple streams of data through the use of AI. This trend can be seen in the US where a Natural Gas Utility has implemented a virtual pipeline solution that utilizes satellite imagery, SCADA data and predictive modeling combined to reduce the number of unplanned outages by 15% and decrease carbon intensity. Consequently, the market expands as investors fund architectures, unlocking opportunities across offshore, on‑shore, and renewable‑hydrogen corridors.
How is AI Enhancing Performance And Security In The Virtual Pipeline Market?
The virtual pipeline industry is being transformed by artificial intelligence (AI), which allows for ongoing integration of data, rapid detection of anomalies, and automated decision support. Through ingestion of real-time sensor data from a wide variety of assets, machine learning models can identify incidents before they happen (i.e., by flagging pressure spikes or unauthorized access). Predictive analytics provide estimates on when equipment will fail or need maintenance so that operators can plan maintenance when the demand is low and eliminate unplanned shutdowns. AI-based flow optimization improves throughput of virtual corridor systems by balancing rack rates and using less energy. Advanced analytic tools also provide real-time visibility to network activity and identify cybersecurity incidents quickly so that at-risk nodes can be isolated from the rest of the system.
This rapid growth in the use of these tools is driving stakeholder adoption of improved efficiencies and security in their virtual pipeline operations. Great Basin Gas Transmission Company announced that it will be undertaking a significant expansion project in April 2025. With the deployment of AI-based data analytics and monitoring tools. Great Basin will be able to enhance overall operational efficiency and security during this expansion period, further propelling the industry to adopt smarter virtual pipeline solutions.
Market snapshot - (2026-2033)
Global Market Size
USD 8.52 Billion
Largest Segment
Liquefied Natural Gas (LNG)
Fastest Growth
Hydrogen
Growth Rate
9.22% CAGR
To get more insights on this market click here to Request a Free Sample Report
Global virtual pipeline market is segmented by gas type, mode, application, end-user and region. Based on gas type, the market is segmented into Compressed Natural Gas (CNG), Liquefied Natural Gas (LNG) and Hydrogen. Based on mode, the market is segmented into Truck-Based Transport and Rail-Based Transport. Based on application, the market is segmented into Industrial Gas Supply, Power Generation and Remote Area Supply. Based on end-user, the market is segmented into Industrial Manufacturers, Power Plants and Remote Communities. Based on region, the market is segmented into North America, Europe, Asia Pacific, Latin America and Middle East & Africa.
Because CNG is compatible with existing distribution systems for natural gas, its existing compression stations, and existing feeder networks for transporting CNG, it dominates the virtual pipeline market. Additionally, since there is a mature level of technology for handling CNG, operators have less capital risk associated with it, and feedstock for flowing CNG is much easier to obtain, due to the availability of established sources. Operators are able to take advantage of established safety protocols and regulatory experience with CNG, allowing for faster approvals of projects as this serves as an incentive to invest in CNG. Therefore, virtually every market stakeholder considers CNG as the primary means of transporting energy in a virtual pipeline to market.
The LNG market, on the other hand, is experiencing growth at a much faster rate than CNG due to the increasing interest in transporting energy by virtual pipeline over very long distances, as this will increase the need for liquefaction capabilities that can be provided by virtual pipelines through the use of smart devices to monitor performance. Additionally, the ability to store more product using LNG and the need for export-oriented applications are generating many new LNG project pipelines, which creates opportunities for wider geographic market expansion and encourages new business models for providing service to LNG customers.
The Truck Based Transport segment has the greatest growth capacity because it provides routes adaptable to gas source and demand patterns which are key to virtual pipeline solutions depending on modular compression units. Also, mobile delivery removes the need for fixed pipelines along corridors which reduces the right of way needed to install them, enabling quick response to changes in market conditions. The trucking logistics network has the fleet capacity, service capability, and operational efficiency to be the preferred alternative for early stage virtual pipeline implementations.
At the same time, Rail Based Transport segment is experiencing rapid growth as rail corridors provide an amount of capacity that complements virtual pipelines for transportation of bulk hydrogen. In addition, rail systems integrate with existing freight transportation networks to facilitate the transfer of gas, thereby reducing energy consumption; support long-haul transportation routes that are less efficient when done by truck; accelerate geographic expansion into industrial corridor areas; and create entirely new value chain opportunities.
To get detailed segments analysis, Request a Free Sample Report
North America has access to a fully developed digital ecosystem, where advanced analytics for data, cloud computing and cybersecurity are integrated as a cohesive experience. There is a significant amount of collaboration between technology providers and energy companies, which increases the speed at which virtual pipelines can be adopted, as well as an abundance of broadband availability enabling seamless connections between remote locations. In addition, there are numerous skilled labour resources and a regulatory environment that supports innovation as well as cross-border data exchange. Numerous major energy processors are making substantial capital investments in automation and real-time monitoring. This creates a feedback loop that enables continual refinement in both efficiency and reliability of virtual pipelines. With all of these factors in place, North America is recognized globally as the standard for operational performance and leads the world in overall market share for virtual pipelines.
The adoption of virtual pipelines in the USA is driven by significant investment in digital twin technology and predictive analytics that improve the use of existing assets. The largest energy companies place a high priority on the integration of IoT sensors to enable operator access to highly detailed flow information for use in dynamic optimisation across state borders. The collaborative nature of research between academia and industry in the areas of algorithm model development fosters a culture of continuous improvement in the use of algorithms. Finally, there is a pro-active regulatory climate in the USA, which promotes the quick and easy exchange of data, leading to an extremely resilient energy infrastructure that is capable of expanding to meet the growing need for clean energy transport.
The development of Canada Virtual Pipeline Market is centred around utilizing all of the abundant renewable energy sources available through their extensive hydroelectric resources along with the use of sophisticated simulation platforms. This allows for operators to obtain real time visibility of pipeline performance to be able to balance supply variability over the vast sizes of land. Partnerships with indigenous people and technology companies help create localized solutions that provide environmental stewardship. The focus on low carbon initiatives as well as having a supportive policy structure will lead to the use of advanced monitoring tools which will place Canada as a forward-thinking participant in the overall virtual pipeline market.
The expansion of Europe Virtual Pipelines is directly related to a serious effort to decarbonize and to be energy secure thus operators are looking towards virtual pipelines as a viable low carbon alternative to traditional pipeline infrastructure. Europe has a very high density of cross border energy market and encourages harmonized data standards to support smooth information sharing and the joint optimization of operations. The regulatory framework in Europe continues to encourage transparency and provide incentives for digital upgrades while providing a large pool of engineering resources to assist in refining simulation and forecasting tools. The growing demand for sustainable fuels from consumers is leading to a continued increase in the investment into Virtual Pipeline technologies further entrenching Europe as a major growth region within the Virtual Pipeline Market.
Virtual Pipeline Market initiatives in Germany concentrate on integrating renewable gas streams into existing distribution systems through sophisticated modeling tools. Energy firms prioritize high‑resolution monitoring to ensure compliance with stringent emissions targets, while collaborative platforms enable real‑time coordination among multiple stakeholders. The strong engineering heritage and emphasis on precision drive continuous enhancement of predictive maintenance algorithms, supporting reliable operation across complex network topologies.
Virtual Pipeline Market activity in the United Kingdom is characterized by rapid adoption of cloud‑based analytics to manage fluctuating biofuel inputs across the island network. Industry partnerships focus on unlocking data interoperability, allowing swift response to market signals and enhancing supply chain resilience. Government incentives for low‑carbon transport solutions reinforce investment in digital twins, positioning the United Kingdom as a leading arena for accelerated virtual pipeline deployment.
Virtual Pipeline Market efforts in France emphasize the integration of renewable diesel production with digital control systems to streamline logistics. Operators adopt advanced scheduling algorithms that align feedstock availability with processing capacity, reducing waste and improving turnaround times. Collaborative research hubs promote the development of AI‑driven optimization models, supporting France’s emerging role in the virtual pipeline landscape.
Asia Pacific is advancing its virtual pipeline capabilities by capitalizing on rapid digital transformation and expanding renewable energy portfolios. Nations across the region are investing in high‑speed communication infrastructure, enabling real‑time data exchange essential for virtual pipeline coordination. Energy companies adopt machine learning models to predict flow dynamics within heterogeneous supply chains, improving operational agility. Regional trade agreements facilitate cross‑border data sharing, while a focus on technology transfer accelerates skill development among local talent. These strategic moves enhance the region’s capacity to deliver efficient, low‑carbon fuel transport solutions and reinforce its growing influence in the global market.
Virtual Pipeline Market progress in Japan centers on the deployment of sophisticated simulation environments that manage the integration of bio‑derived fuels into a tightly regulated market. Companies prioritize precision monitoring to align with national energy efficiency goals, employing advanced sensor networks that feed into centralized analytics dashboards. Collaborative initiatives between technology firms and energy producers foster continuous refinement of predictive models, ensuring resilient operation amidst fluctuating demand patterns.
Virtual Pipeline Market development in South Korea focuses on harnessing digital platforms to synchronize renewable feedstock flows with high‑capacity refining complexes. Energy operators emphasize real‑time visibility of inventory levels through cloud‑based monitoring solutions, enabling swift adjustments to processing schedules. Government support for smart energy infrastructure encourages the adoption of AI‑driven optimization tools, positioning South Korea as a proactive contributor to the evolving virtual pipeline ecosystem.
To know more about the market opportunities by region and country, click here to
Buy The Complete Report
Rising Demand for Real-Time Data
Expansion of IoT Connectivity
Regulatory Compliance Complexity
High Implementation Cost Barriers
Request Free Customization of this report to help us to meet your business objectives.
The competitive landscape of the global virtual pipeline market is shaped by intense rivalry among established providers and fast‑growing entrants, driving rapid technology upgrades and consolidation. Companies are pursuing M&A to broaden service portfolios, forming joint‑development partnerships to embed AI‑based analytics, and launching cloud‑native platforms to reduce latency and operational costs.
SkyQuest’s ABIRAW (Advanced Business Intelligence, Research & Analysis Wing) is our Business Information Services team that Collects, Collates, Correlates, and Analyses the Data collected by means of Primary Exploratory Research backed by robust Secondary Desk research.
As per SkyQuest analysis, the virtual pipeline market is being propelled by a rising demand for real‑time data that enables faster decision‑making and predictive maintenance, while expanding IoT connectivity further fuels growth by providing flexible, low‑latency channels for sensor streams. The CNG segment leads the market because it can tap existing infrastructure and enjoys regulatory familiarity, and North America remains the dominant region thanks to its mature digital ecosystem and supportive policies. However, the complexity of meeting varied data‑sovereignty and privacy regulations poses a notable restraint, slowing adoption in jurisdictions with stricter compliance requirements. This regulatory hurdle encourages firms to retain legacy solutions until clearer guidelines emerge.
| Report Metric | Details |
|---|---|
| Market size value in 2024 | USD 8.52 Billion |
| Market size value in 2033 | USD 18.85 Billion |
| Growth Rate | 9.22% |
| Base year | 2024 |
| Forecast period | (2026-2033) |
| Forecast Unit (Value) | USD Billion |
| Segments covered |
|
| Regions covered | North America (US, Canada), Europe (Germany, France, United Kingdom, Italy, Spain, Rest of Europe), Asia Pacific (China, India, Japan, Rest of Asia-Pacific), Latin America (Brazil, Rest of Latin America), Middle East & Africa (South Africa, GCC Countries, Rest of MEA) |
| Companies covered |
|
| Customization scope | Free report customization with purchase. Customization includes:-
|
To get a free trial access to our platform which is a one stop solution for all your data requirements for quicker decision making. This platform allows you to compare markets, competitors who are prominent in the market, and mega trends that are influencing the dynamics in the market. Also, get access to detailed SkyQuest exclusive matrix.
Table Of Content
Executive Summary
Market overview
Parent Market Analysis
Market overview
Market size
KEY MARKET INSIGHTS
COVID IMPACT
MARKET DYNAMICS & OUTLOOK
Market Size by Region
KEY COMPANY PROFILES
Methodology
For the Virtual Pipeline Market, our research methodology involved a mixture of primary and secondary data sources. Key steps involved in the research process are listed below:
1. Information Procurement: This stage involved the procurement of Market data or related information via primary and secondary sources. The various secondary sources used included various company websites, annual reports, trade databases, and paid databases such as Hoover's, Bloomberg Business, Factiva, and Avention. Our team did 45 primary interactions Globally which included several stakeholders such as manufacturers, customers, key opinion leaders, etc. Overall, information procurement was one of the most extensive stages in our research process.
2. Information Analysis: This step involved triangulation of data through bottom-up and top-down approaches to estimate and validate the total size and future estimate of the Virtual Pipeline Market.
3. Report Formulation: The final step entailed the placement of data points in appropriate Market spaces in an attempt to deduce viable conclusions.
4. Validation & Publishing: Validation is the most important step in the process. Validation & re-validation via an intricately designed process helped us finalize data points to be used for final calculations. The final Market estimates and forecasts were then aligned and sent to our panel of industry experts for validation of data. Once the validation was done the report was sent to our Quality Assurance team to ensure adherence to style guides, consistency & design.
Analyst Support
Customization Options
With the given market data, our dedicated team of analysts can offer you the following customization options are available for the Virtual Pipeline Market:
Product Analysis: Product matrix, which offers a detailed comparison of the product portfolio of companies.
Regional Analysis: Further analysis of the Virtual Pipeline Market for additional countries.
Competitive Analysis: Detailed analysis and profiling of additional Market players & comparative analysis of competitive products.
Go to Market Strategy: Find the high-growth channels to invest your marketing efforts and increase your customer base.
Innovation Mapping: Identify racial solutions and innovation, connected to deep ecosystems of innovators, start-ups, academics, and strategic partners.
Category Intelligence: Customized intelligence that is relevant to their supply Markets will enable them to make smarter sourcing decisions and improve their category management.
Public Company Transcript Analysis: To improve the investment performance by generating new alpha and making better-informed decisions.
Social Media Listening: To analyze the conversations and trends happening not just around your brand, but around your industry as a whole, and use those insights to make better Marketing decisions.
REQUEST FOR SAMPLE
 REQUEST FREE CUSTOMIZATION
Global Virtual Pipeline Market size was valued at USD 8.52 Billion in 2024 and is poised to grow from USD 9.31 Billion in 2025 to USD 18.85 Billion by 2033, growing at a CAGR of 9.22% during the forecast period (2026-2033).
The competitive landscape of the global virtual pipeline market is shaped by intense rivalry among established providers and fast‑growing entrants, driving rapid technology upgrades and consolidation. Companies are pursuing M&A to broaden service portfolios, forming joint‑development partnerships to embed AI‑based analytics, and launching cloud‑native platforms to reduce latency and operational costs. 'Galileo Technologies', 'Hexagon Composites', 'Broadmark Energy', 'Agility Fuel Solutions', 'Chart Industries', 'Hexagon Lincoln (Hexagon)', 'CIMC ENRIC Holdings', 'Beijing Tianhai Industry', 'Worthington Industries', 'Luxfer Holdings', 'OMC Power', 'Wärtsilä Corporation', 'GreenPower Motor Company', 'Cryostar (Linde)', 'Applied LNG Technologies', 'Stabilis Solutions', 'NGL Energy Partners', 'Stabilis Energy', 'CRYOGAS Equipment', 'Prometheus Energy Group'
Enterprises are increasingly relying on virtual pipelines to transmit operational data securely across dispersed sites, enabling continuous monitoring and rapid decision-making. This capability reduces latency, enhances predictive maintenance, and supports scalable integration of new assets, thereby fostering confidence in digital transformation initiatives. As organizations prioritize agility and resilience, the ability to deploy virtual pipelines without extensive physical infrastructure becomes a compelling advantage, driving broader adoption across sectors seeking efficient data flow and operational optimization. These benefits also encourage collaboration among suppliers and service providers, further expanding the ecosystem.
Digital Twins Integration: Companies are embedding digital twin technology into virtual pipeline platforms to replicate physical infrastructure in real time, enabling proactive maintenance, scenario testing, and capacity planning. By mirroring asset behavior and environmental variables, operators can identify bottlenecks before they impact flow, reduce downtime, and accelerate innovation cycles. This convergence of virtualization and advanced simulation drives collaborative decision‑making across engineering, finance, and regulatory teams, fostering a more resilient and agile energy transport ecosystem while supporting investment strategies worldwide and enhancing stakeholder confidence.
Why does North America Dominate the Global Virtual Pipeline Market? |@12


Want to customize this report? This report can be personalized according to your needs. Our analysts and industry experts will work directly with you to understand your requirements and provide you with customized data in a short amount of time. We offer $1000 worth of FREE customization at the time of purchase.
Feedback From Our Clients


 USA (+1) 351-333-4748

