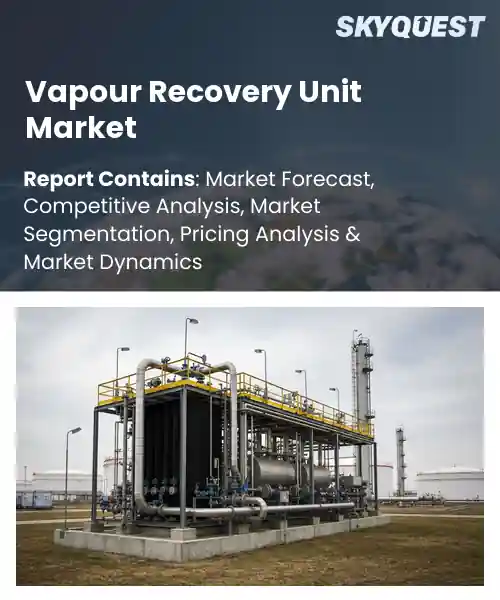
Vapour Recovery Unit Market
Report ID: SQMIG20I3227
Report ID: SQMIG20I3227
[email protected]
USA +1 351-333-4748
Report ID:
SQMIG20I3227 |
Region:
Global |
Published Date: July, 2026
Pages:
157
|Tables:
185
|Figures:
79


Global Vapour Recovery Unit Market size was valued at USD 1.12 Billion in 2024 and is poised to grow from USD 1.18 Billion in 2025 to USD 1.86 Billion by 2033, growing at a CAGR of 5.8% during the forecast period (2026-2033).
The vapour recovery unit (VRU) market is driven by regulations that limit organic compound (VOC) emissions from petroleum storage and handling facilities. As nations adopt policies such as the United States Clean Air Act Amendments and the European Union Industrial Emissions Directive, operators must install VRUs to capture and recycle vapours, converting compliance costs into savings. Historically the market lingered in niche applications during the 1990s, but the 2000s saw adoption after incidents like the 2005 BP Texas City refinery fire highlighted financial and reputational risks of uncontrolled emissions. Today VRUs form a component of refinery, terminal and bulk‑fuel distribution infrastructure, underscoring relevance. The shift toward circular‑economy practices now drives the VRU market as firms treat captured vapours as feedstock, reducing raw‑material purchases and emissions. A Saudi Arabian refinery recently added a cryogenic VRU that feeds recovered hydrocarbons to its aromatics unit, cutting costs by about 7 %. This cause‑and‑effect relationship fuels demand for high‑efficiency designs and opens revenue streams for OEMs, EPC firms, and service providers. At the same time, growing LPG trading hubs in Asia and new renewable‑fuel blending terminals expand the addressable base, prompting investors to fund modular VRU systems that can be installed quickly across diverse sites worldwide, supporting sustainability goals overall industry.
How are AI and IoT technologies shaping the vapour recovery unit market?
Artificial intelligence and the Internet of Things are turning vapor recovery units into smart, self‑optimizing assets. Sensors now feed real‑time pressure, temperature and flow data to cloud platforms where machine‑learning models predict leaks, schedule maintenance and fine‑tune suction rates. This continuous feedback loop reduces fugitive emissions and cuts energy waste while keeping plants compliant with tightening regulations. Operators can view dashboards that visualize performance across multiple sites, enabling quick decisions and remote troubleshooting. The technology also supports predictive analytics that alert crews before a component fails, extending equipment life and improving overall plant efficiency.Honeywell announced an AI‑enabled vapor recovery system in September 2025, demonstrating how connected analytics can boost capture rates and lower operating costs, reinforcing market momentum.
Market snapshot - (2026-2033)
Global Market Size
USD 1.12 Billion
Largest Segment
Compression-Based Units
Fastest Growth
Membrane Separation Units
Growth Rate
5.8% CAGR
To get more insights on this market click here to Request a Free Sample Report
Global vapour recovery unit market is segmented by product system type, process technology, flow rate capacity, installation site environment, core application area, end-use industry and region. Based on product system type, the market is segmented into Compression-Based Units, Ejector Units, Venturi Units, Membrane Separation Units, Condensation Systems, Cryogenic Units and Absorption Carbon Units. Based on process technology, the market is segmented into Adsorption Technology, Absorption Processes, Condensation Methods and Membrane Separation Technology. Based on flow rate capacity, the market is segmented into Below 50 Mscfd, 50 to 200 Mscfd, 200 to 500 Mscfd and Above 500 Mscfd. Based on installation site environment, the market is segmented into Onshore Installation Sites and Offshore Platform Deployments. Based on core application area, the market is segmented into Processing Plants, Storage Tanks, Tanker Loading, Tanker Unloading, Gathering Pipelines and Flaring Gas Recovery. Based on end-use industry, the market is segmented into Upstream Oil Extraction, Upstream Gas Extraction, Downstream Oil Refining, Storage Terminals, Chemical Manufacturing, Petrochemical Plants, Biofuel Production, Pharmaceutical Laboratories and Others. Based on region, the market is segmented into North America, Europe, Asia Pacific, Latin America and Middle East & Africa.
Adsorption Technology segment dominates because it offers high selectivity for volatile organic compounds while operating at relatively low temperatures, which aligns with the stringent emission limits imposed on oil and gas facilities. Its proven reliability and ease of integration with existing infrastructure reduce capital risk, encouraging operators to prioritize it over alternative methods. Moreover, the mature supply chain and extensive field experience reinforce confidence, making it the preferred choice for most vapor recovery installations.
Meanwhile, Membrane Separation Technology emerges as the most rapidly expanding area because advances in polymer science have drastically improved permeance and durability, enabling compact units that fit constrained footprints. Regulatory pressure for zero vent emissions and the appeal of lower energy consumption drive adoption across new midstream projects, unlocking fresh market opportunities.
Processing Plants segment leads because vapor recovery units integrated at refineries and petrochemical complexes capture large volumes of hydrocarbon rich vapors directly from distillation columns, where emission potential is highest. The proximity to high temperature streams enhances condensation efficiency, while the ability to recycle recovered gases into feedstock improves overall plant economics. Operators therefore prioritize installations at processing sites to both satisfy compliance mandates and capture value adding product streams.
On the other hand, Tanker Unloading emerges as the fastest growing focus because growing global trade in liquid hydrocarbons drives higher berth turnover, prompting terminals to adopt compact vapor recovery systems that can be installed on mobile platforms. The ability to capture emissions during both loading and off loading cycles satisfies tightening port regulations and creates revenue streams from recovered gases, accelerating market penetration.
To get detailed segments analysis, Request a Free Sample Report
North America’s dominance stems from a convergence of robust regulatory expectations, advanced industrial infrastructure, and a culture of continuous environmental stewardship. Operators benefit from deep engineering expertise and a supply chain that delivers sophisticated recovery solutions at scale. Significant capital availability enables rapid adoption of next‑generation technologies, while collaborative ecosystems among manufacturers, service providers, and end users accelerate innovation. The region’s emphasis on compliance and operational efficiency reinforces market confidence, creating a self‑reinforcing loop that sustains leadership in vapour recovery applications.
Vapour Recovery Unit Market in the United States is characterized by a well‑established network of refineries and chemical plants that prioritize emission control. Companies benefit from extensive engineering expertise and a supply chain that supports rapid deployment of advanced recovery technologies. The regulatory landscape encourages continuous improvement, prompting operators to adopt best‑in‑class designs. Collaboration between equipment manufacturers, technology providers, and end users fosters innovation that sustains market leadership.
Vapour Recovery Unit Market in Canada is driven by strong environmental policies and a proactive approach to industrial emissions. Energy producers leverage a highly skilled workforce and access to cutting‑edge technology suppliers, ensuring efficient integration of recovery systems. Government incentives encourage adoption of low‑impact solutions, while regional collaboration promotes sharing of best practices. The combination of technical capability and policy support consolidates Canada’s role as a key contributor to North American market strength.
Europe’s rapid expansion is propelled by stringent environmental directives, a mature industrial base, and a collective ambition to lead in sustainable practices. Companies across the continent invest heavily in innovative recovery technologies to meet rigorous emission standards and to enhance operational resilience. Collaborative research initiatives and strong cross‑border supply networks facilitate rapid diffusion of best‑in‑class solutions. The market benefits from a balanced mix of established leaders and emerging entrants, each motivated by regulatory pressure and a shared vision of carbon‑conscious production.
Vapour Recovery Unit Market in Germany reflects a dominant position supported by world‑class engineering and rigorous compliance frameworks. Industry leaders integrate high‑efficiency recovery systems into extensive petrochemical complexes, driven by a culture of precision and sustainability. The nation’s research institutions collaborate closely with manufacturers, fostering continual technological refinement. Robust policy mechanisms ensure that emission reduction remains a core operational priority, solidifying Germany’s influence on European market dynamics.
Vapour Recovery Unit Market in the United Kingdom is marked by the fastest growing momentum, underpinned by ambitious renewable fuel strategies and supportive policy incentives. Operators embrace advanced recovery solutions to align with decarbonisation targets, while a dynamic innovation ecosystem accelerates technology adoption. Collaborative platforms between academia, industry, and government streamline knowledge transfer, nurturing rapid market expansion. The United Kingdom’s proactive stance positions it as a catalyst for broader European advancement.
Vapour Recovery Unit Market in France is emerging as a notable segment, driven by national sustainability initiatives and increasing investment in cleaner production processes. Companies adopt modern recovery technologies to meet evolving regulatory expectations and to improve operational efficiency. Partnerships with technology innovators enable rapid skill development and solution customization. France’s growing emphasis on environmental responsibility fuels a progressive market environment that contributes to the continent’s overall trajectory.
Asia Pacific is strengthening its position through a blend of rapid industrialization, heightened environmental awareness, and strategic investments in advanced recovery technologies. Nations within the region are aligning national policies with global sustainability goals, encouraging the integration of vapour recovery solutions across diverse manufacturing sectors. Growing expertise in engineering and a surge in local manufacturing capabilities reduce reliance on external suppliers, fostering self‑sufficiency. Collaborative regional forums and technology transfer initiatives further accelerate market maturation, positioning Asia Pacific as an increasingly influential player.
Vapour Recovery Unit Market in Japan benefits from a mature industrial landscape and a long‑standing commitment to precision engineering. Companies integrate sophisticated recovery systems to meet exacting environmental standards while maintaining high production efficiency. Close cooperation between manufacturers and research institutions drives continual refinement of technology, ensuring relevance in a competitive market. Strategic policy frameworks reinforce the adoption of low‑emission solutions, supporting Japan’s role as a forward‑thinking contributor to regional growth.
Vapour Recovery Unit Market in South Korea is propelled by a dynamic petrochemical sector and an emphasis on export‑driven growth. Firms adopt cutting‑edge recovery technologies to enhance competitiveness and comply with rigorous environmental regulations. Strong governmental support encourages investment in clean‑tech infrastructure, while a skilled engineering workforce accelerates implementation. The synergy of policy direction and industry ambition reinforces South Korea’s emerging influence within the Asia Pacific market landscape.
To know more about the market opportunities by region and country, click here to
Buy The Complete Report
Increasing Environmental Regulations
Regulatory bodies worldwide are tightening emission standards for volatile organic compounds, prompting manufacturers to adopt vapour recovery units to ensure compliance. This pressure drives investment in advanced recovery technologies as companies seek to avoid penalties and maintain operational licenses. Consequently, demand for reliable and efficient VRUs rises, encouraging suppliers to expand product portfolios and support services, thereby accelerating market growth across industrial sectors. The heightened focus on sustainability also influences corporate strategies, making VRU adoption a key component of environmental stewardship programs.
Rising Demand for Process Efficiency
Industrial operators are increasingly prioritizing process efficiency to reduce material loss and improve profitability, and vapour recovery units provide a direct method for capturing valuable hydrocarbons that would otherwise be vented. By integrating VRUs into existing systems, facilities can reclaim product, lower energy consumption, and streamline operations, creating a competitive advantage. This efficiency orientation encourages capital allocation toward recovery solutions, fostering market expansion as more plants adopt the technology to meet both economic and operational objectives. Additionally, improved safety outcomes result from reduced volatile releases, further justifying investment.
High Capital Expenditure Costs
Implementation of vapour recovery units often requires substantial upfront investment for equipment purchase, installation, and integration with existing infrastructure. For many small and medium enterprises, these costs represent a significant financial barrier that can delay or deter adoption, especially when immediate return on investment is uncertain. Consequently, budget constraints limit market penetration, as firms prioritize core operational spending over the optional addition of recovery technology, slowing overall market growth. Furthermore, limited access to financing options and uncertainty about regulatory timelines can exacerbate hesitation among potential buyers.
Complex Integration Challenges
Integrating vapour recovery units into diverse process streams often involves complex engineering modifications, which can disrupt existing operations and require specialized expertise. The need to balance process continuity with retrofit activities creates scheduling difficulties and potential downtime, discouraging firms from undertaking upgrades. Additionally, variations in plant design and equipment compatibility necessitate customized solutions, increasing project timelines and uncertainty. These integration challenges raise perceived risk, leading organizations to postpone or abandon VRU implementation, thereby impeding market expansion. Regulatory approvals for modifications can further prolong the process, adding to project complexity.
Request Free Customization of this report to help us to meet your business objectives.
The competitive landscape is shaped by intense rivalry as firms chase regulatory incentives and cost‑saving mandates, prompting a wave of joint ventures that embed advanced sensor and control technologies into vapor recovery units. Recent activity includes multiple acquisitions of niche engineering specialists to broaden service portfolios and accelerate product innovation, while strategic partnerships with fuel distributors aim to standardize retrofit solutions across regional markets.
Top Player’s Company Profile
Recent Developments
SkyQuest’s ABIRAW (Advanced Business Intelligence, Research & Analysis Wing) is our Business Information Services team that Collects, Collates, Correlates, and Analyses the Data collected by means of Primary Exploratory Research backed by robust Secondary Desk research. As per SkyQuest analysis, the vapour recovery unit market is being propelled primarily by tightening environmental regulations that force operators to capture volatile organic compounds, while a second strong catalyst is the growing focus on process efficiency and circular‑economy benefits that turn recovered vapour into valuable feedstock. The most pronounced barrier remains the high upfront capital outlay required for equipment purchase and integration, which can deter smaller players. North America continues to dominate the market thanks to its stringent policies and mature supply chain, and within the product space the adsorption technology segment leads because of its proven selectivity, low‑temperature operation and ease of retrofit.
| Report Metric | Details |
|---|---|
| Market size value in 2024 | USD 1.12 Billion |
| Market size value in 2033 | USD 1.86 Billion |
| Growth Rate | 5.8% |
| Base year | 2024 |
| Forecast period | (2026-2033) |
| Forecast Unit (Value) | USD Billion |
| Segments covered |
|
| Regions covered | North America (US, Canada), Europe (Germany, France, United Kingdom, Italy, Spain, Rest of Europe), Asia Pacific (China, India, Japan, Rest of Asia-Pacific), Latin America (Brazil, Rest of Latin America), Middle East & Africa (South Africa, GCC Countries, Rest of MEA) |
| Companies covered |
|
| Customization scope | Free report customization with purchase. Customization includes:-
|
To get a free trial access to our platform which is a one stop solution for all your data requirements for quicker decision making. This platform allows you to compare markets, competitors who are prominent in the market, and mega trends that are influencing the dynamics in the market. Also, get access to detailed SkyQuest exclusive matrix.
Table Of Content
Executive Summary
Market overview
Parent Market Analysis
Market overview
Market size
KEY MARKET INSIGHTS
COVID IMPACT
MARKET DYNAMICS & OUTLOOK
Market Size by Region
KEY COMPANY PROFILES
Methodology
For the Vapour Recovery Unit Market, our research methodology involved a mixture of primary and secondary data sources. Key steps involved in the research process are listed below:
1. Information Procurement: This stage involved the procurement of Market data or related information via primary and secondary sources. The various secondary sources used included various company websites, annual reports, trade databases, and paid databases such as Hoover's, Bloomberg Business, Factiva, and Avention. Our team did 45 primary interactions Globally which included several stakeholders such as manufacturers, customers, key opinion leaders, etc. Overall, information procurement was one of the most extensive stages in our research process.
2. Information Analysis: This step involved triangulation of data through bottom-up and top-down approaches to estimate and validate the total size and future estimate of the Vapour Recovery Unit Market.
3. Report Formulation: The final step entailed the placement of data points in appropriate Market spaces in an attempt to deduce viable conclusions.
4. Validation & Publishing: Validation is the most important step in the process. Validation & re-validation via an intricately designed process helped us finalize data points to be used for final calculations. The final Market estimates and forecasts were then aligned and sent to our panel of industry experts for validation of data. Once the validation was done the report was sent to our Quality Assurance team to ensure adherence to style guides, consistency & design.
Analyst Support
Customization Options
With the given market data, our dedicated team of analysts can offer you the following customization options are available for the Vapour Recovery Unit Market:
Product Analysis: Product matrix, which offers a detailed comparison of the product portfolio of companies.
Regional Analysis: Further analysis of the Vapour Recovery Unit Market for additional countries.
Competitive Analysis: Detailed analysis and profiling of additional Market players & comparative analysis of competitive products.
Go to Market Strategy: Find the high-growth channels to invest your marketing efforts and increase your customer base.
Innovation Mapping: Identify racial solutions and innovation, connected to deep ecosystems of innovators, start-ups, academics, and strategic partners.
Category Intelligence: Customized intelligence that is relevant to their supply Markets will enable them to make smarter sourcing decisions and improve their category management.
Public Company Transcript Analysis: To improve the investment performance by generating new alpha and making better-informed decisions.
Social Media Listening: To analyze the conversations and trends happening not just around your brand, but around your industry as a whole, and use those insights to make better Marketing decisions.
REQUEST FOR SAMPLE
 REQUEST FREE CUSTOMIZATION


Want to customize this report? This report can be personalized according to your needs. Our analysts and industry experts will work directly with you to understand your requirements and provide you with customized data in a short amount of time. We offer $1000 worth of FREE customization at the time of purchase.
Feedback From Our Clients


 USA (+1) 351-333-4748

