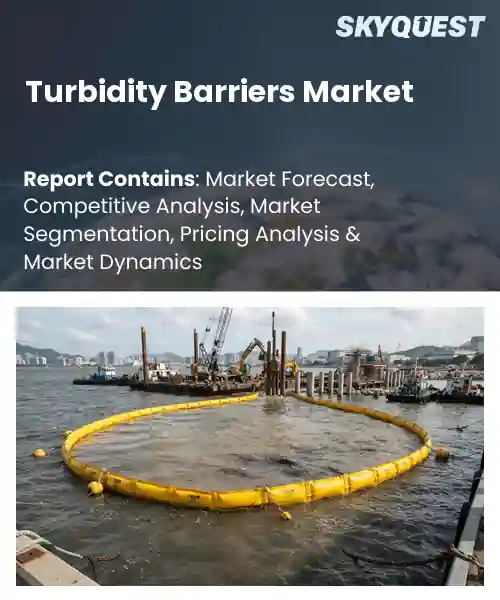
Turbidity Barriers Market
Report ID: SQMIG20L2119
Report ID: SQMIG20L2119
[email protected]
USA +1 351-333-4748
Report ID:
SQMIG20L2119 |
Region:
Global |
Published Date: August, 2026
Pages:
157
|Tables:
121
|Figures:
77


Global Turbidity Barriers Market size was valued at USD 692.0 Million in 2024 and is poised to grow from USD 743.9 Million in 2025 to USD 1326.73 Million by 2033, growing at a CAGR of 7.5% during the forecast period (2026-2033).
The global turbidity barriers market revolves around structures and filtration systems that capture suspended solids, sediments, and pollutants from runoff before they enter waterways. Its significance stems from the growing demand for clean water, stricter environmental regulations, and heightened awareness of ecosystem degradation. Historically, the market was limited to simple silt fences used in construction sites, but the 2000s saw the introduction of modular geotextile panels and polymer‑based mats that offer retention efficiency. This evolution was driven chiefly by tighter discharge standards in the United States and the European Union, which forced municipalities and developers to adopt reliable barrier solutions. Coupled with regulatory pressure, the surge in infrastructure resilience projects has become the next catalyst propelling market expansion, because governments now prioritize flood‑mitigation and climate‑adaptation in urban planning. Cities such as Rotterdam and Singapore have integrated turbidity barriers into storm‑water networks, demonstrating how these systems can simultaneously reduce downstream sediment loads and protect transport arteries during heavy rains. The resulting performance data have encouraged private developers to specify barriers in residential complexes, creating a loop where proven efficacy attracts investment. Consequently, manufacturers are accelerating product innovation, focusing on composites and sensor‑enabled monitoring, which opens revenue streams and broadens the market.
How is AI-driven automation impacting the turbidity barriers
AI-driven automation is reshaping turbidity barrier solutions by integrating sensor networks, real‑time data analytics, and adaptive control systems. Modern barriers now embed optical turbidity sensors that continuously monitor water clarity, feeding data into machine‑learning models that predict sediment loads and adjust barrier tension or positioning automatically. This reduces manual oversight, shortens response times to changing river conditions, and extends the lifespan of barrier fabrics by preventing over‑stress. Operators benefit from dashboards that visualize trends, enabling proactive maintenance scheduling and resource optimization. As construction and environmental projects demand higher efficiency, these intelligent barriers are becoming a preferred choice for sustainable site management.
Market snapshot - (2026-2033)
Global Market Size
USD 692.0 Million
Largest Segment
Type I Turbidity Barriers
Fastest Growth
Type IV Turbidity Barriers
Growth Rate
7.5% CAGR
To get more insights on this market click here to Request a Free Sample Report
Global turbidity barriers market is segmented by product type, material, application, end user and region. Based on product type, the market is segmented into Type I Turbidity Barriers, Type II Turbidity Barriers, Type III Turbidity Barriers and Type IV Turbidity Barriers. Based on material, the market is segmented into PVC, Geotextile Fabric, Polypropylene and Others. Based on application, the market is segmented into Marine Construction, Dredging, Shoreline Protection and Environmental Remediation. Based on end user, the market is segmented into Construction Companies, Environmental Contractors, Government Agencies and Ports & Harbor Authorities. Based on region, the market is segmented into North America, Europe, Asia Pacific, Latin America and Middle East & Africa.
Type I Turbidity Barriers segment leads because its simple modular design aligns with the rapid deployment needs of marine construction projects, allowing contractors to install containment systems quickly and securely. The ease of assembly reduces labor intensity, while its proven reliability under high silt loads builds confidence among engineers. Consequently, project specifications frequently prioritize this type, reinforcing its central position in market purchasing decisions and long-term maintenance benefits for owners.
Meanwhile, Type III Turbidity Barriers segment emerges as the fastest growing because innovative composite cores provide superior filtration efficiency while remaining lightweight, enabling deployment in shoreline protection zones. Increased regulatory focus on sediment control spurs interest, and manufacturers are launching variants that address niche environmental remediation challenges, thereby expanding market reach.
PVC segment dominates because its chemical resistance and durability make it ideally suited for prolonged exposure to saline and abrasive water conditions encountered in dredging operations. The material’s inherent flexibility simplifies installation over uneven seabeds, while its low maintenance profile reduces lifecycle costs for contractors. These attributes translate into strong specification preferences, positioning PVC as the material of choice for large scale turbidity barrier projects across multiple stakeholder groups worldwide.
On the other hand, Polypropylene segment is witnessing the strongest growth momentum because its lightweight nature combined with high tensile strength enables rapid deployment of barriers without extensive anchoring. Emerging green construction standards favor recyclable polymers, and R&D delivers UV stabilized grades that extend service life, attracting new users in environmental remediation projects.
To get detailed segments analysis, Request a Free Sample Report
Asia Pacific leads the global Turbidity Barriers market due to a confluence of advanced manufacturing capabilities, strong demand from water treatment projects, and supportive regulatory environments. The region benefits from a deep pool of engineering talent and a tradition of innovation in polymer and membrane technologies, enabling rapid development of high‑performance barrier solutions. Strategic investments by both public and private sectors have accelerated deployment in industrial, municipal and environmental applications. Close integration between component suppliers and end‑user industries fosters a responsive supply chain that can adapt to evolving performance requirements. Moreover, collaborative research initiatives across academic institutions and industry accelerate product refinement, reinforcing the region’s leadership position.
Turbidity Barriers Market in Japan is shaped by a mature industrial base and a strong emphasis on environmental compliance. Domestic manufacturers leverage precision engineering to produce barrier systems that meet stringent quality standards. Close cooperation with utility providers and municipal agencies drives adoption in water treatment facilities. Ongoing research collaborations with universities advance material science, supporting continuous improvement of barrier performance for diverse applications.
Turbidity Barriers Market in South Korea benefits from a vibrant high‑tech sector and proactive government policies aimed at water quality enhancement. Local firms integrate cutting‑edge nanomaterials into barrier designs, improving efficiency and durability. Partnerships between research institutes and commercial enterprises accelerate technology transfer, while strong demand from petrochemical and offshore industries expands market reach. Emphasis on sustainable production methods further strengthens the country’s competitive edge in the regional landscape.
North America experiences rapid expansion of the Turbidity Barriers market driven by heightened environmental scrutiny, significant infrastructure renewal programs, and robust innovation ecosystems. Stringent water quality regulations compel municipalities and industrial operators to adopt advanced barrier solutions. Substantial capital allocation toward modernizing treatment facilities creates a fertile environment for technology adoption. Collaborative ventures between research laboratories and equipment manufacturers foster the development of next‑generation materials that enhance barrier efficiency. Additionally, growing awareness of climate resilience encourages investment in adaptable systems capable of handling variable water conditions, positioning the region for sustained growth.
Turbidity Barriers Market in the United States is propelled by extensive public‑private collaborations that target legacy system upgrades and emerging water safety challenges. Leading engineering firms apply sophisticated modeling techniques to customize barrier configurations for diverse regulatory contexts. Strong demand from industrial sectors such as mining and energy underscores the need for resilient filtration solutions. Continuous funding for research in advanced polymers fuels product innovation, while a broad network of distribution channels ensures rapid market penetration across multiple states.
Turbidity Barriers Market in Canada reflects a proactive approach to protecting abundant freshwater resources through stringent provincial standards. Early adoption of barrier technologies by municipal utilities highlights a commitment to long‑term water quality assurance. Domestic manufacturers focus on energy‑efficient designs that align with national sustainability goals. Collaborative programs between academic centers and industry accelerate the development of environmentally friendly barrier materials, reinforcing Canada’s reputation as a forward‑looking player in the North American market.
Europe strengthens its position in the Turbidity Barriers market by leveraging a cohesive regulatory framework, deep expertise in material science, and a strong emphasis on circular economy principles. Unified environmental directives encourage consistent adoption of high‑performance barrier solutions across member states. Collaborative research clusters headquartered in leading industrial hubs drive breakthroughs in sustainable polymer composites, enhancing barrier longevity and recyclability. Investment in digital monitoring and predictive maintenance tools optimizes operational efficiency for water treatment operators. Together, these elements cultivate a robust ecosystem that elevates Europe’s competitive standing on the global stage.
Turbidity Barriers Market in Germany is anchored by a legacy of precision engineering and rigorous quality assurance practices. Leading manufacturers integrate advanced manufacturing automation to produce barrier components with exceptional consistency. Close ties with research institutes foster continuous material innovation, emphasizing durability and environmental compatibility. Strong demand from the chemical processing sector reinforces the market’s resilience, while adherence to stringent EU water directives drives broader implementation across municipal treatment facilities.
Turbidity Barriers Market in the United Kingdom benefits from a strategic focus on infrastructure renewal and climate adaptation initiatives. Government funding programs prioritize the modernization of aging water networks, creating avenues for barrier technology deployment. Collaboration between universities and industry accelerates the development of novel filtration membranes tailored to local water characteristics. Growing awareness of water scarcity issues further motivates investment in efficient barrier solutions across both public and private sectors.
Turbidity Barriers Market in France is shaped by a proactive regulatory environment that emphasizes water quality and environmental stewardship. Domestic firms specialize in integrating barrier systems with renewable energy sources, aligning with national sustainability targets. Partnerships with research laboratories enhance the development of bio‑based barrier materials that reduce ecological impact. Strong demand from agricultural and industrial users drives diversification of application settings, reinforcing France’s role as a key contributor to the European market.
To know more about the market opportunities by region and country, click here to
Buy The Complete Report
Increasing Adoption Of Turbidity Solutions
Leveraging Digital Monitoring Technologies
High Initial Capital Expenditure
Regulatory Uncertainty Across Regions
Request Free Customization of this report to help us to meet your business objectives.
The turbidity barriers market is shaped by intense rivalry among established firms such as Triton Environmental, ACME Environmental, Elastec Inc., GEI Works, ABASCO LLC, Ecocoast and Yulex, each leveraging automation investments, domestic supplier diversification and compliance‑driven product upgrades; recent moves include strategic partnerships to integrate sensor‑based monitoring and joint R&D projects that accelerate eco‑friendly barrier materials, underscoring technology‑centric competition as a primary market driver.
Top Player’s Company Profile
Recent Developments
SkyQuest’s ABIRAW (Advanced Business Intelligence, Research & Analysis Wing) is our Business Information Services team that Collects, Collates, Correlates, and Analyses the Data collected by means of Primary Exploratory Research backed by robust Secondary Desk research. As per SkyQuest analysis, the global turbidity barriers market is being propelled primarily by the growing focus on water quality, which pushes industrial and municipal projects to adopt advanced barrier solutions, and a second catalyst is the rise of digital monitoring and AI‑driven automation that enables real‑time turbidity tracking and predictive maintenance. The main restraint is the high upfront capital required for installation, which can delay adoption especially in cash‑constrained programs. Asia Pacific leads the market thanks to strong manufacturing capacity and supportive regulations, while Type I turbidity barriers dominate the product landscape because of their modular design and quick deployment benefits. Together these forces shape the market’s growth trajectory.
| Report Metric | Details |
|---|---|
| Market size value in 2024 | USD 692.0 Million |
| Market size value in 2033 | USD 1326.73 Million |
| Growth Rate | 7.5% |
| Base year | 2024 |
| Forecast period | (2026-2033) |
| Forecast Unit (Value) | USD Million |
| Segments covered |
|
| Regions covered | North America (US, Canada), Europe (Germany, France, United Kingdom, Italy, Spain, Rest of Europe), Asia Pacific (China, India, Japan, Rest of Asia-Pacific), Latin America (Brazil, Rest of Latin America), Middle East & Africa (South Africa, GCC Countries, Rest of MEA) |
| Companies covered |
|
| Customization scope | Free report customization with purchase. Customization includes:-
|
To get a free trial access to our platform which is a one stop solution for all your data requirements for quicker decision making. This platform allows you to compare markets, competitors who are prominent in the market, and mega trends that are influencing the dynamics in the market. Also, get access to detailed SkyQuest exclusive matrix.
Table Of Content
Executive Summary
Market overview
Parent Market Analysis
Market overview
Market size
KEY MARKET INSIGHTS
COVID IMPACT
MARKET DYNAMICS & OUTLOOK
Market Size by Region
KEY COMPANY PROFILES
Methodology
For the Turbidity Barriers Market, our research methodology involved a mixture of primary and secondary data sources. Key steps involved in the research process are listed below:
1. Information Procurement: This stage involved the procurement of Market data or related information via primary and secondary sources. The various secondary sources used included various company websites, annual reports, trade databases, and paid databases such as Hoover's, Bloomberg Business, Factiva, and Avention. Our team did 45 primary interactions Globally which included several stakeholders such as manufacturers, customers, key opinion leaders, etc. Overall, information procurement was one of the most extensive stages in our research process.
2. Information Analysis: This step involved triangulation of data through bottom-up and top-down approaches to estimate and validate the total size and future estimate of the Turbidity Barriers Market.
3. Report Formulation: The final step entailed the placement of data points in appropriate Market spaces in an attempt to deduce viable conclusions.
4. Validation & Publishing: Validation is the most important step in the process. Validation & re-validation via an intricately designed process helped us finalize data points to be used for final calculations. The final Market estimates and forecasts were then aligned and sent to our panel of industry experts for validation of data. Once the validation was done the report was sent to our Quality Assurance team to ensure adherence to style guides, consistency & design.
Analyst Support
Customization Options
With the given market data, our dedicated team of analysts can offer you the following customization options are available for the Turbidity Barriers Market:
Product Analysis: Product matrix, which offers a detailed comparison of the product portfolio of companies.
Regional Analysis: Further analysis of the Turbidity Barriers Market for additional countries.
Competitive Analysis: Detailed analysis and profiling of additional Market players & comparative analysis of competitive products.
Go to Market Strategy: Find the high-growth channels to invest your marketing efforts and increase your customer base.
Innovation Mapping: Identify racial solutions and innovation, connected to deep ecosystems of innovators, start-ups, academics, and strategic partners.
Category Intelligence: Customized intelligence that is relevant to their supply Markets will enable them to make smarter sourcing decisions and improve their category management.
Public Company Transcript Analysis: To improve the investment performance by generating new alpha and making better-informed decisions.
Social Media Listening: To analyze the conversations and trends happening not just around your brand, but around your industry as a whole, and use those insights to make better Marketing decisions.
REQUEST FOR SAMPLE
 REQUEST FREE CUSTOMIZATION


Want to customize this report? This report can be personalized according to your needs. Our analysts and industry experts will work directly with you to understand your requirements and provide you with customized data in a short amount of time. We offer $1000 worth of FREE customization at the time of purchase.
Feedback From Our Clients


 USA (+1) 351-333-4748

