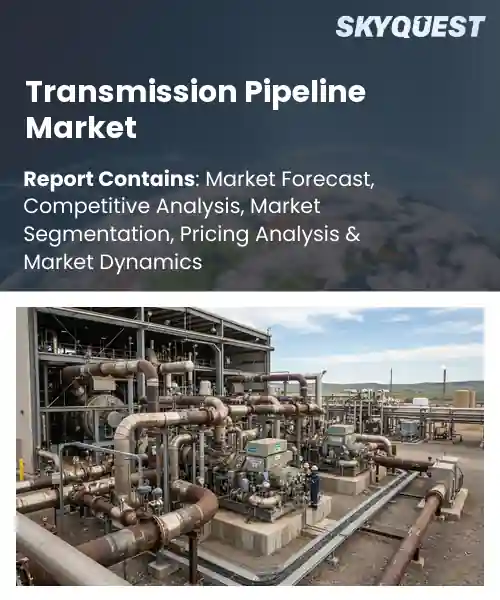
Transmission Pipeline Market
Report ID: SQMIG10F2057
Report ID: SQMIG10F2057
[email protected]
USA +1 351-333-4748
Report ID:
SQMIG10F2057 |
Region:
Global |
Published Date: October, 2026
Pages:
157
|Tables:
147
|Figures:
78


Global Transmission Pipeline Market size was valued at USD 22.5 Billion in 2024 and is poised to grow from USD 23.45 Billion in 2025 to USD 32.59 Billion by 2033, growing at a CAGR of 4.2% during the forecast period (2026-2033).
The global transmission pipeline market includes construction and operation of lines that move crude oil, natural gas, and refined products from production fields to distribution hubs. Its importance lies in delivering energy, cutting transport costs, and lowering emissions versus road or rail. The primary driver today is the surge in natural‑gas consumption, fueled by shift to cleaner fuels and expansion of shale‑gas production in North America. Historically, pipelines grew after World War II, accelerated during the 1970s oil crises, and expanded in 2000s as LNG trade and projects Europe’s Nord Stream and China’s West‑East Gas Pipeline emerged, turning networks into a backbone. Building on that foundation, the key factor driving the global transmission pipeline market is the adoption of monitoring and advanced materials, which raise capacity, safety, and compliance. Sensors let operators detect leaks instantly, cutting downtime and environmental penalties; this reliability draws investors seeking returns, prompting capital for routes. The U.S. Permian Basin pipeline network uses fiber‑optic leak detection, boosting throughput by 15 % while lowering incident costs. Meanwhile, economies such as India invest in composite‑pipe technology to cross difficult terrain, unlocking access to untapped gas fields and creating export corridors. These advances lower operating expenses, encouraging infrastructure expansion and market growth.
How is AI-driven automation improving safety in the transmission pipeline market?
AI driven automation is reshaping safety in the transmission pipeline market by turning raw sensor data into actionable insights. Advanced algorithms continuously analyze pressure, temperature and vibration signals, spotting anomalies before they become leaks. Predictive models forecast corrosion hotspots, allowing crews to intervene during planned maintenance windows. Integrated control systems can automatically isolate compromised sections, reducing exposure to downstream communities. Drone based visual inspections feed high resolution imagery into machine learning classifiers that highlight potential damage. Together these tools create a layered defense that lowers human error, shortens response times and builds confidence among regulators and investors.February 2024, Enbridge introduced an AI driven monitoring system that ingests sensor streams across its natural gas transmission network and alerts operators to pressure deviations and corrosion trends. The rollout has accelerated proactive maintenance, reinforcing pipeline integrity and supporting continued expansion of the market overall and strengthening the broader industry.
Market snapshot - (2026-2033)
Global Market Size
USD 22.5 Billion
Largest Segment
Natural Gas Transmission Pipelines
Fastest Growth
Other Transmission Pipelines
Growth Rate
4.2% CAGR
To get more insights on this market click here to Request a Free Sample Report
Global transmission pipeline market is segmented by pipeline type, pipeline material, pipeline diameter, service type, end user and region. Based on pipeline type, the market is segmented into Oil Transmission Pipelines, Natural Gas Transmission Pipelines, Refined Petroleum Product Pipelines and Other Transmission Pipelines. Based on pipeline material, the market is segmented into Carbon Steel, Stainless Steel & Alloy Steel and Other Materials. Based on pipeline diameter, the market is segmented into Small-Diameter Pipelines, Medium-Diameter Pipelines and Large-Diameter Pipelines. Based on service type, the market is segmented into Pipeline Construction, Pipeline Inspection & Maintenance, Pipeline Replacement & Rehabilitation and Pipeline Monitoring & Leak Detection. Based on end user, the market is segmented into Oil & Gas Companies, Pipeline Operators, Midstream Infrastructure Companies and Government-Owned Energy Enterprises. Based on region, the market is segmented into North America, Europe, Asia Pacific, Latin America and Middle East & Africa.
Carbon steel segment dominates because it offers the most cost‑effective solution for long‑haul transmission lines, leveraging abundant raw material supplies and a mature fabrication ecosystem. Its proven mechanical strength and well‑understood welding procedures give operators confidence in reliability and safety, while regulatory frameworks historically favor its use for high‑pressure applications. These advantages drive widespread adoption across new and existing pipeline projects, cementing its leadership in the market.
However, stainless steel & alloy steel segment is witnessing the strongest growth because emphasis on corrosion resistance and longer asset life prompts operators to select higher‑grade alloys for new and retrofit projects. Emerging standards for harsh environments and rising demand for low‑emission operations accelerate investment, positioning this material class as a key catalyst for market expansion.
Pipeline construction segment dominates because expanding energy demand and aging infrastructure create continuous need for new corridors and capacity upgrades. Operators prioritize building projects to secure supply routes, and investors view construction contracts as stable revenue streams given long‑term take‑or‑pay agreements. The combination of regulatory encouragement for network expansion and the relative ease of securing financing consolidates construction as the leading service in the market.
However, pipeline monitoring & leak detection segment is emerging as the key high‑growth area because digital transformation and stricter environmental regulations compel operators to adopt integrity solutions. Advances in sensor technology, data analytics, and algorithms enable earlier issue identification, reducing downtime and liability. This momentum fuels investment, making monitoring a pivotal driver of future market expansion.
To get detailed segments analysis, Request a Free Sample Report
North America leads the global transmission pipeline market due to a mature infrastructure network, strong engineering expertise, and sustained investment in high‑capacity corridors. The region benefits from integrated energy policies that encourage the development of long‑distance pipelines for both conventional and emerging fuels. Robust regulatory frameworks provide clarity and predictability, attracting multinational operators and technology providers. Access to abundant natural resources and a diversified energy mix fuels demand for efficient transport solutions. Advanced monitoring and safety systems, supported by research institutions, enhance operational reliability. Collaborative initiatives between government agencies and industry stakeholders further reinforce the region’s ability to scale projects quickly, maintaining its position at the forefront of market activity. The presence of major energy corporations and a skilled workforce also contributes to continuous innovation and cost‑effective project delivery.
Transmission Pipeline Market in the United States benefits from a network that interconnects industrial regions with gas fields and renewable energy hubs. Initiatives focus on integrating hydrogen‑ready corridors and repurposing legacy assets for gas transport. Collaboration between federal agencies and operators streamlines permitting, while a focus on renewable fuel corridors expands versatility. The depth of engineering talent and a culture of innovation sustain leadership in pipeline design and operation.
Transmission Pipeline Market in Canada leverages a geographic span that connects western provinces with eastern markets. Emphasis on environmental stewardship drives the adoption of construction methods and monitoring systems. Collaborative frameworks between provincial regulators and industry facilitate project approvals. Investment in corrosion‑resistant materials and advanced integrity management enhances reliability. A skilled workforce and strong research partnerships underpin improvement and position Canada as a key contributor to North American pipeline capacity.
Europe experiences rapid expansion of the transmission pipeline market as nations pursue integrated energy strategies that prioritize security, decarbonization, and cross‑border connectivity. Harmonized regulatory frameworks across the bloc reduce barriers and encourage collaborative projects that link production zones with emerging demand centers. Strong policy incentives support the development of pipelines capable of transporting renewable gases, hydrogen, and bio‑fuels, aligning infrastructure with climate objectives. Advanced digital monitoring and predictive maintenance tools improve operational efficiency and safety, attracting both legacy operators and new entrants. Significant public‑private partnerships fund modernization of aging corridors while enabling the construction of new high‑capacity routes. The region’s emphasis on technological innovation and sustainable practices positions Europe as a leading arena for next‑generation transmission solutions. These developments reinforce Europe’s role in the global energy landscape.
Transmission Pipeline Market in Germany is anchored by a network that interconnects industrial regions with gas fields and renewable energy hubs. The country’s commitment to hydrogen readiness drives retrofitting of existing corridors and construction of pipelines. Collaboration between federal ministries, utilities, and research institutes accelerates adoption of digital twins and advanced leak detection. A skilled engineering workforce and financing mechanisms ensure that Germany remains a benchmark for pipeline operations.
Transmission Pipeline Market in the United Kingdom is growing as nation expands gas transmission capacity to support decarbonization. Initiatives focus on integrating hydrogen‑ready corridors and repurposing legacy assets for gas transport. Coordination between regulator, pipeline operators, and wind developers enables interconnection of sources. Investment in sensors and analytics enhances safety and efficiency. United Kingdom policy framework and talent drive execution and position market as a leading example of pipeline development.
Transmission Pipeline Market in France is emerging as the country aligns infrastructure with European climate goals and demand for low‑carbon fuels. Plans emphasize pipelines for renewable natural gas and hydrogen, often by retrofitting corridors. Collaboration between national regulators, utilities, and research institutions drives adoption of digital monitoring and predictive maintenance. Investment in cross‑border interconnectors enhances integration with neighboring markets, supporting France’s role in a resilient and sustainable European energy network.
Asia Pacific is strengthening its position in the transmission pipeline market through a combination of rising energy demand, proactive policy support, and rapid adoption of advanced technologies. Countries in the region are expanding pipeline networks to connect offshore production hubs with rapidly growing inland consumption centers, facilitating the movement of both conventional hydrocarbons and emerging low‑carbon gases. Government initiatives encourage the development of hydrogen‑compatible corridors and the integration of digital monitoring systems that improve safety and operational efficiency. Growing collaboration between multinational engineering firms and local operators accelerates knowledge transfer and the deployment of cost‑effective construction methods. The region’s focus on sustainability, coupled with strategic investments in cross‑border interconnectivity, positions Asia Pacific as a dynamic and increasingly influential player in the global transmission pipeline landscape.
Transmission Pipeline Market in Japan is characterized by a mature network that links offshore LNG terminals with industrial zones. Emphasis on safety and reliability drives adoption of monitoring technologies and inspection regimes. Government policies promote integration of hydrogen and renewable gas pipelines, encouraging retrofitting of existing assets. Collaboration between utilities and technology providers accelerates deployment of advanced digital twins and AI‑based predictive maintenance, reinforcing Japan’s reputation for robust pipeline infrastructure.
Transmission Pipeline Market in South Korea is evolving to support the transition toward energy carriers and import reliance. Initiatives focus on expanding pipelines that convey petroleum products and hydrogen blends from coastal terminals to inland demand centers. Government‑industry collaboration encourages adoption of smart sensors and data analytics to enhance safety and efficiency. Investment in modular construction and manufacturing reduces project timelines, positioning South Korea as a market for transmission infrastructure.
To know more about the market opportunities by region and country, click here to
Buy The Complete Report
Rising Global Energy Consumption
Policy Support for Low‑Carbon Transition
High Capital Expenditure Requirements
Regulatory and Permitting Delays
Request Free Customization of this report to help us to meet your business objectives.
The competitive landscape of the Global Transmission Pipeline Market is shaped by aggressive M&A activity, strategic joint ventures, and rapid adoption of digital monitoring technologies; recent consolidation such as the acquisition of a mid‑size regional operator by a major infrastructure player has intensified capacity competition, while partnerships between pipeline owners and technology firms are accelerating the rollout of smart‑sensor networks and predictive maintenance platforms to reduce downtime and regulatory risk.
Top Player’s Company Profile
Recent Developments
SkyQuest’s ABIRAW (Advanced Business Intelligence, Research & Analysis Wing) is our Business Information Services team that Collects, Collates, Correlates, and Analyses the Data collected by means of Primary Exploratory Research backed by robust Secondary Desk research. As per SkyQuest analysis, the global transmission pipeline market is set to expand from $23.45 billion in 2025 to $32.59 billion by 2033, driven primarily by rising global energy consumption that pushes investors toward new long‑haul corridors. A second catalyst is strong policy support for low‑carbon transition, encouraging pipelines that can carry hydrogen and renewable gases. The carbon‑steel segment remains the dominant material choice because of its cost‑effectiveness and mature supply chain, while North America continues to lead the market thanks to its extensive infrastructure and stable regulatory environment. However, the high capital outlay required for construction and the lengthy permitting process act as significant restraints on faster growth.
| Report Metric | Details |
|---|---|
| Market size value in 2024 | USD 22.5 Billion |
| Market size value in 2033 | USD 32.59 Billion |
| Growth Rate | 4.2% |
| Base year | 2024 |
| Forecast period | (2026-2033) |
| Forecast Unit (Value) | USD Billion |
| Segments covered |
|
| Regions covered | North America (US, Canada), Europe (Germany, France, United Kingdom, Italy, Spain, Rest of Europe), Asia Pacific (China, India, Japan, Rest of Asia-Pacific), Latin America (Brazil, Rest of Latin America), Middle East & Africa (South Africa, GCC Countries, Rest of MEA) |
| Companies covered |
|
| Customization scope | Free report customization with purchase. Customization includes:-
|
To get a free trial access to our platform which is a one stop solution for all your data requirements for quicker decision making. This platform allows you to compare markets, competitors who are prominent in the market, and mega trends that are influencing the dynamics in the market. Also, get access to detailed SkyQuest exclusive matrix.
Table Of Content
Executive Summary
Market overview
Parent Market Analysis
Market overview
Market size
KEY MARKET INSIGHTS
COVID IMPACT
MARKET DYNAMICS & OUTLOOK
Market Size by Region
KEY COMPANY PROFILES
Methodology
For the Transmission Pipeline Market, our research methodology involved a mixture of primary and secondary data sources. Key steps involved in the research process are listed below:
1. Information Procurement: This stage involved the procurement of Market data or related information via primary and secondary sources. The various secondary sources used included various company websites, annual reports, trade databases, and paid databases such as Hoover's, Bloomberg Business, Factiva, and Avention. Our team did 45 primary interactions Globally which included several stakeholders such as manufacturers, customers, key opinion leaders, etc. Overall, information procurement was one of the most extensive stages in our research process.
2. Information Analysis: This step involved triangulation of data through bottom-up and top-down approaches to estimate and validate the total size and future estimate of the Transmission Pipeline Market.
3. Report Formulation: The final step entailed the placement of data points in appropriate Market spaces in an attempt to deduce viable conclusions.
4. Validation & Publishing: Validation is the most important step in the process. Validation & re-validation via an intricately designed process helped us finalize data points to be used for final calculations. The final Market estimates and forecasts were then aligned and sent to our panel of industry experts for validation of data. Once the validation was done the report was sent to our Quality Assurance team to ensure adherence to style guides, consistency & design.
Analyst Support
Customization Options
With the given market data, our dedicated team of analysts can offer you the following customization options are available for the Transmission Pipeline Market:
Product Analysis: Product matrix, which offers a detailed comparison of the product portfolio of companies.
Regional Analysis: Further analysis of the Transmission Pipeline Market for additional countries.
Competitive Analysis: Detailed analysis and profiling of additional Market players & comparative analysis of competitive products.
Go to Market Strategy: Find the high-growth channels to invest your marketing efforts and increase your customer base.
Innovation Mapping: Identify racial solutions and innovation, connected to deep ecosystems of innovators, start-ups, academics, and strategic partners.
Category Intelligence: Customized intelligence that is relevant to their supply Markets will enable them to make smarter sourcing decisions and improve their category management.
Public Company Transcript Analysis: To improve the investment performance by generating new alpha and making better-informed decisions.
Social Media Listening: To analyze the conversations and trends happening not just around your brand, but around your industry as a whole, and use those insights to make better Marketing decisions.
REQUEST FOR SAMPLE
 REQUEST FREE CUSTOMIZATION


Want to customize this report? This report can be personalized according to your needs. Our analysts and industry experts will work directly with you to understand your requirements and provide you with customized data in a short amount of time. We offer $1000 worth of FREE customization at the time of purchase.
Feedback From Our Clients


 USA (+1) 351-333-4748

