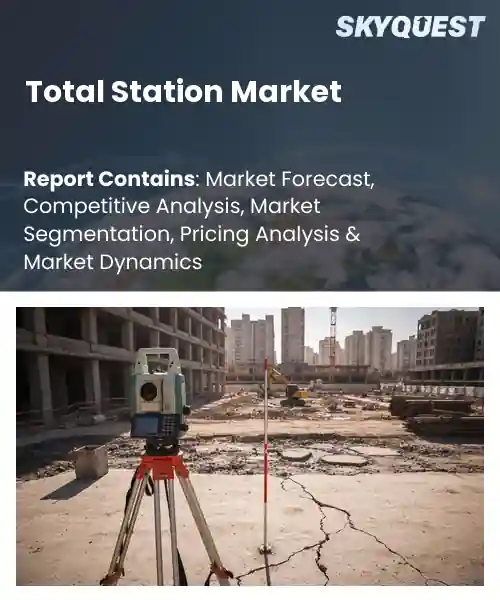
Total Station Market
Report ID: SQMIG20C2211
Report ID: SQMIG20C2211
[email protected]
USA +1 351-333-4748
Report ID:
SQMIG20C2211 |
Region:
Global |
Published Date: May, 2026
Pages:
157
|Tables:
177
|Figures:
81


Global Total Station Market size was valued at USD 2.3 Billion in 2024 and is poised to grow from USD 2.45 Billion in 2025 to USD 4.12 Billion by 2033, growing at a CAGR of 6.7% during the forecast period (2026-2033).
The total station market comprises precision surveying instruments that measure angles and distances to support land surveying, construction layout, mining, and infrastructure monitoring, and it matters because accurate spatial data reduces rework, accelerates projects, and underpins urban planning. Historically the sector evolved from optical theodolites to electronic total stations in the 1970s and then to robotic and integrated GNSS-compatible systems, while integration with drones and BIM has broadened applications. Demand has grown as governments, private developers invest in highways, rail, renewable energy arrays, and smart city grids, illustrated by major corridor and bridge programs that rely on continuous geospatial control.
A key trend driving the global total station sector growth is rapid digitalization of field workflows, which raises adoption because instruments now deliver real-time coordinates to project management platforms and eliminate manual stakeout errors, thereby cutting labor hours and schedule risk. As a consequence vendors bundle cloud software, robotic control and GNSS interoperability, enabling use cases like automated corridor staking on highway projects, high-precision pit surveys in open-pit mining, and deformation monitoring of bridges using continuous measurement. These efficiencies improve return on investment, open opportunities for rental and service contracts, and drive uptake in emerging markets where skilled labor is scarce.
How is AI Enhancing Accuracy in the Total Station Market?
AI technology provides the total station market with much needed improvement in measurement accuracy through the integration of automatic error detection while applying intelligent signal processing functionality for real time correction. Some key elements include sensor fusion, imaging based tracking and edge inference filtering of noise to maintain target lock even in low light or inclement weather conditions. Additionally, many vendors are leveraging machine learning to enhance their current tracking algorithms and utilize cloud workflows to minimize human setup errors and streamline the validation process. Practical instances include AI driven prism tracking automated quality checks and adaptive scanning that shorten field time and reduce rework.
In February 2026, Leica Geosystems introduced the TS20 robotic total station with edge AI that runs on device models to identify and follow targets and to reject false reflections and reduces manual checks in the field. This innovation raises confidence in automated measurements and supports faster project delivery and broader market uptake.
Market snapshot - (2026-2033)
Global Market Size
USD 2.3 Billion
Largest Segment
Robotic Total Stations
Fastest Growth
Robotic Total Stations
Growth Rate
6.7% CAGR
To get more insights on this market click here to Request a Free Sample Report
Global total station market is segmented by product type, technology, application, end user, accuracy range, distribution channel and region. Based on product type, the market is segmented into Manual Total Stations, Robotic Total Stations, Imaging Total Stations and Reflectorless Total Stations. Based on technology, the market is segmented into Electronic Total Stations, GNSS Integrated Total Stations and Bluetooth & Wireless Enabled Total Stations. Based on application, the market is segmented into Land Surveying, Construction Layout, Mining Surveying, Infrastructure Development, Archaeology & Mapping and Others. Based on end user, the market is segmented into Construction Companies, Surveying Firms, Mining Companies, Government Agencies and Research Institutions. Based on accuracy range, the market is segmented into Below 2 Seconds, 2–5 Seconds and Above 5 Seconds. Based on distribution channel, the market is segmented into Direct Sales, Distributors & Dealers and Online Sales. Based on region, the market is segmented into North America, Europe, Asia Pacific, Latin America and Middle East & Africa.
Robotic total stations segment dominates because its automation and single-operator capability dramatically increase field productivity and reduce labor dependencies, enabling continuous remote measurements and faster stakeout workflows. Through seamless instrument control and enhanced throughput via integrated motors and advanced tracking, robotic units have become the preferred solution for complex construction and surveying applications. Robotics have also become increasingly adopted due to their ability to interface with software and sensors which shorten project timelines and enhance measurement consistency across multiple types of project locations.
However, imaging total stations are witnessing the strongest growth momentum as their high-resolution point clouds and integrated imaging enable richer deliverables and faster as-built documentation. Demand for visual verification, BIM integration, and advances in sensor miniaturization expand use cases and create opportunities in surveying, heritage recording and forensics.
GNSS integrated total stations segment dominates because combining satellite positioning with angle and distance measurements delivers unified georeferenced data that simplifies setup and survey control workflows, reducing the need for separate positioning instruments. This integration streamlines data processing, enables immediate coordinate validation in the field, and improves interoperability with mapping systems, so project teams adopt these instruments to shorten survey cycles and ensure consistent spatial referencing across diverse project types.
Meanwhile, bluetooth and wireless enabled total stations are emerging as the key high growth area because seamless connectivity enables real time data transfer, remote control and mobile integration. Demand for collaborative workflows and cloud based data exchange accelerates adoption and enables new software driven services, shortening field to office delivery cycles.
To get detailed segments analysis, Request a Free Sample Report
Based on the global total station market share, Asia Pacific dominance in the industry stems from a constellation of complementary strengths across technology development, manufacturing capacity, and infrastructure demand. Advanced instrumentation design, precision optics and regional centres drive product differentiation. integrated supply chains enable rapid iteration/scale. High levels of demand from complex infrastructure projects and dense urban surveying continue to require the use of high accuracy solutions. Collaborative networks among industry, specialized research institutions, and experienced field service providers strengthen aftersales support and localization. Regional manufacturers and system integrators leverage their ability to customize and produce competitively in order to secure procurement across adjacent markets, creating a virtuous cycle of innovation, competitiveness on price, and mass adoption throughout the region.
Total station market in Japan benefits from a mature precision instrument ecosystem, strong engineering expertise, and collaboration between manufacturers and construction firms. The combination of tight requirements for precision and strict regulatory and quality standards drive adoption of high-tech survey instruments. Support solutions such as service networks and maintenance help to provide longer equipment lifetimes. Sustaining market sophistication and confidence and providing localised customisation is accomplished through ongoing focus on miniaturisation.
Total station market in South Korea is driven by rapid technology assimilation, strong electronics manufacturing capabilities, and close cooperation between research institutes and field operators. Strong after market support along with localised software development, support the rapid and efficient installation and maintenance of these products. Further supporting a strong relationship between suppliers and customers through a focus on interoperability compatibility with geospatial data systems and the ability to customize products for end-users needs.
Based on global total station regional forecast, rapid expansion in North America reflects a convergence of infrastructure renewal priorities, broad adoption of digital construction practices, and strong vendor ecosystems that emphasize integration and support. As contractors and surveying companies establish a greater emphasis on improving operational efficiencies through enhanced workflows, data interoperability and field automation, there has been a rise in investment into modern total station solutions. With a highly competitive aftermarket that includes numerous established training institutions, rental channels and certified servicing businesses; there are fewer barriers to purchasing to accelerate the rapid deployment of these products into the market. The demand from sophisticated engineering projects, along with increasing surveying needs in both urban and rural environments, leads to vendors developing customized solutions and providing localized software modifications. Additionally, through collaborative efforts between industry participants, educational institutions and technology suppliers.
Total station market in the United States is defined by deep integration with digital construction ecosystems, extensive use in infrastructure projects, and a well developed service and rental industry. Interoperability with building information modeling and geospatial platforms drives adoption of advanced hardware and software packages. Implementing comprehensive training, as well as having access to certified support networks, reduces the challenges of deploying new systems. Through their product offerings, vendors seek to align with contractor workflows and industry regulations to support surveyors/engineering firms.
Total station market in Canada reflects emphasis on reliable performance in varied terrain, integration with national mapping programs, and strong relationships between suppliers and engineering consultancies. Availability of localized support, rental options, and training initiatives can help alleviate some of the barriers to deploying these solutions. Vendors are currently modifying their product offerings to ensure interoperability with local GIS providers as well as to ensure compliance with provincial regulations to meet requirements in the field.
As per global total station regional outlook, Europe is strengthening its position through emphasis on precision, standardization, and collaborative innovation across industry and research networks. Producers' emphasis is on modular design, precision in measurement, and a geospatial framework for built structures and landscape features that connect with geo-spatial data across many areas. This procurement strategy creates a framework for the procurement of lifecycle durable, reliable, and interoperable products, thus encouraging manufacturers to provide a full range of hardware and software to support their operations. The presence of engineering firms specializing in this market and the strong networks for both rental and calibration services will result in increased use of these products. The ability to conduct cross-border projects and have a harmonized procedure for certification supports the sharing of best practices, as well as the distribution of solutions that meet conservation.
Total station market in Germany is anchored by engineering traditions, precision manufacturing, and close interaction between instrument makers and civil contractors. The requirement for heavy duty, accurate systems that fit into the National Geodetic Framework manufactures push their development and repair facilities to create durable products with efficient calibration. The development of interoperability and standardisation creates the possibility of creating products that integrate into the broader surveying operations and workflows throughout Europe.
Total station market in the United Kingdom is driven by demand for adaptable, high precision instruments across urban regeneration and transport sectors. Collaboration between technology vendors and engineering consultancies yields tailored systems that integrate with national mapping and building information modeling practices. In addition to promoting interoperability with cloud-supported Geographic Information Systems (GIS), providing field crews with the necessary training to properly use these tools will help to deliver projects on time and efficiently.
Total station market in France draws on integration with national cadastral systems, focus on precision in civil works, and cooperation between manufacturers and surveying firms. The requirement for tailor-made tools that can handle complex data sets provides a growing opportunity in relation to urban planning and infrastructure projects. Interoperability with national GIS standards is a top priority for Vendors, as they also provide needed local functionality to meet both regulatory requirements and project-specific needs.
To know more about the market opportunities by region and country, click here to
Buy The Complete Report
Advancements In Sensor Technology
Integration With Geographic Information Systems
High Equipment Acquisition Costs
Limited Skilled Personnel Availability
Request Free Customization of this report to help us to meet your business objectives.
Competition in the global total station market outlook is shaped by product integration, sensor innovation, and deal making that secure ecosystem lock in. Leading vendors pursue acquisitions of mapping and software firms, form strategic partnerships to embed total stations into BIM and cloud workflows, and roll AI enabled prismless and robotic instruments. Examples include Trimble partnerships with Autodesk and Esri, Leica’s AI enabled Nova series, and Topcon’s drone integrations.
Top Player’s Company Profile
Recent Developments
SkyQuest’s ABIRAW (Advanced Business Intelligence, Research & Analysis Wing) is our Business Information Services team that Collects, Collates, Correlates, and Analyses the Data collected by means of Primary Exploratory Research backed by robust Secondary Desk research.
As per SkyQuest analysis, the global total station industry is being propelled by rapid digitalization of field workflows as a key driver, while high equipment acquisition costs remain a significant restraint. The dominating region is Asia Pacific driven by infrastructure demand and manufacturing strength and the dominating segment is Robotic Total Stations owing to single-operator automation and productivity gains. A second driver is integration with GIS, BIM and cloud platforms which improves interoperability and shortens field to office cycles. Vendors embedding AI, GNSS compatibility and connected services are positioned to expand adoption, with rental and service models unlocking access for budget-constrained buyers and emerging market opportunities.
| Report Metric | Details |
|---|---|
| Market size value in 2024 | USD 2.3 Billion |
| Market size value in 2033 | USD 4.12 Billion |
| Growth Rate | 6.7% |
| Base year | 2024 |
| Forecast period | (2026-2033) |
| Forecast Unit (Value) | USD Billion |
| Segments covered |
|
| Regions covered | North America (US, Canada), Europe (Germany, France, United Kingdom, Italy, Spain, Rest of Europe), Asia Pacific (China, India, Japan, Rest of Asia-Pacific), Latin America (Brazil, Rest of Latin America), Middle East & Africa (South Africa, GCC Countries, Rest of MEA) |
| Companies covered |
|
| Customization scope | Free report customization with purchase. Customization includes:-
|
To get a free trial access to our platform which is a one stop solution for all your data requirements for quicker decision making. This platform allows you to compare markets, competitors who are prominent in the market, and mega trends that are influencing the dynamics in the market. Also, get access to detailed SkyQuest exclusive matrix.
Table Of Content
Executive Summary
Market overview
Parent Market Analysis
Market overview
Market size
KEY MARKET INSIGHTS
COVID IMPACT
MARKET DYNAMICS & OUTLOOK
Market Size by Region
KEY COMPANY PROFILES
Methodology
For the Total Station Market, our research methodology involved a mixture of primary and secondary data sources. Key steps involved in the research process are listed below:
1. Information Procurement: This stage involved the procurement of Market data or related information via primary and secondary sources. The various secondary sources used included various company websites, annual reports, trade databases, and paid databases such as Hoover's, Bloomberg Business, Factiva, and Avention. Our team did 45 primary interactions Globally which included several stakeholders such as manufacturers, customers, key opinion leaders, etc. Overall, information procurement was one of the most extensive stages in our research process.
2. Information Analysis: This step involved triangulation of data through bottom-up and top-down approaches to estimate and validate the total size and future estimate of the Total Station Market.
3. Report Formulation: The final step entailed the placement of data points in appropriate Market spaces in an attempt to deduce viable conclusions.
4. Validation & Publishing: Validation is the most important step in the process. Validation & re-validation via an intricately designed process helped us finalize data points to be used for final calculations. The final Market estimates and forecasts were then aligned and sent to our panel of industry experts for validation of data. Once the validation was done the report was sent to our Quality Assurance team to ensure adherence to style guides, consistency & design.
Analyst Support
Customization Options
With the given market data, our dedicated team of analysts can offer you the following customization options are available for the Total Station Market:
Product Analysis: Product matrix, which offers a detailed comparison of the product portfolio of companies.
Regional Analysis: Further analysis of the Total Station Market for additional countries.
Competitive Analysis: Detailed analysis and profiling of additional Market players & comparative analysis of competitive products.
Go to Market Strategy: Find the high-growth channels to invest your marketing efforts and increase your customer base.
Innovation Mapping: Identify racial solutions and innovation, connected to deep ecosystems of innovators, start-ups, academics, and strategic partners.
Category Intelligence: Customized intelligence that is relevant to their supply Markets will enable them to make smarter sourcing decisions and improve their category management.
Public Company Transcript Analysis: To improve the investment performance by generating new alpha and making better-informed decisions.
Social Media Listening: To analyze the conversations and trends happening not just around your brand, but around your industry as a whole, and use those insights to make better Marketing decisions.
REQUEST FOR SAMPLE
 REQUEST FREE CUSTOMIZATION
Global Total Station Market size was valued at USD 2.3 Billion in 2024 and is poised to grow from USD 2.45 Billion in 2025 to USD 4.12 Billion by 2033, growing at a CAGR of 6.7% during the forecast period (2026-2033).
Competition in the global total station market is shaped by product integration, sensor innovation, and deal making that secure ecosystem lock in. Leading vendors pursue acquisitions of mapping and software firms, form strategic partnerships to embed total stations into BIM and cloud workflows, and roll AI enabled prismless and robotic instruments. Examples include Trimble partnerships with Autodesk and Esri, Leica’s AI enabled Nova series, and Topcon’s drone integrations. Note on sources and scope: public market reporting and vendor announcements show the market remains dominated by established manufacturers and that few verified startups founded since 2019 produce traditional total station instruments. New entrants since 2019 are more commonly providers of SLAM based scanners, backpack or drone mapping services, or software layers that compete with parts of the total station workflow rather than replace incumbent total station manufacturers. 'VITOM Inc: Established in 2022, their main objective is develop 3D scanners and SLAM based digital twin solutions. Recent development: spun off from Motiv Research and commercialized a monitoring product called Vitom Owl while engaging construction industry customers in Japan. The company combines visual SLAM with LiDAR to produce live point cloud feeds. They position their system as a fast alternative to traditional surveying for site monitoring and progress tracking.', 'Droid Survair: Established in 2022, their main objective is deliver drone based surveying and mapping services using LiDAR and photogrammetry. Recent development: registered and operating as a commercial drone survey provider offering DGPS and LiDAR services to infrastructure projects in India. They target contractors seeking faster topographic and volume surveys as a complement or substitute to conventional total station workflows.', 'Topcon Corporation', 'Leica Geosystems', 'Trimble', 'Sokkia', 'Nikon-Trimble', 'South Surveying & Mapping Technology', 'GeoMax', 'Pentax Surveying', 'Hi-Target Surveying Instrument', 'Kolida Instrument', 'Ruide Surveying Instrument', 'Stonex', 'FOIF', 'Changzhou Dadi Surveying Science & Technology', 'Boif Survey Instrument', 'Sanding Surveying Instrument', 'CST Berger', 'Carlson Software', 'Suzhou Foif', 'CHC Navigation'
Advances in sensor precision, miniaturization, and robustness have improved measurement accuracy and reliability, enabling total stations to deliver higher-quality positional data across varied field conditions. Enhanced sensors facilitate easier integration with software and other survey instruments, reduce the need for repeated measurements, and simplify workflows for surveyors and construction teams. Manufacturers can market devices as more dependable and versatile, which encourages adoption across infrastructure, land management, and built-environment projects, thereby expanding the addressable market through broader practical application and improved user confidence.
Ai Enhanced Measurement Intelligence: AI driven algorithms automate point classification, feature extraction and anomaly detection within total station workflows, enabling faster data processing and consistent deliverables. Machine learning models augment instrument firmware to predict and correct measurement errors, reduce manual rework and support field decision making. This allows less experienced operators to uphold quality standards while accelerating project timelines. Vendors increasingly provide integrated software ecosystems and upgradeable intelligence, creating differentiation through ongoing improvements, enhanced data utility and closer coupling of hardware with cloud services.
Why does Asia Pacific Dominate the Global Total Station Market? |@12


Want to customize this report? This report can be personalized according to your needs. Our analysts and industry experts will work directly with you to understand your requirements and provide you with customized data in a short amount of time. We offer $1000 worth of FREE customization at the time of purchase.
Feedback From Our Clients


 USA (+1) 351-333-4748

