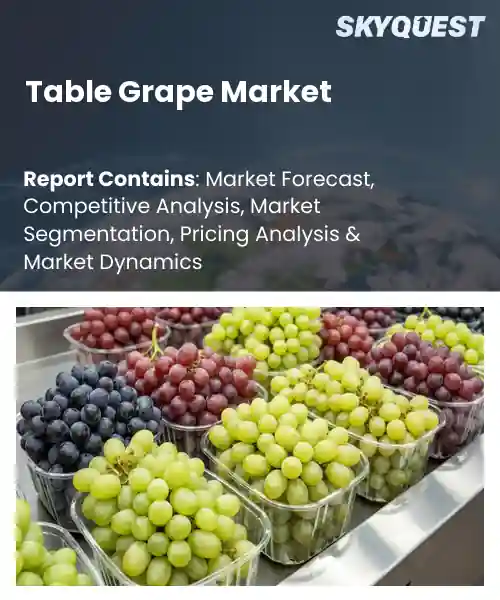
Table Grape Market
Report ID: SQMIG30H2480
Report ID: SQMIG30H2480
[email protected]
USA +1 351-333-4748
Report ID:
SQMIG30H2480 |
Region:
Global |
Published Date: July, 2026
Pages:
157
|Tables:
143
|Figures:
78


Global Table Grape Market size was valued at USD 89.5 Billion in 2024 and is poised to grow from USD 93.62 Billion in 2025 to USD 134.16 Billion by 2033, growing at a CAGR of 4.6% during the forecast period (2026-2033).
Global Market for Table Grapes is made up of fresh grapes that are intended to be eaten directly by consumers as well as exported in packaging. The significance of this market lies in the huge consumer demand for convenient snacks, which are also healthy, and in the value that these fresh grapes bring. In the last twenty years, the market has grown due to an increase in disposable income levels in developing countries, along with advancements in the cold chain logistics systems to reduce loss. The per capita consumption of grapes in China rose from 0.4 kg in 2000 to over 1.2 kg in 2022.
As the logistical framework is being strengthened, consumer awareness is now propelling the next round of growth, where fresh grapes are viewed as an antioxidant and vitamin source. This has led to the allotment of shelf space by retailers; hence, the cultivation of disease-resistant varieties such as 'Thompson Seedless' and 'Crimson Seedless', which fulfill the requirement of quality standards without excessive pesticide use. As a result of this trend, export-focused firms operating in Chile and South Africa have been able to secure contracts from European supermarkets that need clean-label products. Revenue streams more than $2 billion have thus been created by these firms each year.
How is AI-driven Precision Agriculture Influencing the Global Table Grape Market?
Precision farming based on AI is revolutionizing the table grape industry through real-time analysis of information about canopy conditions, water use and disease prevalence. Algorithms powered by sensors and satellite imagery help schedule variable-rate irrigation, apply pesticides selectively, and determine the best time for harvesting. It enables farmers to adapt to changes in micro-climate and eliminate waste, producing better quality fruit and adhering to tougher export requirements. Moreover, it helps to conduct new varieties trials by providing instant information about their success in particular geographical areas such as the beginning of 2026 season in California or shifting exports from Chile. In this way, growers produce more predictable yield volumes and gain more trust, thus increasing consumer demand worldwide.
Market snapshot - (2026-2033)
Global Market Size
USD 89.5 Billion
Largest Segment
Seedless Table Grapes
Fastest Growth
Growth Rate
4.6% CAGR
To get more insights on this market click here to Request a Free Sample Report
Global table grape market is segmented by variety category, color profile, production methodology, distribution channel, end-use application and region. Based on variety category, the market is segmented into Seeded Table Grapes and Seedless Table Grapes. Based on color profile, the market is segmented into White Table Grapes, Red Table Grapes and Black Table Grapes. Based on production methodology, the market is segmented into Organic Table Grapes and Conventional Table Grapes. Based on distribution channel, the market is segmented into Supermarkets, Hypermarkets, Fresh Produce Wholesale Markets, Convenience Stores and Online Grocery Channels. Based on end-use application, the market is segmented into Direct Fresh Consumption and Food Processing Formulations. Based on region, the market is segmented into North America, Europe, Asia Pacific, Latin America and Middle East & Africa.
Seedless Table Grapes category rules the roost due to consumer preference for ease and convenience while consuming, resulting in grape growers concentrating their efforts on producing seedless grapes. Convenience becomes a deciding factor in terms of product placement and promotion by retailers, making this category a dominant one. The consumer-led preference is also making it possible for breeders to develop better taste and texture, ensuring its dominance in the overall market. Retailers provide prime shelf space for these fruits.
However, seeded table grapes have emerged as the fastest-growing segment due to niche consumer demand for traditional texture and taste. The artisanal suppliers are tapping into this demand by promoting limited edition marketing and heritage fruits.
Online Grocery Channels sub-segment is leading owing to the ease offered by the digital channel in terms of receiving fresh grapes right at their doorstep. The ease of visual merchandising along with reviews and subscription services ensures customers’ trust and regular buying, thereby compelling growers and retailers to invest in ecommerce capability. This change transforms the sales funnel, putting online channels at the center of market operations.
On the other hand, Convenience Stores have been enjoying rapid expansion since busy customers are looking forward to accessing fresh grapes immediately, without needing any delivery process. Retailers have expanded fruit departments, introduced ready-to-eat packing, and have made use of point-of-sale promotions, thereby increasing the speed of sales.
To get detailed segments analysis, Request a Free Sample Report
Asia Pacific dominates the global table grape industry through a synergistic effect of good climatic conditions, superior horticulture techniques, and the high consumer preference for fresh fruits. There are many growers within this region who use advancedcanopy management and irrigation technologies to provide grapes of superior quality throughout the year. Efficient retail distribution systems and a culture of healthy snacking add value to the demand for grapes. Additionally, the trade agreements within this region ensure efficient exports of the product, thus increasing the reach of the market beyond the national borders. The research centers in the region constantly develop more resistant cultivars to guarantee supply in changing climatic conditions.
Japan’s Table Grape Market succeeds by having precise orchard management practices and high-quality table grapes which meet consumer demands. Advanced technology is used in the post-harvest stage to increase shelf life and freshness. Grapes are incorporated in various foods during festivals and other culinary events, thereby ensuring constant demand. Growers have close ties with research organizations which allow them to develop new varieties of grapes suited for their tastes.
The Table Grape Market in South Korea is helped by both advanced farming practices as well as culture which favors fresh and healthy snacking. The production process is integrated to ensure that growers have a direct connection with the hyper marketretailers so that there is efficient turn-over with little wastage. There is a continuous collaboration between public and private bodies which conducts research on disease-resistant varieties to ensure productivity.
There is an unprecedented growth in the European table grape market owing to a synergy of health-conscious consumer trends, advanced logistics networks, and scientific agriculture research in the region. Retailers seek top-quality, attractive fruit; hence, growers have embraced advanced canopy techniques and responsible water management. Agreements on cross-border trade make it easier to transport fruits across countries to take advantage of complementary seasons in the Mediterranean regions and temperate regions. In addition, chefs incorporate grapes in a variety of cheese plates, deserts, and wine pairing meals, thus increasing demand for the product. Public information campaigns focus on antioxidant value of grapes and appeal to environmentally conscious consumers. Collaboration between growers, research organizations, and policymakers results in constant improvement of the cultivars and practices.
German Table Grapes is considered an example to follow because of high quality requirements and wholesale logistics. Farmers focus on variety choice which should combine taste intensity with good storability, meeting demands of local and export consumers. Cold chain transportation allows delivery of fresh produce to wholesalers and supermarket chains. Disease resistant varieties obtained during research with agricultural universities minimize use of chemicals. German market dominates due to consumer interest in sustainable agriculture products.
Market of Table Grapes in the United Kingdom demonstrates the highest rate of development due to increasing consumer interest in prepackaged fruit. Unique packing helps keep fruits fresh and allows them to have an extended shelf life in stores. Partnership between grape farmers and culinary colleges develops new recipes involving grapes, which makes their use possible not only for eating but also in desserts and in charcuterie boards.
Table Grape Niche in France is fast becoming a niche market because of the increasing value attached to local produce in cooking. Small-scale vineyard production emphasizes the use of traditional grape varieties which have distinct tastes. Shortened supply chain channels like farmers' markets and internet help retain quality and improve profitability. Collaboration with cooking schools ensures pairing of grapes, while certification promotes sustainable production.
North America is consolidating its presence in the table grapes sector by means of modern agronomics, widespread distribution networks, and increased consumer awareness about healthy nutrition. Modern canopy and pest management are being implemented by growers to improve their produce and at the same time minimize environmental consequences. Efficient cold chain logistics are ensured by large distribution centers that facilitate delivery of the fruit from the field to stores. Marketing campaigns emphasize antioxidants and vitamins contained in table grapes as an element of healthful diet, which corresponds with the consumers’ active way of life. Additionally, interaction of industrial associations and research institutes contributes to continuous improvements in varieties and sustainability. Such a variety of measures makes North America more capable of satisfying domestic needs and increasing exports in order to consolidate its position as one of the leading players in the world market of table grapes.
Table Grape Industry in America profits from the advantage of vineyard acres and an efficient supply chain that emphasizes speed and quality. Producers make use of precise agriculture to make water usage efficient and increase consistency in fruits through different climatic conditions. Good relationships with retailers provide space for the product in supermarkets as well as specialty shops. Research collaborations give rise to disease-resistant species, ensuring continuous supply throughout the year.
Canadian Table Grape Market is centered around cold‑tolerant varieties and sustainable production targeting environment‑aware consumers. Insulated trellis systems and seasonal picking are employed by growers to ensure the same high quality with reduced growing seasons. Regional associations provide centralized cold storage, making it easier to distribute produce to cities. Collaboration with research organizations creates disease‑resistant grapevines, reducing chemical applications. Such approach brings substantial growth in the Canadian table grapes market.
To know more about the market opportunities by region and country, click here to
Buy The Complete Report
Adopting Sustainable Farming Practices
The adoption of sustainable farming has made table grapes more attractive by ensuring that production takes place in line with expectations of environmental responsibility. Retailers are motivated to purchase responsibly grown fruits. Consumers feel safe purchasing grapes knowing that there was no damage done to the environment during the process of grape cultivation. The organic and efficient practices used in farming have been shown to increase the health of vines and fruits and at the same time lower the environmental impact.
Expanding Fresh Produce Retail Channels
Modern retail channels such as hypermarkets, specialty food shops, and internet grocery shopping sites are helping table grapes reach more consumers due to their availability. Retail outlets focus on high-quality fresh foods and engage in promotional initiatives such as tasting and seasonal displays to increase their visibility and generate purchase trials among consumers. This ensures that the product is sold in greater numbers owing to its presence on shelves and easier buying opportunities. Additionally, retailers have begun focusing on key urban locations where spending power is much higher.
Climate Variability Affects Vine Yields
Irregular climate trends such as temperature fluctuations, sporadic precipitation, and the occurrence of hailstorms constitute a serious problem for table grape farming because of the negative impact on the phenology process and poor plant condition. Weather stress affects grapes adversely by causing their irregular development, smaller grape bunches, and higher disease vulnerability, leading to lower crop yields. Farmers have to allocate more funds to implement adaptations such as protective nets and proper grape varieties, which results in higher production expenses and might affect market supply and hinder business expansion.
High Post‑Harvest Losses
Being very fragile in nature, table grapes are highly vulnerable to damage and spoilage due to exposure to dehydration and microbes during handling, transport, and storage. The poor development of cold chain facilities, as well as insufficient use of advanced packaging techniques in certain areas, leads to considerable post-harvest losses in quantity and quality of the fruit available on the market. This does not only have an adverse effect on producers’ profitability but also limits the total amount of grapes available for consumption, thereby restraining demand growth.
Request Free Customization of this report to help us to meet your business objectives.
The dynamics of the international table grape industry are characterized by stiff competition between existing growers and new agritech entrants; market forces such as demand for high-quality fruits and the need for efficiency in the supply chain have encouraged companies to enter into M&A deals and collaborations. For instance, Global Grape Group is utilizing the power of collaboration with U.S. distributors to grow its "First Harvest" program, while some growers are using precision irrigation and blockchain technology to add value to their products.
Sustainable Packaging Adoption: Consumer consciousness about environmental footprint is causing manufacturers and sellers to substitute traditional clamshell packaging with eco-friendly film and carton alternatives as well as compostable trays. This transition not only meets brand sustainability goals but also extends shelf life because it gives better moisture control properties. Chain members are working together on developing uniform packaging that uses less material and allows recycling in a circular manner, whereas growers will be able to reap high profits due to increasing demand for sustainably packed fresh fruits among consumers worldwide.
Digital Traceability Solutions: Modern retailers and exporters use blockchain technologies, QR codes, and IoT devices to ensure real-time information about the provenance of table grapes. The transparency of this information gives consumers confidence regarding its origin, use of pesticides, and freshness of the product. As a result of integration of traceability technologies into logistics systems, it is possible to solve recall issues, improve inventory management, and meet food safety regulations. It creates an image of high-quality products for health-conscious customers.
SkyQuest’s ABIRAW (Advanced Business Intelligence, Research & Analysis Wing) is our Business Information Services team that Collects, Collates, Correlates, and Analyses the Data collected by means of Primary Exploratory Research backed by robust Secondary Desk research.
As per SkyQuest analysis, the growth drivers of the world’s table grapes market are primarily the growing avenues of retail of fresh produce which offer the farmers more shelf space and inspire consumer trials, the second one being the use of artificial intelligence technology for precision agriculture that ensures more consistency and less wastage. Sustainable farming techniques are another factor that adds to its popularity, although climatic variations have posed a challenge to the growth prospects of the market by affecting vine yields and increasing costs of production. The most dominant geographical area is Asia Pacific owing to favorable climate, advanced horticulture and high per capita consumption.
| Report Metric | Details |
|---|---|
| Market size value in 2024 | USD 89.5 Billion |
| Market size value in 2033 | USD 134.16 Billion |
| Growth Rate | 4.6% |
| Base year | 2024 |
| Forecast period | (2026-2033) |
| Forecast Unit (Value) | USD Billion |
| Segments covered |
|
| Regions covered | North America (US, Canada), Europe (Germany, France, United Kingdom, Italy, Spain, Rest of Europe), Asia Pacific (China, India, Japan, Rest of Asia-Pacific), Latin America (Brazil, Rest of Latin America), Middle East & Africa (South Africa, GCC Countries, Rest of MEA) |
| Companies covered |
|
| Customization scope | Free report customization with purchase. Customization includes:-
|
To get a free trial access to our platform which is a one stop solution for all your data requirements for quicker decision making. This platform allows you to compare markets, competitors who are prominent in the market, and mega trends that are influencing the dynamics in the market. Also, get access to detailed SkyQuest exclusive matrix.
Table Of Content
Executive Summary
Market overview
Parent Market Analysis
Market overview
Market size
KEY MARKET INSIGHTS
COVID IMPACT
MARKET DYNAMICS & OUTLOOK
Market Size by Region
KEY COMPANY PROFILES
Methodology
For the Table Grape Market, our research methodology involved a mixture of primary and secondary data sources. Key steps involved in the research process are listed below:
1. Information Procurement: This stage involved the procurement of Market data or related information via primary and secondary sources. The various secondary sources used included various company websites, annual reports, trade databases, and paid databases such as Hoover's, Bloomberg Business, Factiva, and Avention. Our team did 45 primary interactions Globally which included several stakeholders such as manufacturers, customers, key opinion leaders, etc. Overall, information procurement was one of the most extensive stages in our research process.
2. Information Analysis: This step involved triangulation of data through bottom-up and top-down approaches to estimate and validate the total size and future estimate of the Table Grape Market.
3. Report Formulation: The final step entailed the placement of data points in appropriate Market spaces in an attempt to deduce viable conclusions.
4. Validation & Publishing: Validation is the most important step in the process. Validation & re-validation via an intricately designed process helped us finalize data points to be used for final calculations. The final Market estimates and forecasts were then aligned and sent to our panel of industry experts for validation of data. Once the validation was done the report was sent to our Quality Assurance team to ensure adherence to style guides, consistency & design.
Analyst Support
Customization Options
With the given market data, our dedicated team of analysts can offer you the following customization options are available for the Table Grape Market:
Product Analysis: Product matrix, which offers a detailed comparison of the product portfolio of companies.
Regional Analysis: Further analysis of the Table Grape Market for additional countries.
Competitive Analysis: Detailed analysis and profiling of additional Market players & comparative analysis of competitive products.
Go to Market Strategy: Find the high-growth channels to invest your marketing efforts and increase your customer base.
Innovation Mapping: Identify racial solutions and innovation, connected to deep ecosystems of innovators, start-ups, academics, and strategic partners.
Category Intelligence: Customized intelligence that is relevant to their supply Markets will enable them to make smarter sourcing decisions and improve their category management.
Public Company Transcript Analysis: To improve the investment performance by generating new alpha and making better-informed decisions.
Social Media Listening: To analyze the conversations and trends happening not just around your brand, but around your industry as a whole, and use those insights to make better Marketing decisions.
REQUEST FOR SAMPLE
 REQUEST FREE CUSTOMIZATION
Global Table Grape Market size was valued at USD 89.5 Billion in 2024 and is poised to grow from USD 93.62 Billion in 2025 to USD 134.16 Billion by 2033, growing at a CAGR of 4.6% during the forecast period (2026-2033).
The competitive landscape of the global table grape market is shaped by intense rivalry among established growers and emerging agritech players, with market drivers such as consumer demand for premium varieties and supply‑chain efficiency prompting strategic M&A and partnership moves. Global Grape Group, for example, is leveraging a partnership with U.S. distributors to expand its “First Harvest” initiative, while several growers are adopting precision‑irrigation and blockchain traceability to differentiate their brands and secure shelf‑life advantages. 'Fresh Del Monte Produce Inc.', 'Dole Food Company Inc.', 'Sun World International LLC', 'Total Produce PLC', 'Greenyard NV', 'Chiquita Brands International Sarl', 'Capespan Group Limited', 'Oppy', 'Unifrutti Group', 'Pandol Brothers Inc.', 'Giumarra Companies', 'Four Star Fruit Inc.', 'GrapeCo Australia', 'Frutera', 'Karsten Group', 'Subsole', 'El Ciruelo S.L.', 'Grapery', 'Vanguard International', 'Mucci Farms'
Adoption of sustainable farming practices is enhancing the appeal of table grapes by aligning production with environmental stewardship expectations, encouraging retailers to source responsibly grown fruit, and fostering consumer confidence in product safety. Producers are leveraging organic methods, water conservation, and integrated pest management, which improve vine health and fruit quality while reducing ecological footprints. This alignment with growing consumer values and regulatory trends supports market expansion as demand for ethically produced grapes continues to rise. Retail chains are increasingly promoting these items through dedicated shelf space and sustainability messaging.
Sustainable Packaging Adoption: Growing consumer awareness of environmental impact drives producers and retailers to replace conventional plastic clamshells with biodegradable films, recycled cartons, and compostable trays. This shift not only aligns with brand sustainability commitments but also enhances shelf‑life by providing superior moisture control. Supply‑chain partners are collaborating on standardized packaging designs that reduce material weight and enable circular recycling loops, while growers benefit from premium pricing opportunities as shoppers increasingly favor responsibly packaged fresh fruit in the global marketplace.
Why does Asia Pacific Dominate the Global Table Grape Market? |@12


Want to customize this report? This report can be personalized according to your needs. Our analysts and industry experts will work directly with you to understand your requirements and provide you with customized data in a short amount of time. We offer $1000 worth of FREE customization at the time of purchase.
Feedback From Our Clients


 USA (+1) 351-333-4748

