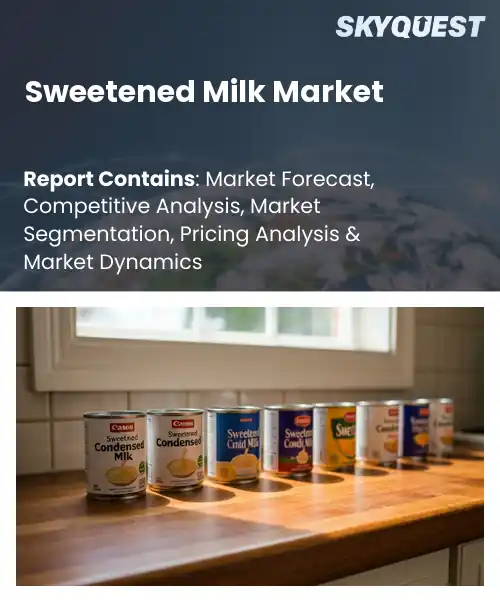
Sweetened Milk Market
Report ID: SQMIG30I2867
Report ID: SQMIG30I2867
[email protected]
USA +1 351-333-4748
Report ID:
SQMIG30I2867 |
Region:
Global |
Published Date: March, 2026
Pages:
157
|Tables:
202
|Figures:
80


Global Sweetened Milk Market size was valued at USD 7.3 Million in 2024 and is poised to grow from USD 8.41 Million in 2025 to USD 26.09 Million by 2033, growing at a CAGR of 15.2% during the forecast period (2026-2033).
Sweetened milk markets are propelled primarily by consumer demand for convenient, indulgent and shelf-stable dairy beverages, a driver that links cultural tastes with modern retailing and food technology. Historically the category evolved from preserved products such as sweetened condensed and evaporated milk to ready-to-drink flavored milks and sweetened yogurts, and producers like Nestlé and regional dairy cooperatives expanded distribution through supermarkets and informal channels. This evolution matters because it transforms perishable raw milk into higher-value, longer-lasting products that broaden access in urbanizing regions, support cold-chain flexibility and create predictable revenue streams for farmers and processors while shaping retail assortment strategies.A dominant growth factor is rapid urbanization combined with shifting consumption habits, because denser city living increases demand for portable, indulgent nutrition and expands modern retail penetrations that favor branded sweetened milk offerings. As supermarkets and convenience stores proliferate, manufacturers respond with single-serve flavored milks and shelf-stable cans, this product availability causes higher trial rates and brand loyalty among busy consumers. In practical terms Vietnamese cafes use condensed milk in iced coffee, school meal initiatives incorporate fortified sweetened milk to address micronutrient gaps, and beverage formulators leverage flavored milk bases to create ready-to-drink protein and dessert-style products that capture value.
How is AI enhancing supply chain efficiency in the sweetened milk market?
AI enhances supply chain efficiency in the sweetened milk market by improving forecasting inventory control production reliability and distribution. Key aspects are machine learning driven demand forecasts that align production with changing consumption patterns smart sensors that enable predictive maintenance and AI guided logistics that reduce spoilage and speed deliveries. The market today balances seasonal milk supply and strong demand for ready to drink and condensed sweetened formats. Firms are adopting factory level AI assistants to analyze line data and inventory systems that prioritize shelf life while boosting traceability and food safety. Danone June 2025, shows industry scale investment in AI training and digital factories.Arla Foods February 2026, announced a UHT Centre of Excellence to expand long life milk capacity which supports sweetened milk formats. AI enabled planning and predictive maintenance can optimize scheduling reduce downtime and improve traceability so the expansion delivers faster replenishment and more consistent quality.
Market snapshot - (2026-2033)
Global Market Size
USD 7.3 Million
Largest Segment
Sweetened Condensed Milk
Fastest Growth
Flavored Sweetened Milk
Growth Rate
15.2% CAGR
To get more insights on this market click here to Request a Free Sample Report
Global sweetened milk market is segmented by product type, flavour, form, packaging type, application, distribution channel, end-user and region. Based on product type, the market is segmented into Sweetened Condensed Milk, Flavored Sweetened Milk, Sweetened Powdered Milk and Others. Based on flavour, the market is segmented into Chocolate, Vanilla, Strawberry, Caramel and Others. Based on form, the market is segmented into Liquid and Powder. Based on packaging type, the market is segmented into Cans, Bottles and Sachets / Pouches. Based on application, the market is segmented into Bakery & Confectionery, Beverages, Desserts & Ice Cream and Household Consumption. Based on distribution channel, the market is segmented into Online and Offline. Based on end-user, the market is segmented into Household / Retail Consumers, Foodservice (Hotels, Restaurants, Cafés) and Food & Beverage Manufacturers. Based on region, the market is segmented into North America, Europe, Asia Pacific, Latin America and Middle East & Africa.
Sweetened Condensed Milk segment dominates because it functions as both a retail staple and a primary industrial input, driving consistent demand across households, bakeries, and food manufacturers. Its concentrated form reduces logistics and storage pressure while offering versatile application in beverages, desserts, and confectionery. Established production processes, brand familiarity, and retailer preference for durable, long shelf-life SKUs further entrench its central position in procurement and assortment strategies.
However, Flavored Sweetened Milk is emerging as the fastest growing sub-category due to flavor innovation and premiumization that attract younger consumers seeking ready-to-drink indulgence. New flavor launches, seasonal variants, and co-branding drives trial and repeat purchases, prompting manufacturers to invest in formulation and marketing that expand retail presence and create incremental revenue streams.
Cans segment dominates because metal containers deliver superior barrier protection and long shelf life, matching the preservation needs of concentrated sweetened milks and simplifying distribution for large retailers. Rigid cans enable high-speed filling, consistent labeling, efficient stacking, and reduced spoilage risk, supporting large-scale production economics and established stocking practices. Consumer familiarity and strong shelf visibility further incentivize investments in can-processing capabilities across the supply chain.
Meanwhile, Sachets / Pouches are the fastest growing packaging choice driven by convenience, cost efficient single-serve formats, e-commerce compatibility, and lower material and transport footprints. Innovation in resealable and ready to use pouch designs encourages trial, portable consumption, and precise foodservice portioning, opening new channels and lowering entry barriers for smaller manufacturers.
To get detailed segments analysis, Request a Free Sample Report
Asia Pacific dominates the global sweetened milk market due to a convergence of cultural preference for sweet dairy beverages, extensive manufacturing capacity, and sophisticated distribution networks that reach both urban and rural consumers. Consumers in the region display a strong appetite for flavor variety and convenient formats, encouraging brands to pursue rapid product development and localized innovations. Strong local brands prioritize flavor innovation, convenience packaging, and premium positioning, while agile small and medium producers tailor products to regional tastes. Integrated dairy supply chains and collaborative partnerships between manufacturers and retailers reinforce reliability, and supportive regulatory environments for product variants enable continuous portfolio expansion and deep market penetration across diverse national markets. This combination creates resilient regional leadership.
Sweetened Milk Market in Japan is characterized by a strong preference for premium and innovative flavor profiles, where producers emphasize craftsmanship, texture refinement, and packaging that signals quality. Urban consumption favors ready-to-drink formats and limited edition flavors that appeal to discerning palates. Manufacturer focus on quality control, ingredient sourcing, and collaborations with culinary brands reinforces a premium positioning. Retail channels emphasize experiential marketing and curated assortments to engage loyal consumers.
Sweetened Milk Market in South Korea displays strong consumer interest in functional and flavor-forward variants, with manufacturers blending traditional dairy profiles and contemporary tastes. Convenience retail and café culture drive demand for indulgent offerings, while limited edition collaborations build brand momentum. Emphasis on product aesthetics, on-trend flavors, and adaptive supply chains allows rapid shelf turnover. Strategic partnerships between beverage developers and retail chains support broad market access and consumer trial.
Rapid expansion in Europe is driven by evolving consumer expectations that blend a desire for sensory indulgence with interest in quality sourcing and product transparency. Manufacturers respond with diversified portfolios that range from premium artisanal offerings to widely available convenience formats, supported by innovation in flavors, texture, and functional ingredients. Retailers and food service channels amplify reach through curated displays and co-branded promotions, while private label strategies increase accessibility and competitive dynamics. Sustainability considerations and clear labeling reinforce trust, encouraging trial and repeat purchase. Cross-market collaboration among manufacturers, ingredient suppliers, and retail partners facilitates efficient product adaptation to national preferences, enabling swift scaling of successful concepts across the region and sustaining momentum in both mature and emerging national markets. Regulatory alignment and culinary heritage contribute to varied yet complementary market approaches.
Sweetened Milk Market in Germany is marked by wide retail distribution and a dominance of established manufacturers that balance innovation with production scale. Private label offerings compete alongside branded portfolios, driving variety and value perception. Retail partnerships prioritize efficient supply chains and prominent shelf placement, while manufacturers focus on product consistency, ingredient traceability, and broader flavor ranges. Food service adoption and convenience culture support consumption across urban and suburban outlets.
Sweetened Milk Market in United Kingdom reflects strong consumer openness to novel formats and flavor experimentation, supported by dynamic retail channels and an active café scene. Emerging brands leverage social engagement and limited releases to build awareness, while established manufacturers accelerate product diversification. Convenience and on-the-go consumption trends favor ready-to-drink and chilled formats. Emphasis on sustainable packaging and transparent sourcing helps new offerings secure shelf presence and stimulate consumer trial.
Sweetened Milk Market in France is shaped by a balance between artisanal tradition and modern convenience, with an emphasis on authentic flavors and ingredient provenance. Smaller producers and regional brands experiment with specialty flavors and texture variations that appeal to consumers. Retail focus on curated assortments and premium shelving supports discovery, while food service venues incorporate sweetened milk offerings into dessert and beverage menus to broaden occasions and consumer familiarity.
North America is strengthening its position through a combination of innovation, channel diversification, and collaborative industry practices that enhance product relevance and availability. Manufacturers invest in reformulation and sensory innovation to meet varied consumer preferences for indulgence, convenience, and nutritional positioning, while retail partners expand shelf presentations and promotional support. Growth in food service and on-the-go consumption creates new occasions, and e-commerce channels facilitate targeted launches and direct consumer engagement. Emphasis on supply chain transparency, sustainable packaging, and ingredient traceability addresses consumer expectations and regulatory scrutiny. Strategic alliances between ingredient suppliers, co-packers, and retailers enable agile scale-up of successful concepts, reinforcing market resilience and broadening the category appeal across regional and demographic segments. Investment in product differentiation and targeted marketing strengthens competitive positioning across national markets.
Sweetened Milk Market in United States draws on extensive retail distribution and active product innovation, with manufacturers emphasizing flavor variety, convenient formats, and functional cues to suit consumption occasions. Private label rivalry alongside branded introductions increases shelf diversity and accessibility. Food service and quick service venues incorporate sweetened milk into beverage and dessert offerings, broadening occasions. Marketing emphasizes experiential sampling and targeted digital engagement to drive trial and foster loyalty.
Sweetened Milk Market in Canada emphasizes natural ingredient claims, clean labeling, and responsible sourcing that shape product development and marketing. Producers balance indulgent flavor profiles with quality signals to appeal to mainstream and discerning consumers. Retail channels offer curated selections highlighting regional and seasonal offerings, while collaboration with food service operators introduces sweetened milk into diverse menu applications. Investment in sustainable packaging and local chain narratives strengthens trust and loyalty.
To know more about the market opportunities by region and country, click here to
Buy The Complete Report
Rising Demand For Ready Meals
Innovation In Flavors And Formats
Health Concerns Over Added Sugars
Regulatory Scrutiny And Labeling
Request Free Customization of this report to help us to meet your business objectives.
Competitive dynamics in the global sweetened milk market center on technology driven differentiation and strategic corporate startup collaboration. Incumbent dairy groups invest in and license precision fermentation and cell based providers to secure formulations for sweetened dairy beverages. Concrete tactics include minority investments, joint development agreements, licensing and planned production facilities by biotech startups, accelerating product launches and supply chain scale up.
Top Player’s Company Profile
Recent Developments
SkyQuest’s ABIRAW (Advanced Business Intelligence, Research & Analysis Wing) is our Business Information Services team that Collects, Collates, Correlates, and Analyses the Data collected by means of Primary Exploratory Research backed by robust Secondary Desk research. As per SkyQuest analysis, the global sweetened milk market is positioned for strong growth driven primarily by rapid urbanization and shifting consumption habits that increase demand for convenient, indulgent and shelf stable dairy beverages. Asia Pacific dominates the market and sweetened condensed milk remains the leading segment thanks to its versatility, long shelf life and strong industrial use. However growing consumer concerns about added sugars are a key restraint prompting reformulation and demand for low sugar alternatives. A second growth driver is continuous flavor and format innovation, where ready to drink flavored milks and single serve pouches expand occasions, trial and premiumization.
| Report Metric | Details |
|---|---|
| Market size value in 2024 | USD 7.3 Million |
| Market size value in 2033 | USD 26.09 Million |
| Growth Rate | 15.2% |
| Base year | 2024 |
| Forecast period | (2026-2033) |
| Forecast Unit (Value) | USD Million |
| Segments covered |
|
| Regions covered | North America (US, Canada), Europe (Germany, France, United Kingdom, Italy, Spain, Rest of Europe), Asia Pacific (China, India, Japan, Rest of Asia-Pacific), Latin America (Brazil, Rest of Latin America), Middle East & Africa (South Africa, GCC Countries, Rest of MEA) |
| Companies covered |
|
| Customization scope | Free report customization with purchase. Customization includes:-
|
To get a free trial access to our platform which is a one stop solution for all your data requirements for quicker decision making. This platform allows you to compare markets, competitors who are prominent in the market, and mega trends that are influencing the dynamics in the market. Also, get access to detailed SkyQuest exclusive matrix.
Table Of Content
Executive Summary
Market overview
Parent Market Analysis
Market overview
Market size
KEY MARKET INSIGHTS
COVID IMPACT
MARKET DYNAMICS & OUTLOOK
Market Size by Region
KEY COMPANY PROFILES
Methodology
For the Sweetened Milk Market, our research methodology involved a mixture of primary and secondary data sources. Key steps involved in the research process are listed below:
1. Information Procurement: This stage involved the procurement of Market data or related information via primary and secondary sources. The various secondary sources used included various company websites, annual reports, trade databases, and paid databases such as Hoover's, Bloomberg Business, Factiva, and Avention. Our team did 45 primary interactions Globally which included several stakeholders such as manufacturers, customers, key opinion leaders, etc. Overall, information procurement was one of the most extensive stages in our research process.
2. Information Analysis: This step involved triangulation of data through bottom-up and top-down approaches to estimate and validate the total size and future estimate of the Sweetened Milk Market.
3. Report Formulation: The final step entailed the placement of data points in appropriate Market spaces in an attempt to deduce viable conclusions.
4. Validation & Publishing: Validation is the most important step in the process. Validation & re-validation via an intricately designed process helped us finalize data points to be used for final calculations. The final Market estimates and forecasts were then aligned and sent to our panel of industry experts for validation of data. Once the validation was done the report was sent to our Quality Assurance team to ensure adherence to style guides, consistency & design.
Analyst Support
Customization Options
With the given market data, our dedicated team of analysts can offer you the following customization options are available for the Sweetened Milk Market:
Product Analysis: Product matrix, which offers a detailed comparison of the product portfolio of companies.
Regional Analysis: Further analysis of the Sweetened Milk Market for additional countries.
Competitive Analysis: Detailed analysis and profiling of additional Market players & comparative analysis of competitive products.
Go to Market Strategy: Find the high-growth channels to invest your marketing efforts and increase your customer base.
Innovation Mapping: Identify racial solutions and innovation, connected to deep ecosystems of innovators, start-ups, academics, and strategic partners.
Category Intelligence: Customized intelligence that is relevant to their supply Markets will enable them to make smarter sourcing decisions and improve their category management.
Public Company Transcript Analysis: To improve the investment performance by generating new alpha and making better-informed decisions.
Social Media Listening: To analyze the conversations and trends happening not just around your brand, but around your industry as a whole, and use those insights to make better Marketing decisions.
REQUEST FOR SAMPLE
 REQUEST FREE CUSTOMIZATION


Want to customize this report? This report can be personalized according to your needs. Our analysts and industry experts will work directly with you to understand your requirements and provide you with customized data in a short amount of time. We offer $1000 worth of FREE customization at the time of purchase.
Feedback From Our Clients


 USA (+1) 351-333-4748

