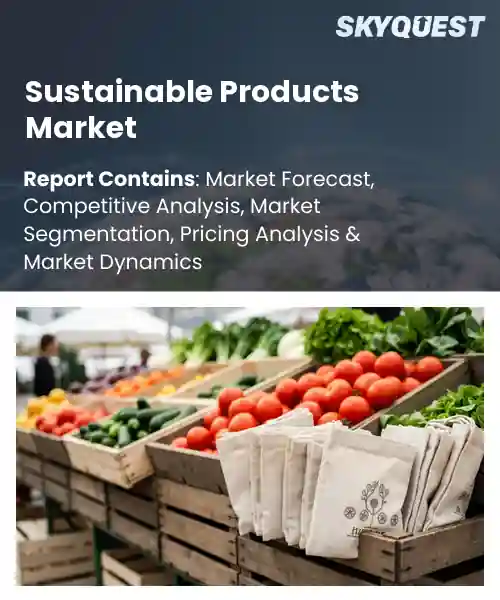
Sustainable Products Market
Report ID: SQMIG45E2767
Report ID: SQMIG45E2767
[email protected]
USA +1 351-333-4748
Report ID:
SQMIG45E2767 |
Region:
Global |
Published Date: April, 2026
Pages:
157
|Tables:
89
|Figures:
76


Global Sustainable Products Market size was valued at USD 212.4 Billion in 2024 and is poised to grow from USD 245.53 Billion in 2025 to USD 215.4 Billion by 2033, growing at a CAGR of 15.6% during the forecast period (2026-2033).
Consumer demand for environmental responsibility is the primary driver of the sustainable products market, increasingly global, as heightened awareness of climate constraints reshapes purchase decisions and corporate strategy. The market comprises goods designed to minimize environmental harm across their lifecycle, spanning everything from recycled textiles and low-carbon building materials to energy-efficient appliances and biodegradable packaging. It matters because product choices aggregate into significant emissions and waste outcomes, influencing regulatory agendas and investors. Over the last three decades the sector has evolved from niche eco-labels to mainstream brands and policy frameworks, exemplified by Patagonia's transparency initiatives and extended producer responsibility laws.Consequently, regulatory pressure and corporate procurement policies act as a key accelerator for global sustainable products, because mandated reporting, carbon pricing and green public procurement force supply chain redesigns and scale adoption of cleaner alternatives. When governments levy extended producer responsibility fees manufacturers internalize end-of-life costs and invest in recyclable materials, which in turn lowers unit costs through scale as seen with recycled PET adoption in beverage packaging. Similarly, corporate procurement commitments from retailers create predictable demand that incentivizes suppliers to innovate, prompting practical use cases like take-back textile programs, product-as-a-service lighting contracts, and low-carbon concrete trials in construction globally.
How is AI enhancing supply chain transparency in the sustainable products market?
AI is making supply chain transparency practical for the sustainable products market by connecting diverse data sources and automating verification. Key aspects include real time traceability from raw material to finished good, automated document verification and predictive flagging of supplier risks. Market demand for credible sustainability claims and tighter regulation push brands to prove provenance, so AI interprets sensor feeds documents and certificates and links those signals to auditable records. These capabilities help standardize supplier data reconcile inconsistencies and enable consumer facing proof of origin, making sustainability claims more reliable and easier to scale.IBM March 2026, announced new AI capabilities that embed transparency into enterprise supply chain analytics and bill of materials workflows, supporting growth by automating evidence collection, surfacing provenance insights and speeding sustainable sourcing decisions.
Market snapshot - (2026-2033)
Global Market Size
USD 212.4 Billion
Largest Segment
Semi-autonomous/Remote-controlled Robots
Fastest Growth
Fully Autonomous Robots (AI & Sensor-driven)
Growth Rate
15.6% CAGR
To get more insights on this market click here to Request a Free Sample Report
Global sustainable products market is segmented by product configuration, application/operation, technology component and region. Based on product configuration, the market is segmented into Fully Autonomous Robots (AI & Sensor-driven) and Semi-autonomous/Remote-controlled Robots. Based on application/operation, the market is segmented into Precision Agriculture (Crop Protection/Orchards), Industrial & Warehouse Disinfection and Others (Public Spaces & Sports Turf Maintenance). Based on technology component, the market is segmented into Navigation & GPS Systems, Sensing & Imaging Units (Lidar/Cameras) and Others (Spraying & Tank Systems). Based on region, the market is segmented into North America, Europe, Asia Pacific, Latin America and Middle East & Africa.
Fully Autonomous Robots (AI & Sensor-driven) segment dominates because these platforms deliver end to end automation that aligns with sustainability objectives by reducing human error, optimizing resource use, and enabling continuous operation in energy and input constrained environments. Their advanced decision making and sensor fusion allow precise application and adaptive task scheduling, which lowers waste and operational footprints. Consequently buyers favor fully autonomous solutions for scalable lifecycle efficient implementations across complex sustainable product deployments.
However, Semi-autonomous/Remote-controlled Robots are the fastest growing area as they lower adoption barriers for cost conscious users while offering immediate operational flexibility. Their compatibility with legacy systems and human oversight capabilities accelerate deployment across varied sustainable product use cases, driving supplier innovation and creating near term market opportunity through scalable hybrid automation models.
Sensing & Imaging Units (Lidar/Cameras) segment stands out because high fidelity perception underpins sustainable product performance by enabling precise monitoring, targeted actuation, and reliable autonomy across varied environments. Rich data streams from lidar and camera systems drive smarter control algorithms that reduce overapplication of inputs and support predictive maintenance. This sensing backbone elevates product effectiveness and builds trust among buyers prioritizing measurable sustainability outcomes.
Meanwhile, Navigation & GPS Systems are experiencing the strongest growth as reliable positioning enables optimized routing, lower energy consumption, and coordinated multi platform operations that unlock new service models. Easier integration and smaller receivers accelerate adoption across product ranges, attracting ecosystem investment and expanding practical applications for sustainable products requiring precise spatial awareness.
To get detailed segments analysis, Request a Free Sample Report
Europe dominates the global sustainable products market due to an integrated combination of regulatory ambition, mature industrial capabilities, and strong consumer demand for transparent, low-impact goods. Policy frameworks across the region create consistent incentives for circularity, lifecycle assessments, and ecolabeling, which reduce market fragmentation and lower barriers to scale. Established manufacturing clusters and advanced materials research accelerate commercialization while green finance and public procurement create reliable demand signals. Cross-border collaboration among standards bodies, industry consortia, and research institutions fosters harmonized certification and supply chain traceability. This ecosystem supports diverse business models from product-as-a-service to closed-loop manufacturing, enabling firms to innovate in design, sourcing, and end-of-life solutions and to export best practices across adjacent markets. Retail leadership and investment in reuse infrastructure, supported by a skilled workforce, further strengthen market resilience and enable rapid diffusion of sustainable offerings.
Sustainable Products Market in Germany benefits from advanced industrial decarbonization initiatives, strong engineering expertise, and collaborative networks between manufacturers, research institutions, and standards bodies. Demand is shaped by environmentally conscious consumers and proactive corporate strategies that prioritize lifecycle performance and material efficiency. The market draws on a mature supplier base and policy incentives that favor circular business models, enabling rapid commercialization and export of sustainable product variants across key sectors.
Sustainable Products Market in the United Kingdom is characterized by strong retail leadership, sophisticated green finance ecosystems, and active standards-setting bodies that guide product claims and labeling. Consumer demand for transparency and circular services fuels experimentation with reuse and repair models, while corporate sustainability commitments encourage supplier shifts toward lower-impact materials. Collaboration between innovators, logistics providers, and policy makers accelerates adoption of sustainable product designs across urban supply chains nationally.
Sustainable Products Market in France is driven by a strong emphasis on design-led sustainability, public procurement preferences that favor low-impact goods, and an ecosystem of designers and SMEs innovating with bio-based materials. Consumer interest in provenance and repairability supports premium positioning for certified products, while regional clusters facilitate pilot programs and knowledge transfer. Partnerships between large manufacturers and startups support scale-up pipelines that integrate circular approaches into mainstream product portfolios.
North America is experiencing rapid expansion in sustainable products due to a convergence of market catalysts that include proactive corporate sustainability commitments, dynamic innovation ecosystems, and consumer preferences that reward transparency and performance. Investment flows and venture-backed startups drive material and process innovations, while retailers and procurement policies increase visibility and shelf presence for greener alternatives. Regional regulatory measures and municipal initiatives encourage circular practices and infrastructure development, complementing private-sector take-up. Strong logistics networks and scale advantages help bring new products to mainstream channels, and collaborative platforms between industry, academia, and certification bodies accelerate standardization and consumer trust. This combination fosters a fertile environment for diversification of product offerings and experimentation with new business models. Evolving distribution models and digital platforms further amplify reach and consumer engagement for sustainable alternatives.
Sustainable Products Market in the United States is driven by major retail adoption, strong private investment in cleantech and materials innovation, and widespread corporate sustainability commitments that shift procurement toward lower-impact options. Diverse consumer segments demand traceability and performance, prompting brands to invest in certification, transparent supply chains, and scalable manufacturing partnerships. State and municipal initiatives complement private action, supporting circular initiatives and enabling pilots that inform broader commercialization strategies.
Sustainable Products Market in Canada benefits from focused policy initiatives, strong certification ecosystems, and active collaboration between research institutions and SMEs to commercialize low-impact materials. Resource-based sectors are pursuing value-added sustainable offerings while procurement policies and incentive programs elevate demand for circular solutions. Close integration with continental supply chains and emphasis on community engagement support pilot projects and regional clusters that refine scalable product designs and improve end-of-life logistics operations.
Asia Pacific is strengthening its position in the sustainable products market through concentrated investment in advanced materials research, manufacturing modernization, and targeted industrial strategies that prioritize low-impact production. Leading economies in the region are leveraging strong supplier ecosystems and design capabilities to integrate circular principles into high-value product categories. Corporate commitments to energy efficiency and supply chain transparency are prompting shifts in sourcing and packaging innovation. Public-private collaboration accelerates pilot programs for recycling and remanufacturing, while export-oriented manufacturing benefits from quality-focused branding that highlights environmental credentials. Cross-border partnerships and knowledge exchange with global standard bodies enhance certification compatibility, enabling firms to compete effectively in both regional and international markets. Adoption of digital traceability tools and smart manufacturing platforms further improves material efficiency and consumer confidence, supporting broader market uptake.
Sustainable Products Market in Japan leverages deep capabilities in precision manufacturing and materials science, enabling development of high-performance, low-impact product variants. Corporations emphasize long-term quality and repairability, while coordinated R&D consortia accelerate commercialization of bio-based and recyclable materials. Government-industry collaboration supports pilot recycling and remanufacturing initiatives, and strong brand focus on reliability helps manufacturers position sustainable offerings for both domestic consumers and discerning export markets through coordinated supply partnerships nationwide.
Sustainable Products Market in South Korea benefits from strength in advanced electronics, materials innovation, and agile manufacturing that supports rapid integration of sustainable features. Government-led programs and industry consortia promote resource efficiency, recycling technologies, and scalable production methods. Domestic brands emphasize design and performance to meet discerning consumers, while export-oriented strategies leverage certification and quality assurance to access regional markets and support cross-border supply chain collaboration and innovation networks regionally.
To know more about the market opportunities by region and country, click here to
Buy The Complete Report
Increasing Consumer Environmental Awareness
Supportive Regulatory Frameworks Worldwide
Higher Production And Material Costs
Insufficient Recycling Infrastructure
Request Free Customization of this report to help us to meet your business objectives.
Competitive landscape is fragmented and intensifying as legacy consumer goods firms, specialist scaleups and deep tech entrants compete on circularity, traceability and low carbon inputs. Drivers tied to competition include corporate M&A for niche sustainable brands, strategic partnerships to deploy take back systems, and tech innovation such as AI sorting and precision fermentation to shorten time to market and control quality.
Top Player’s Company Profile
Recent Developments
SkyQuest’s ABIRAW (Advanced Business Intelligence, Research & Analysis Wing) is our Business Information Services team that Collects, Collates, Correlates, and Analyses the Data collected by means of Primary Exploratory Research backed by robust Secondary Desk research. As per SkyQuest analysis, the global sustainable products market is being propelled primarily by rising consumer demand for environmental responsibility while supportive regulatory frameworks further accelerate adoption and corporate procurement commitments create predictable demand. However higher production and material costs remain a material restraint that limits price competitiveness and scale. Europe remains the dominating region given its cohesive policy environment and mature industrial base, and the Fully Autonomous Robots (AI & Sensor-driven) segment dominates because advanced automation delivers precision, resource efficiency and scalable lifecycle benefits. Continued investment in traceability and circular packaging presents near-term opportunities for manufacturers and service providers.
| Report Metric | Details |
|---|---|
| Market size value in 2024 | USD 212.4 Billion |
| Market size value in 2033 | USD 215.4 Billion |
| Growth Rate | 15.6% |
| Base year | 2024 |
| Forecast period | (2026-2033) |
| Forecast Unit (Value) | USD Billion |
| Segments covered |
|
| Regions covered | North America (US, Canada), Europe (Germany, France, United Kingdom, Italy, Spain, Rest of Europe), Asia Pacific (China, India, Japan, Rest of Asia-Pacific), Latin America (Brazil, Rest of Latin America), Middle East & Africa (South Africa, GCC Countries, Rest of MEA) |
| Companies covered |
|
| Customization scope | Free report customization with purchase. Customization includes:-
|
To get a free trial access to our platform which is a one stop solution for all your data requirements for quicker decision making. This platform allows you to compare markets, competitors who are prominent in the market, and mega trends that are influencing the dynamics in the market. Also, get access to detailed SkyQuest exclusive matrix.
Table Of Content
Executive Summary
Market overview
Parent Market Analysis
Market overview
Market size
KEY MARKET INSIGHTS
COVID IMPACT
MARKET DYNAMICS & OUTLOOK
Market Size by Region
KEY COMPANY PROFILES
Methodology
For the Sustainable Products Market, our research methodology involved a mixture of primary and secondary data sources. Key steps involved in the research process are listed below:
1. Information Procurement: This stage involved the procurement of Market data or related information via primary and secondary sources. The various secondary sources used included various company websites, annual reports, trade databases, and paid databases such as Hoover's, Bloomberg Business, Factiva, and Avention. Our team did 45 primary interactions Globally which included several stakeholders such as manufacturers, customers, key opinion leaders, etc. Overall, information procurement was one of the most extensive stages in our research process.
2. Information Analysis: This step involved triangulation of data through bottom-up and top-down approaches to estimate and validate the total size and future estimate of the Sustainable Products Market.
3. Report Formulation: The final step entailed the placement of data points in appropriate Market spaces in an attempt to deduce viable conclusions.
4. Validation & Publishing: Validation is the most important step in the process. Validation & re-validation via an intricately designed process helped us finalize data points to be used for final calculations. The final Market estimates and forecasts were then aligned and sent to our panel of industry experts for validation of data. Once the validation was done the report was sent to our Quality Assurance team to ensure adherence to style guides, consistency & design.
Analyst Support
Customization Options
With the given market data, our dedicated team of analysts can offer you the following customization options are available for the Sustainable Products Market:
Product Analysis: Product matrix, which offers a detailed comparison of the product portfolio of companies.
Regional Analysis: Further analysis of the Sustainable Products Market for additional countries.
Competitive Analysis: Detailed analysis and profiling of additional Market players & comparative analysis of competitive products.
Go to Market Strategy: Find the high-growth channels to invest your marketing efforts and increase your customer base.
Innovation Mapping: Identify racial solutions and innovation, connected to deep ecosystems of innovators, start-ups, academics, and strategic partners.
Category Intelligence: Customized intelligence that is relevant to their supply Markets will enable them to make smarter sourcing decisions and improve their category management.
Public Company Transcript Analysis: To improve the investment performance by generating new alpha and making better-informed decisions.
Social Media Listening: To analyze the conversations and trends happening not just around your brand, but around your industry as a whole, and use those insights to make better Marketing decisions.
REQUEST FOR SAMPLE
 REQUEST FREE CUSTOMIZATION


Want to customize this report? This report can be personalized according to your needs. Our analysts and industry experts will work directly with you to understand your requirements and provide you with customized data in a short amount of time. We offer $1000 worth of FREE customization at the time of purchase.
Feedback From Our Clients


 USA (+1) 351-333-4748

