Spectrometry Market Size, Share, and Growth Analysis

Global Spectrometry Market

Spectrometry Market By Type (Molecular Spectrometry, Atomic Spectrometry), By Product (Instrument, Consumables), By Application (Metabolomics, Pharmaceutical Analysis), By End User (Pharmaceutical & Biotechnology Companies, Research & Academic Institutes), By Region - Industry Forecast 2025-2032


Report ID: SQMIG35J2126 | Region: Global | Published Date: November, 2024
Pages: 211 |Tables: 89 |Figures: 71

Format - word format excel data power point presentation

Spectrometry Market Insights

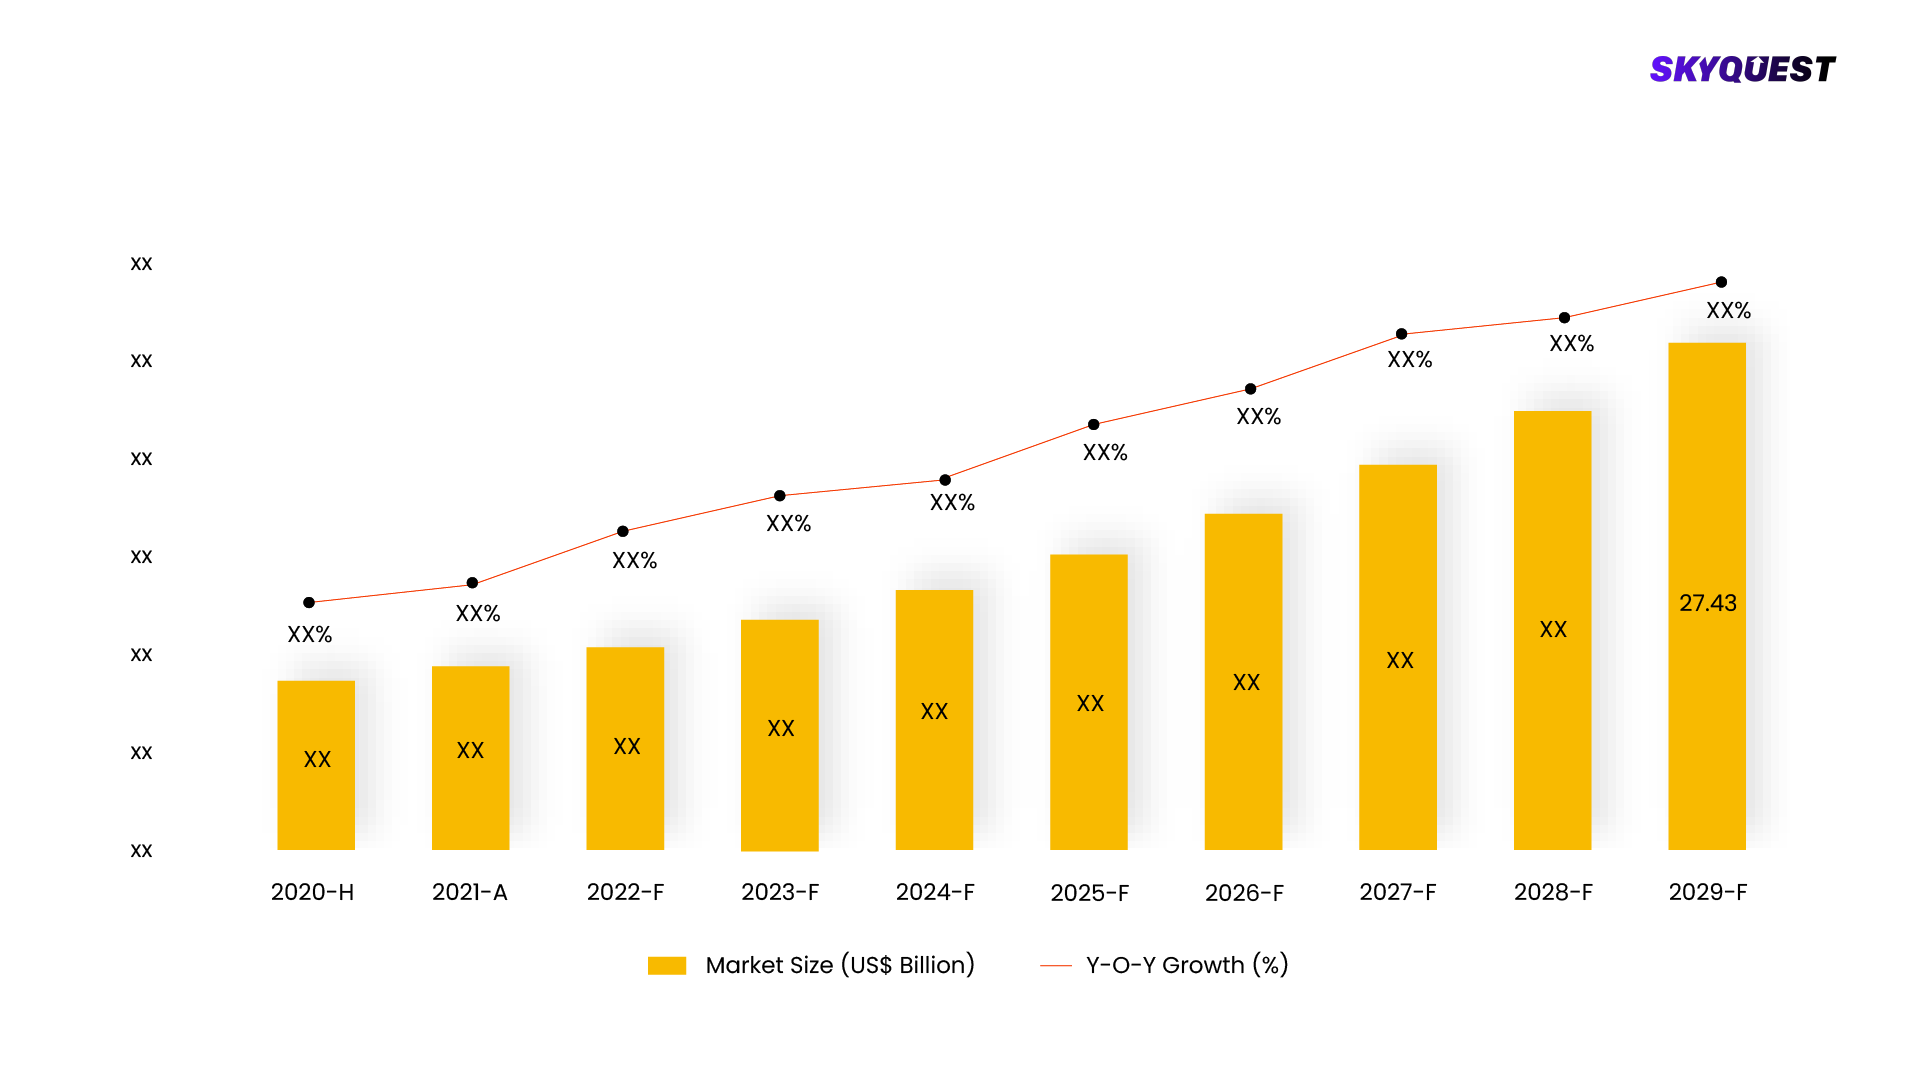
Spectrometry Market size was valued at USD 13.37 Billion in 2023 and is poised to grow from USD 14.33 Billion in 2024 to USD 32.47 Billion by 2032, growing at a CAGR of 7.2% during the forecast period (2025-2032).

Spectrometry is a far-reaching research domain which studies and analyzes the electromagnetic spectrum as a wavelength or frequency function produced during the interaction of electromagnetic radiation with matter. By ionizing and partitioning the sample under analysis, however, it becomes possible to identify specific substances: chemical compounds, impurities, contaminants, and pollutants. Many molecular, mass, and atomic spectroscopy techniques can be used to investigate a sample, depending on the needs and sample. The key factors propelling the growth of the global spectrometry market size, is the growing usage of spectrometry methods for drug testing, drug discovery, protein testing, raw material testing, quality assurance, and quality control of goods in the pharmaceutical and biotechnology sectors.

This is due to the application of mass spectrometry in pharmaceutical and biotechnological research operations is driving demand for personalized drugs, proteomics, metabolomics and genomics while mass spectrometry is playing a big role in expanding these regions. It is enabling new possibilities for enhanced diagnosis, discovering biomarkers and detecting diseases thereby changing forever the face of both healthcare and medical research. Moreover, the US Food and Drug Administration (USFDA) has increased the use of these spectrometry equipment by introducing strict guidelines for detecting hazardous substances (metals such as arsenic, lead, and mercury) in food and drinking water. However, as technology advances, industry participants are compelled to develop new goods and raise the volume of cloud-based data required for analysis.

Market snapshot - 2025-2032

Global Market Size

USD 13.37 Billion

Largest Segment

Molecular Spectrometry

Fastest Growth

Atomic Spectrometry

Growth Rate

7.2% CAGR

Global Spectrometry Market ($ Bn)
Country Share by North America (%)

To get more reports on the above market click here to Buy The Report

Spectrometry Market Segments Analysis

Global Spectrometry Market is segmented by Type, Product, Application, End use, and region. Based on Type, the market is segmented into Molecular Spectrometry, Mass Spectrometry and Atomic Spectrometry. Based on Product, the market is segmented into Instrument, Consumables, Services. Based on Application, the market is segmented into Proteomics, Metabolomics, Pharmaceutical Analysis, Forensic Analysis, Others. Based on end use, the market is segmented into Government & Academic Institutions, Pharmaceutical & Biotechnology Companies, Others. Based on region, the market is segmented into North America, Europe, Asia Pacific, Latin America and Middle East & and Africa. 

Analysis by Type

As per categorization by type, the market is classified as molecular spectrometry, mass spectrometry and atomic spectrometry. Among these, molecular spectrometry earned the largest share and continues to dominate the market. Molecular analysts have taken over the entire world's system of spectrometry, as they can do molecular structure analysis in a very precise way. It is the most versatile technological approach as it can be used in various sectors like chemicals, health care and food production; thus, making a positive impact on growth of this economy.

Owing to its remarkable sensitivity and precision in detecting trace elements, atomic spectrometry is expected to be the fastest-growing segment of the global spectrometry market. Increased regulatory demands for accurate elemental analysis have contributed to its expanding application in regions such as environmental analysis, pharmaceuticals as well as materials science. Besides, improvements in atomic spectrometry technologies have further improved its efficiency and capabilities, spurring on increased use across different industries thus promoting growth of the market at a faster rate.

Analysis by End User

Research and academic institutes are pivotal in the global spectrometry market, driving innovation with cutting-edge technologies and methodologies. Market expansion in different research fields is made possible by their focus on promoting scientific understanding while improving measurement methods with new techniques which therefore foster technological growth.

Pharmaceutical and biotechnology companies are poised to be the fastest-growing segment in the global spectrometry market due to their increasing reliance on spectrometry for drug development, quality control, and biomolecular analysis. The huge demand for personalized medicine, strict regulation standards, and requirement for accurate molecular editing are what is making them more popular. By that time, it was widely believed that the advanced technologies in spectrometry which were being developed would be able to improve their analytical abilities thus accelerating their development towards more difficult issues related to drug manufacturing and biotechnology.

Global Spectrometry Market By Type (%)

To get detailed analysis on other segments, Request For Free Sample Report

Spectrometry Market Regional Insights

The global spectrometry market is mostly led by North America due to the associative features of its research structures, better scientific and technological investments and the establishment of the various pharmaceutical and biotechnology industries. The region has maintained its leading role mainly as it attracts a lot of money in terms of research and development funding, possesses strong academic institutions and has many spectrometry equipment manufacturers. Also, stringiest directives and an increase focus on precision therapy plus monitoring of the ecosystem trigger a need for advanced spectrometry solutions. As such, North America continues to command great market share as it has major participants in this industry, as well as breakthrough inventions on going in spectrometry and other related sciences.

The growth rate of the European spectrometry market is the highest in the world owing to its strong focus on research and innovation in different fields of science. Substantial investments made into health care, environmental monitoring and materials sciences in the region increase demand for advanced spectrometric technologies. Besides this, Europe's enabling regulatory environment together with various collaborative research initiatives enhance market expansion. The rapid growth of spectrometry market in Africa is also fueled by existence of several academic institutions and research organizations, as well as a growing embrace of precision medicine and adoption of stricter quality control standards within the pharmaceutical industry.

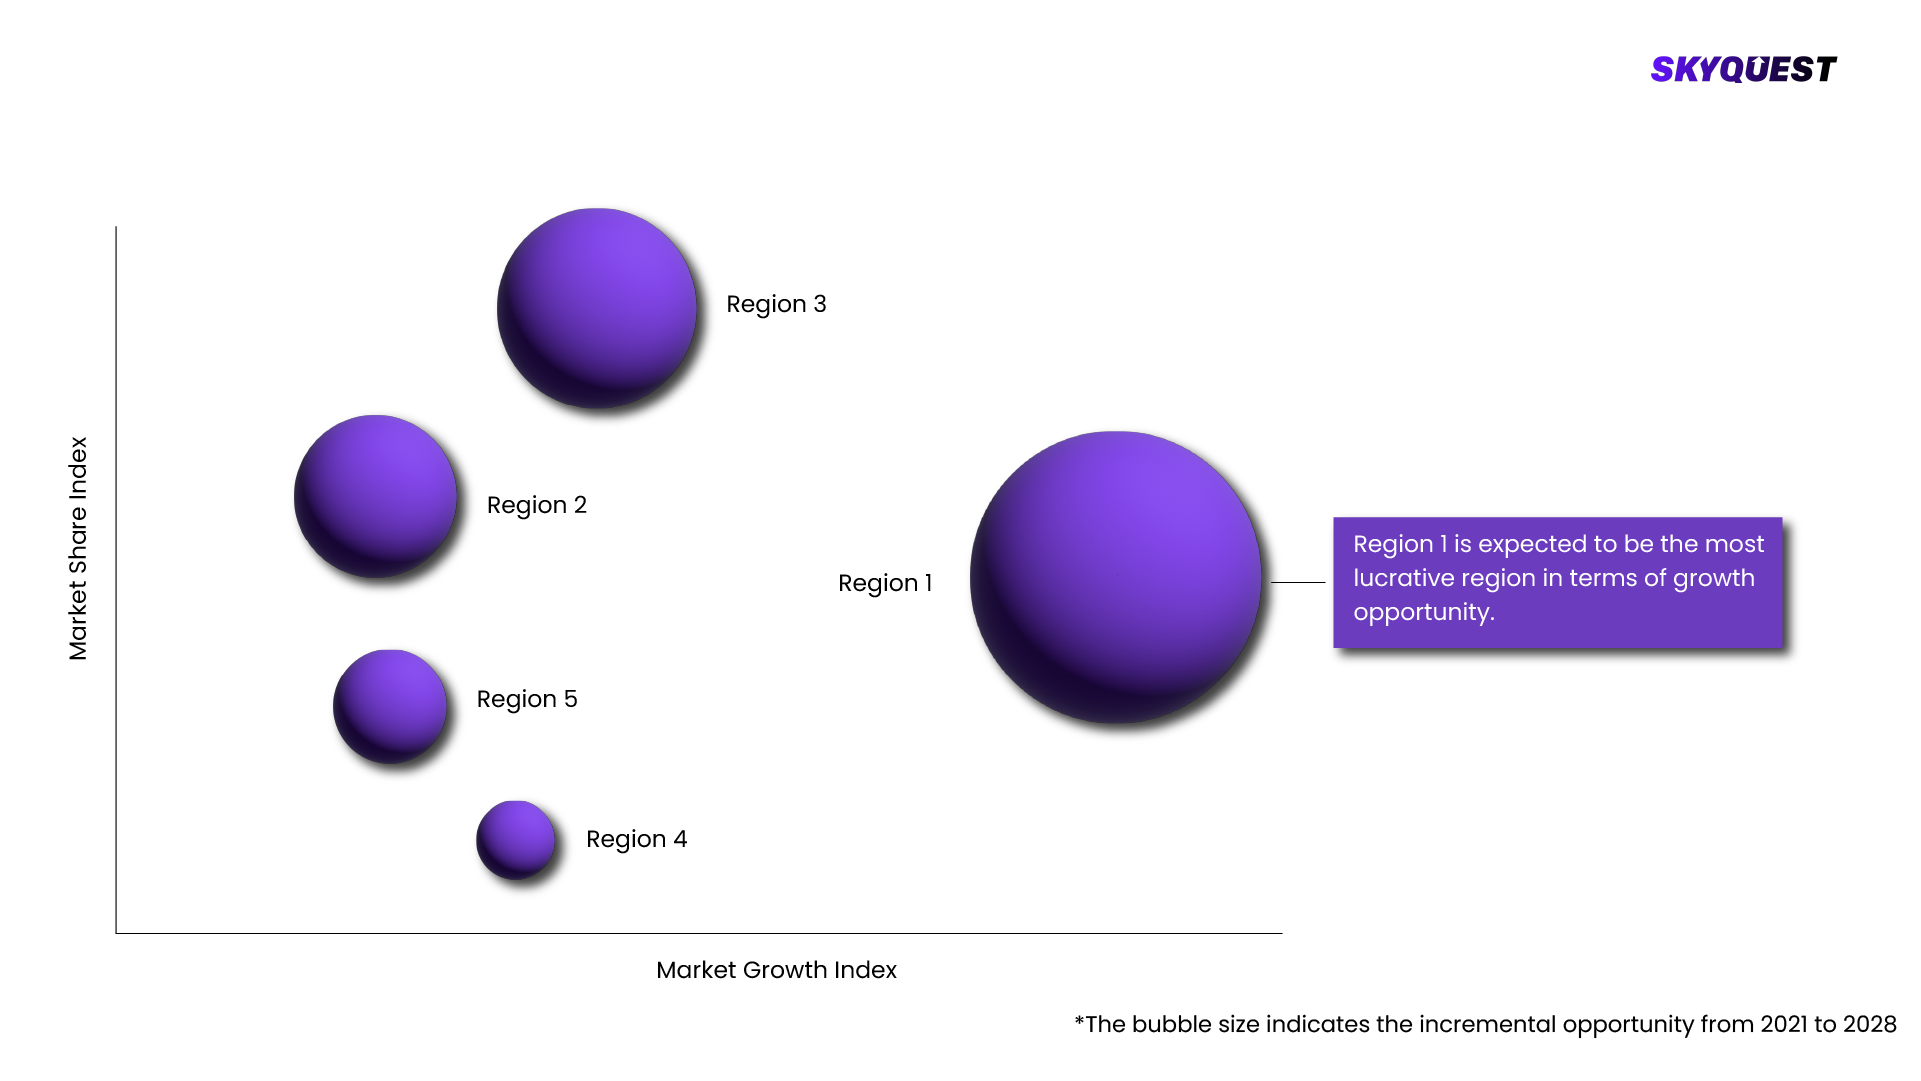
Global Spectrometry Market By Geography
  • Largest
  • Fastest

To know more about the market opportunities by region and country, click here to
Buy The Complete Report

Spectrometry Market Dynamics

Drivers

Technological Advancements

  • Global spectrometry market is essentially driven by the continuous advancements in spectrometry technology like advanced data analysis software and high-resolution instruments which help to improve upon accuracy, sensitivity and speed making it even more versatile and indispensable across a wide range of applications including pharmaceuticals as well as environmental analysis.

Rising Demand for Precision Medicine

  • The growing emphasis on personalized and precision medicine fuels the global spectrometry market. Spectrometry's ability to provide detailed molecular and elemental analysis supports the development of tailored therapies and diagnostics, meeting the increasing need for precise, individualized healthcare solutions and advancing research in biotechnology and pharmaceuticals.

Restraints

High Costs of Equipment

  • Costly advanced spectrometric tool and maintaining can be a big limit for the market. In smaller laboratories and institutions, those who rely on this costly equipment may not use it promoting slow growth or evenblocking widespread acceptance within the industry.

Complexity of Operation

  • The barrier could be complex and sophisticated training in spectrometry instruments. Without proper use of these complicated machines training and skill development would be paramount. As such, many smaller companies or inexperienced individuals may find themselves receiving knowledge that is too advanced for them; leading to frustration at their inability to use it successfully.

Request Free Customization of this report to help us to meet your business objectives.

Spectrometry Market Competitive Landscape

The global spectrometry market is very much characterized by the presence of both well-known players and innovative newcomers. Advanced spectrometry solutions to dominate the landscape include Thermo Fisher Scientific, Agilent Technologies, PerkinElmer and Waters Corporation. These firms drive market growth through continuous innovation, strategic partnerships, and extensive product portfolios, enhancing their capabilities in analytical precision and expanding their global reach. The competitive environment is shaped by technological advancements and increasing demand across various industries.

Top Players in Spectrometry Market

  • Thermo Fisher Scientific  
  • Agilent Technologies  
  • PerkinElmer  
  • Waters Corporation  
  • Bruker Corporation  
  • Horiba Ltd.  
  • JEOL Ltd.  
  • Shimadzu Corporation  
  • Mettler-Toledo International Inc.  
  • ABB Ltd.  
  • Rigaku Corporation  
  • Malvern Panalytical  
  • Oxford Instruments plc  
  • SPEX SamplePrep  
  • StellarNet Inc.  
  • FLIR Systems, Inc. 
  • Endress+Hauser Group 
  • Biotage AB 
  • LECO Corporation 
  • MKS Instruments, Inc.

Recent Developments

  • In August 2024, the new mass spectrometer from Thermo Fisher Scientific is called the Orbitrap Eclipse which was launched with improved resolution and sensitivity to analyze complex molecules. It is aimed at making proteomics and metabolomics research more accurate, giving an opportunity for biomolecular researchers to have access to better quality information that can hence be used in different drugs and biotechnological aspects.
  • In July 2024, Agilent Technologies introduced its latest series of LC-MS systems, featuring advanced ion mobility spectrometry. Particularly in drug discovery and environmental testing, this innovation improves the separation and analysis of complex mixtures. While solving the need for precise analytical solutions today, the new systems enhance throughput and sensitivity.
  • In September 2024, Bruker Corporation unveiled the new S2 PICOFOX X-ray fluorescence (XRF) spectrometer, designed for high-precision trace element analysis. This development provides exceptional performance in geological and environmental applications, enabling detailed elemental analysis with lower detection limits, thus supporting advanced research and quality control processes.

Spectrometry Key Market Trends

Spectrometry Market SkyQuest Analysis

SkyQuest's ABIRAW (Advanced Business Intelligence, Research & Analysis Wing) is our Business Information Services team that Collects, Collates, Correlates, and Analyses the Data collected by means of Primary Exploratory Research backed by robust Secondary Desk research.

As per SkyQuest analysis, in a nutshell the global spectrometry market is experiencing remarkable expansion due to enhanced technologies and growing demand from within different industries. The introduction of advanced devices with high resolution and incorporation of artificial intelligence into them boosts analytical prowess as well as effectiveness, while more emphasis on precision medicine, and tougher rules are pushing this market beyond its limits.

The market is still growing as it is dynamic in nature and involves important players like Thermo Fisher Scientific and Agilent Technologies, even if there are challenges such as expensive equipment and complex operations. The dominance of North America and fast expansion of Europe indicate that they have made high investments and done a lot of research in this region.

Report Metric Details
Market size value in 2023 USD 13.37 Billion
Market size value in 2032 USD 32.47 Billion
Growth Rate 7.2%
Base year 2024
Forecast period 2025-2032
Forecast Unit (Value) USD Billion
Segments covered
  • Type
    • Molecular Spectrometry (Visible and Ultraviolet Spectroscopy
    • Infrared Spectroscopy
    • Nuclear Magnetic Resonance (NMR) Spectroscopy
    • Others)
    • Mass Spectrometry (MALDI-TOF
    • Triple Quadrupole
    • Quadrupole-Trap
    • Hybrid Linear Ion Trap Orbitrap
    • Quadrupole-Orbitrap)
    • Atomic Spectrometry (Atomic Absorption Spectroscopy (AAS)
    • Atomic Emission Spectroscopy (AES)
    • Atomic Fluorescence Spectroscopy (AFS)
    • X-ray Fluorescence (XRF)
    • Inorganic Mass Spectroscopy)
  • Product
    • Instrument
    • Consumables
    • Services
  • Application
    • Proteomics
    • Metabolomics
    • Pharmaceutical Analysis
    • Forensic Analysis
    • Others
  • End-use
    • Government & Academic Institutions
    • Pharmaceutical & Biotechnology Companies
    • Others
Regions covered North America (US, Canada), Europe (Germany, France, United Kingdom, Italy, Spain, Rest of Europe), Asia Pacific (China, India, Japan, Rest of Asia-Pacific), Latin America (Brazil, Rest of Latin America), Middle East & Africa (South Africa, GCC Countries, Rest of MEA)
Companies covered
  • Thermo Fisher Scientific  
  • Agilent Technologies  
  • PerkinElmer  
  • Waters Corporation  
  • Bruker Corporation  
  • Horiba Ltd.  
  • JEOL Ltd.  
  • Shimadzu Corporation  
  • Mettler-Toledo International Inc.  
  • ABB Ltd.  
  • Rigaku Corporation  
  • Malvern Panalytical  
  • Oxford Instruments plc  
  • SPEX SamplePrep  
  • StellarNet Inc.  
  • FLIR Systems, Inc. 
  • Endress+Hauser Group 
  • Biotage AB 
  • LECO Corporation 
  • MKS Instruments, Inc.
Customization scope

Free report customization with purchase. Customization includes:-

  • Segments by type, application, etc
  • Company profile
  • Market dynamics & outlook
  • Region

To get a free trial access to our platform which is a one stop solution for all your data requirements for quicker decision making. This platform allows you to compare markets, competitors who are prominent in the market, and mega trends that are influencing the dynamics in the market. Also, get access to detailed SkyQuest exclusive matrix.

Buy The Complete Report to read the analyzed strategies adopted by the top vendors either to retain or gain market share

Table Of Content

Executive Summary

Market overview

  • Exhibit: Executive Summary – Chart on Market Overview
  • Exhibit: Executive Summary – Data Table on Market Overview
  • Exhibit: Executive Summary – Chart on Spectrometry Market Characteristics
  • Exhibit: Executive Summary – Chart on Market by Geography
  • Exhibit: Executive Summary – Chart on Market Segmentation
  • Exhibit: Executive Summary – Chart on Incremental Growth
  • Exhibit: Executive Summary – Data Table on Incremental Growth
  • Exhibit: Executive Summary – Chart on Vendor Market Positioning

Parent Market Analysis

Market overview

Market size

  • Market Dynamics
    • Exhibit: Impact analysis of DROC, 2021
      • Drivers
      • Opportunities
      • Restraints
      • Challenges
  • SWOT Analysis

KEY MARKET INSIGHTS

  • Technology Analysis
    • (Exhibit: Data Table: Name of technology and details)
  • Pricing Analysis
    • (Exhibit: Data Table: Name of technology and pricing details)
  • Supply Chain Analysis
    • (Exhibit: Detailed Supply Chain Presentation)
  • Value Chain Analysis
    • (Exhibit: Detailed Value Chain Presentation)
  • Ecosystem Of the Market
    • Exhibit: Parent Market Ecosystem Market Analysis
    • Exhibit: Market Characteristics of Parent Market
  • IP Analysis
    • (Exhibit: Data Table: Name of product/technology, patents filed, inventor/company name, acquiring firm)
  • Trade Analysis
    • (Exhibit: Data Table: Import and Export data details)
  • Startup Analysis
    • (Exhibit: Data Table: Emerging startups details)
  • Raw Material Analysis
    • (Exhibit: Data Table: Mapping of key raw materials)
  • Innovation Matrix
    • (Exhibit: Positioning Matrix: Mapping of new and existing technologies)
  • Pipeline product Analysis
    • (Exhibit: Data Table: Name of companies and pipeline products, regional mapping)
  • Macroeconomic Indicators

COVID IMPACT

  • Introduction
  • Impact On Economy—scenario Assessment
    • Exhibit: Data on GDP - Year-over-year growth 2016-2022 (%)
  • Revised Market Size
    • Exhibit: Data Table on Spectrometry Market size and forecast 2021-2027 ($ million)
  • Impact Of COVID On Key Segments
    • Exhibit: Data Table on Segment Market size and forecast 2021-2027 ($ million)
  • COVID Strategies By Company
    • Exhibit: Analysis on key strategies adopted by companies

MARKET DYNAMICS & OUTLOOK

  • Market Dynamics
    • Exhibit: Impact analysis of DROC, 2021
      • Drivers
      • Opportunities
      • Restraints
      • Challenges
  • Regulatory Landscape
    • Exhibit: Data Table on regulation from different region
  • SWOT Analysis
  • Porters Analysis
    • Competitive rivalry
      • Exhibit: Competitive rivalry Impact of key factors, 2021
    • Threat of substitute products
      • Exhibit: Threat of Substitute Products Impact of key factors, 2021
    • Bargaining power of buyers
      • Exhibit: buyers bargaining power Impact of key factors, 2021
    • Threat of new entrants
      • Exhibit: Threat of new entrants Impact of key factors, 2021
    • Bargaining power of suppliers
      • Exhibit: Threat of suppliers bargaining power Impact of key factors, 2021
  • Skyquest special insights on future disruptions
    • Political Impact
    • Economic impact
    • Social Impact
    • Technical Impact
    • Environmental Impact
    • Legal Impact

Market Size by Region

  • Chart on Market share by geography 2021-2027 (%)
  • Data Table on Market share by geography 2021-2027(%)
  • North America
    • Chart on Market share by country 2021-2027 (%)
    • Data Table on Market share by country 2021-2027(%)
    • USA
      • Exhibit: Chart on Market share 2021-2027 (%)
      • Exhibit: Market size and forecast 2021-2027 ($ million)
    • Canada
      • Exhibit: Chart on Market share 2021-2027 (%)
      • Exhibit: Market size and forecast 2021-2027 ($ million)
  • Europe
    • Chart on Market share by country 2021-2027 (%)
    • Data Table on Market share by country 2021-2027(%)
    • Germany
      • Exhibit: Chart on Market share 2021-2027 (%)
      • Exhibit: Market size and forecast 2021-2027 ($ million)
    • Spain
      • Exhibit: Chart on Market share 2021-2027 (%)
      • Exhibit: Market size and forecast 2021-2027 ($ million)
    • France
      • Exhibit: Chart on Market share 2021-2027 (%)
      • Exhibit: Market size and forecast 2021-2027 ($ million)
    • UK
      • Exhibit: Chart on Market share 2021-2027 (%)
      • Exhibit: Market size and forecast 2021-2027 ($ million)
    • Rest of Europe
      • Exhibit: Chart on Market share 2021-2027 (%)
      • Exhibit: Market size and forecast 2021-2027 ($ million)
  • Asia Pacific
    • Chart on Market share by country 2021-2027 (%)
    • Data Table on Market share by country 2021-2027(%)
    • China
      • Exhibit: Chart on Market share 2021-2027 (%)
      • Exhibit: Market size and forecast 2021-2027 ($ million)
    • India
      • Exhibit: Chart on Market share 2021-2027 (%)
      • Exhibit: Market size and forecast 2021-2027 ($ million)
    • Japan
      • Exhibit: Chart on Market share 2021-2027 (%)
      • Exhibit: Market size and forecast 2021-2027 ($ million)
    • South Korea
      • Exhibit: Chart on Market share 2021-2027 (%)
      • Exhibit: Market size and forecast 2021-2027 ($ million)
    • Rest of Asia Pacific
      • Exhibit: Chart on Market share 2021-2027 (%)
      • Exhibit: Market size and forecast 2021-2027 ($ million)
  • Latin America
    • Chart on Market share by country 2021-2027 (%)
    • Data Table on Market share by country 2021-2027(%)
    • Brazil
      • Exhibit: Chart on Market share 2021-2027 (%)
      • Exhibit: Market size and forecast 2021-2027 ($ million)
    • Rest of South America
      • Exhibit: Chart on Market share 2021-2027 (%)
      • Exhibit: Market size and forecast 2021-2027 ($ million)
  • Middle East & Africa (MEA)
    • Chart on Market share by country 2021-2027 (%)
    • Data Table on Market share by country 2021-2027(%)
    • GCC Countries
      • Exhibit: Chart on Market share 2021-2027 (%)
      • Exhibit: Market size and forecast 2021-2027 ($ million)
    • South Africa
      • Exhibit: Chart on Market share 2021-2027 (%)
      • Exhibit: Market size and forecast 2021-2027 ($ million)
    • Rest of MEA
      • Exhibit: Chart on Market share 2021-2027 (%)
      • Exhibit: Market size and forecast 2021-2027 ($ million)

KEY COMPANY PROFILES

  • Competitive Landscape
    • Total number of companies covered
      • Exhibit: companies covered in the report, 2021
    • Top companies market positioning
      • Exhibit: company positioning matrix, 2021
    • Top companies market Share
      • Exhibit: Pie chart analysis on company market share, 2021(%)

Methodology

For the Spectrometry Market, our research methodology involved a mixture of primary and secondary data sources. Key steps involved in the research process are listed below:

1. Information Procurement: This stage involved the procurement of Market data or related information via primary and secondary sources. The various secondary sources used included various company websites, annual reports, trade databases, and paid databases such as Hoover's, Bloomberg Business, Factiva, and Avention. Our team did 45 primary interactions Globally which included several stakeholders such as manufacturers, customers, key opinion leaders, etc. Overall, information procurement was one of the most extensive stages in our research process.

2. Information Analysis: This step involved triangulation of data through bottom-up and top-down approaches to estimate and validate the total size and future estimate of the Spectrometry Market.

3. Report Formulation: The final step entailed the placement of data points in appropriate Market spaces in an attempt to deduce viable conclusions.

4. Validation & Publishing: Validation is the most important step in the process. Validation & re-validation via an intricately designed process helped us finalize data points to be used for final calculations. The final Market estimates and forecasts were then aligned and sent to our panel of industry experts for validation of data. Once the validation was done the report was sent to our Quality Assurance team to ensure adherence to style guides, consistency & design.

Analyst Support

Customization Options

With the given market data, our dedicated team of analysts can offer you the following customization options are available for the Spectrometry Market:

Product Analysis: Product matrix, which offers a detailed comparison of the product portfolio of companies.

Regional Analysis: Further analysis of the Spectrometry Market for additional countries.

Competitive Analysis: Detailed analysis and profiling of additional Market players & comparative analysis of competitive products.

Go to Market Strategy: Find the high-growth channels to invest your marketing efforts and increase your customer base.

Innovation Mapping: Identify racial solutions and innovation, connected to deep ecosystems of innovators, start-ups, academics, and strategic partners.

Category Intelligence: Customized intelligence that is relevant to their supply Markets will enable them to make smarter sourcing decisions and improve their category management.

Public Company Transcript Analysis: To improve the investment performance by generating new alpha and making better-informed decisions.

Social Media Listening: To analyze the conversations and trends happening not just around your brand, but around your industry as a whole, and use those insights to make better Marketing decisions.

$5,300

REQUEST FOR SAMPLE

Please verify that you're not a robot to proceed!
Want to customize this report? REQUEST FREE CUSTOMIZATION

FAQs

Spectrometry Market size was valued at USD 13.37 Billion in 2023 and is poised to grow from USD 14.33 Billion in 2024 to USD 32.47 Billion by 2032, growing at a CAGR of 7.2% during the forecast period (2025-2032).

The global spectrometry market is very much characterized by the presence of both well-known players and innovative newcomers. Advanced spectrometry solutions to dominate the landscape include Thermo Fisher Scientific, Agilent Technologies, PerkinElmer and Waters Corporation. These firms drive market growth through continuous innovation, strategic partnerships, and extensive product portfolios, enhancing their capabilities in analytical precision and expanding their global reach. The competitive environment is shaped by technological advancements and increasing demand across various industries. 'Thermo Fisher Scientific  ', 'Agilent Technologies  ', 'PerkinElmer  ', 'Waters Corporation  ', 'Bruker Corporation  ', 'Horiba Ltd.  ', 'JEOL Ltd.  ', 'Shimadzu Corporation  ', 'Mettler-Toledo International Inc.  ', 'ABB Ltd.  ', 'Rigaku Corporation  ', 'Malvern Panalytical  ', 'Oxford Instruments plc  ', 'SPEX SamplePrep  ', 'StellarNet Inc.  ', 'FLIR Systems, Inc. ', 'Endress+Hauser Group ', 'Biotage AB ', 'LECO Corporation ', 'MKS Instruments, Inc.'

Global spectrometry market is essentially driven by the continuous advancements in spectrometry technology like advanced data analysis software and high-resolution instruments which help to improve upon accuracy, sensitivity and speed making it even more versatile and indispensable across a wide range of applications including pharmaceuticals as well as environmental analysis.

Growing Demand for High-Resolution Spectrometry: Due to the rising need for exact molecular and elemental analyzations in pharmaceuticals, environmental monitoring and materials science, there has been a growing demand for high-resolution instruments in global spectrometry market orders. Advanced research applications benefit from enhanced resolution capabilities that improve data accuracy.

The global spectrometry market is mostly led by North America due to the associative features of its research structures, better scientific and technological investments and the establishment of the various pharmaceutical and biotechnology industries. The region has maintained its leading role mainly as it attracts a lot of money in terms of research and development funding, possesses strong academic institutions and has many spectrometry equipment manufacturers. Also, stringiest directives and an increase focus on precision therapy plus monitoring of the ecosystem trigger a need for advanced spectrometry solutions. As such, North America continues to command great market share as it has major participants in this industry, as well as breakthrough inventions on going in spectrometry and other related sciences.

Want to customize this report? This report can be personalized according to your needs. Our analysts and industry experts will work directly with you to understand your requirements and provide you with customized data in a short amount of time. We offer $1000 worth of FREE customization at the time of purchase.

AGC3x.webp
Aisin3x.webp
ASKA P Co. LTD3x.webp
BD3x.webp
BILL & MELIDA3x.webp
BOSCH3x.webp
CHUNGHWA TELECOM3x.webp
DAIKIN3x.webp
DEPARTMENT OF SCIENCE & TECHNOLOGY3x.webp
ETRI3x.webp
Fiti Testing3x.webp
GERRESHEIMER3x.webp
HENKEL3x.webp
HITACHI3x.webp
HOLISTIC MEDICAL CENTRE3x.webp
Institute for information industry3x.webp
JAXA3x.webp
JTI3x.webp
Khidi3x.webp
METHOD.3x.webp
Missul E&S3x.webp
MITSUBISHI3x.webp
MIZUHO3x.webp
NEC3x.webp
Nippon steel3x.webp
NOVARTIS3x.webp
Nttdata3x.webp
OSSTEM3x.webp
PALL3x.webp
Panasonic3x.webp
RECKITT3x.webp
Rohm3x.webp
RR KABEL3x.webp
SAMSUNG ELECTRONICS3x.webp
SEKISUI3x.webp
Sensata3x.webp
SENSEAIR3x.webp
Soft Bank Group3x.webp
SYSMEX3x.webp
TERUMO3x.webp
TOYOTA3x.webp
UNDP3x.webp
Unilever3x.webp
YAMAHA3x.webp
Yokogawa3x.webp

Feedback From Our Clients

Global Spectrometry Market
Spectrometry Market

Report ID: SQMIG35J2126

[email protected]
USA +1 351-333-4748

BUY NOW GET FREE SAMPLE