Space Debris Monitoring and Removal Market Size, Share, Growth Analysis, By Debris Size Range (1mm to 1cm Debris Size, Greater than 10cm), By Orbit Type (Low Earth Orbit, Medium & Geostationary Earth Orbit), By End-use (Commercial, Defense), By Region - Industry Forecast 2024-2031


Report ID: SQMIG20A2268 | Region: Global | Published Date: November, 2024
Pages: 183 |Tables: 0 |Figures: 0

Space Debris Monitoring and Removal Market Insights

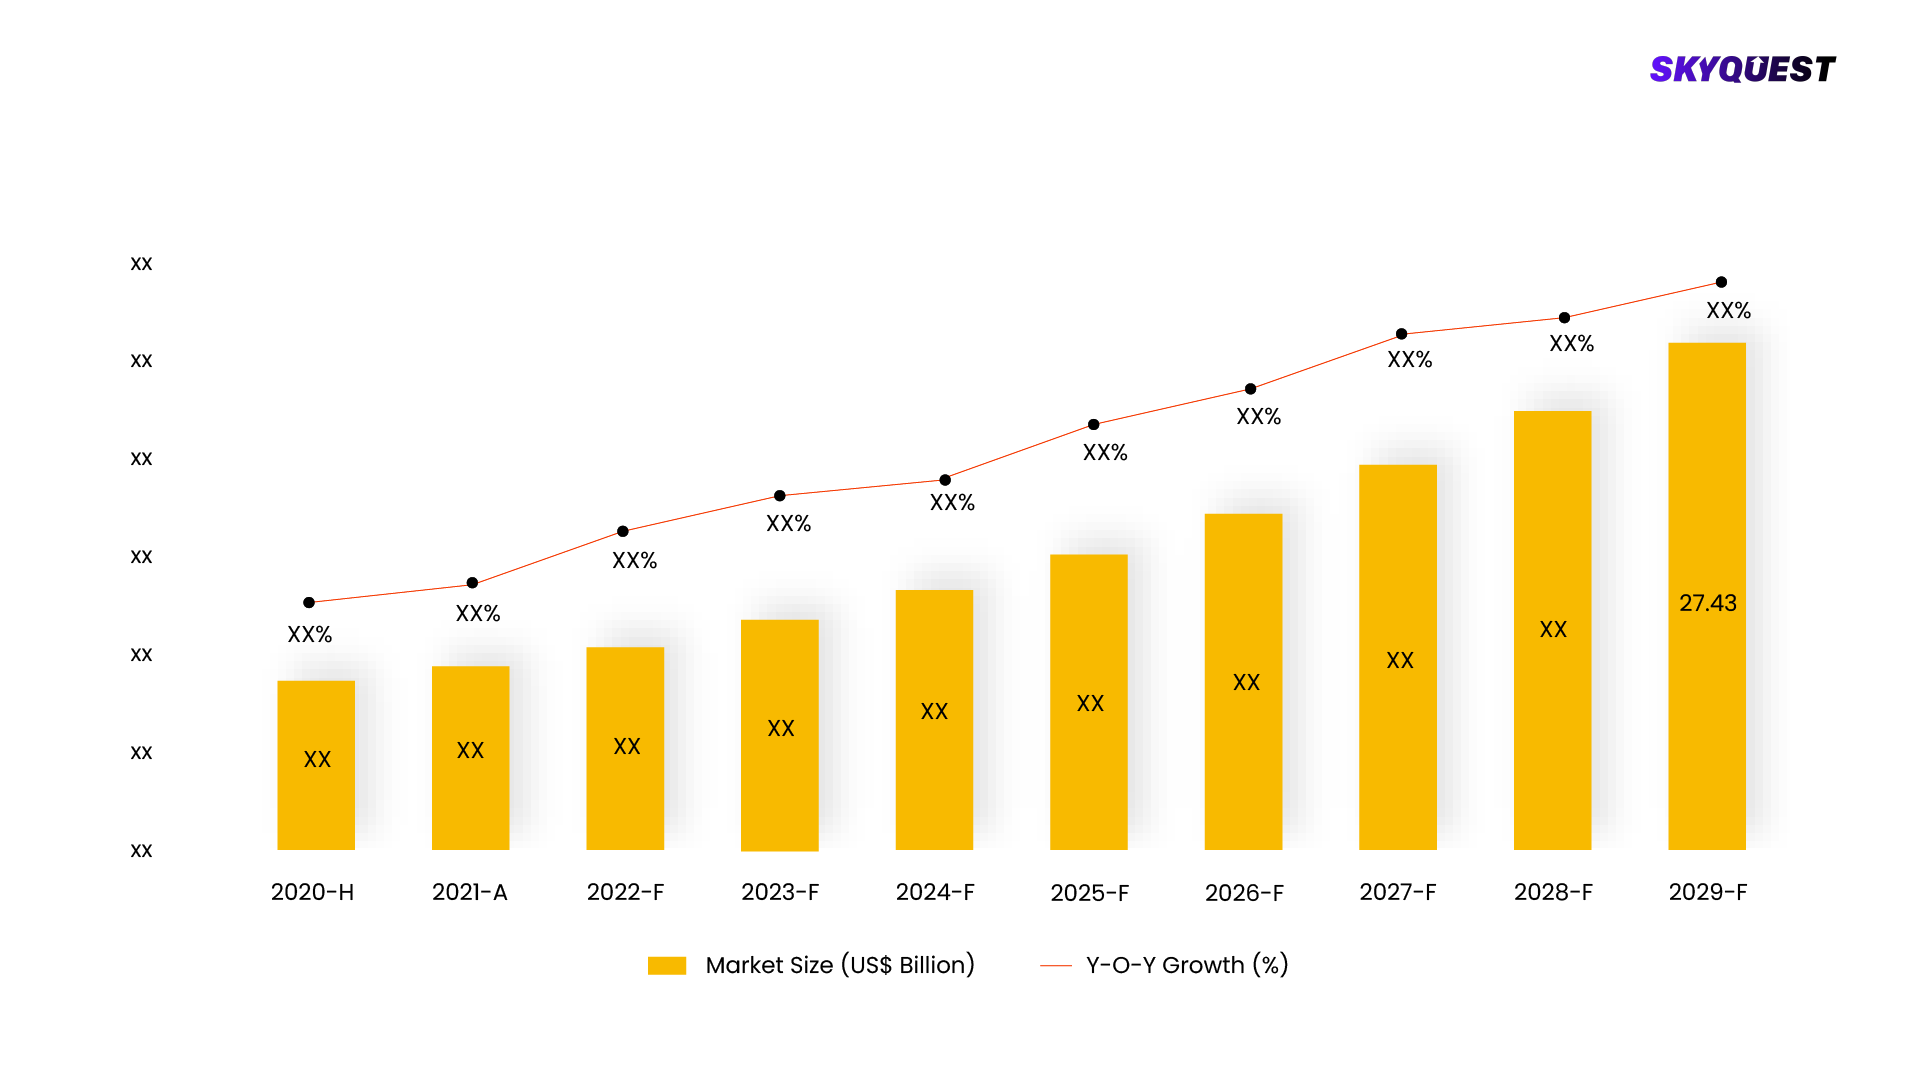
Global Space Debris Monitoring and Removal Market size was valued at USD 1.01 Billion in 2022 and is poised to grow from USD 1.08 Billion in 2023 to USD 1.75 Billion by 2031, growing at a CAGR of 7.15% in the forecast period (2024-2031).

Space debris monitoring and removal is a series of operations and systems that are needed to identify as well as limit the number of space debris or space junk in the orbit of Earth. It is important because, at present, the orbit of our planet is overcrowded with deceased satellites, rocket parts, lens caps, lens cover, gloves from previous spacewalks, and many other items made by people. Such debris is dangerous because they can hit operational satellites or spacecraft. Therefore, monitoring and removal are critical for maintaining space situational awareness and space sustainability. The rise in development costs and regulatory compliance concerning the international space regulations and agreement act as a significant barrier to the growth of the market across the globe. However, the rise in demand for space tourism and technological advancements create extensive room in the growth of space debris monitoring market during the given forecast period.

The exponential growth of space debris and its potential threat to operational satellites, space missions and space explorations in the future have resulted in the fact that many governments have initiated various policy frameworks and national strategies to reduce such a threat. It creates a basis for investment in the field of space debris mitigation and monitoring technologies. Many satellites that are now operating are relatively old, and most of them remain operational for up to 20-25 years. The situation contributes to the sources of space debris as the satellites contribute to the growth of this debris when they become defunct. In addition, satellites are at risk of derelict objects also end up being debris. In either case, the need to address this problem enhances the demand for monitoring, removal and end-of-life solutions.

Market Snapshot - (2024-2031)

Global Market Size

Largest Segment

Fastest Growth

Growth Rate

CAGR

Global Space Debris Monitoring and Removal Market ($ Bn)
Country Share for North America Region (%)

To get more reports on the above market click here to Buy The Report

Space Debris Monitoring and Removal Market Segmental Analysis

The Global Space Debris Monitoring and Removal Market is segmented into Debris Size Range, Orbit Type, End-use, and Regions. Based on Debris Size Range, the market is segmented into 1mm to 1cm Debris Size, 1cm to 10cm Debris Size, and Greater than 10cm. Based on Orbit Type, the market is segmented into Low Earth Orbit and Medium & Geostationary Earth Orbit. Based on End-use, the market is segmented into Commercial and Defense. Based on Region, the market is segmented into North America, Europe, Asia-Pacific, Latin America, and Middle East & Africa.

Analysis by Debris Size Range

Based on debris size, the 1mm to 1cm segment is dominating the market with the largest share. This is due to the increase in the number of rocket bodies and minor objects as a result of satellite launches world over. The As per the European Space Agency the number of objects that are orbiting around the Earth is more than 128 million. There are around 90,000 debris objects in the low Earth orbit and geosynchronous orbit. All these objects are becoming an obstacle for the satellites that are revolving around the earth. Hence, these debris will boost the demand for monitoring and removal demand significantly, increasing market growth.

The debris that are greater than 10 cm are experiencing the fastest growth in the market. The debris that is larger than 10 cm can range from defunct satellites and spent rocket stages to fragments resulting from satellite collisions or explosions. Monitoring systems are capable of tracking and cataloging debris in this size range, these systems can generally be divided into ground-based radars and space-based sensors. Space bombardment with larger-scale debris presents a serious hazard to operational satellites and spacecraft, because it is most likely to cause catastrophic collisions. Furthermore, removal missions for debris larger than 10 cm usually imply the deployment of specialized spacecraft to capture and deorbit dangerous objects.

Analysis by Orbit Type

In 2023, the Low Earth Orbit (LEO) segment had the highest market share and is expected to rise at the fastest pace during the forecast period. That is attributed to the fact that the leading market players’ focus on satellites’ development and With LEO being the most crowded sphere of the space and it is where the vast majority of the new devices are launched by SpaceX and OneWeb alongside many other big companies. The precise spot where the International Space Station is located is also in LEO. Since LEO is situated the closest to the Earth and can reach as much as 2,000 kilometers in the direction up, most of the debris is in this part of the space. LEO is the orbit that is most cluttered, hence it is expected to attract most of the demand for debris monitoring and removal market.

MEO and GEO are witnessing the fastest growth in the market. Satellites in Medium Earth Orbit (MEO) and Geostationary Earth Orbit (GEO) part of the space which is above LEO have a similar level of risk from space debris. This is important in view of the fact that some of the largest spacecrafts are positioned in these orbits. For example, the GEO communication satellites and MEO navigation systems, such as the U.S. GPS and European Galileo. Satellites operate in GEO because they appear to be always at the same location in the sky of a fixed point while it is impossible to de-orbit the satellite. Hence, satellites that are not used anymore and are placed in MEO and GEO is exponentially increasing the number of space debris which will boost the demand for monitoring and removal demand during the forecast period.

To get detailed analysis on other segments, Request For Free Sample Report

Space Debris Monitoring and Removal Market Regional Insights

North America was the dominant region in 2023 due to the imposition of strict rules by the US government regarding the sale and distribution of space-related goods and the increase in the number of space launches in the region. The United States is the leading potential regulator for the high impact of the business and existences of the International Traffic in Arms Regulations. It is a United States regulatory provision that governs the development, commerce, transfer, and utilization of defense and space-related commodities. The market players in the region are incurring high costs and facing stiff competition whenever they wish to transact business that does not comply with US policies. Therefore, the United States will come up with effective regulations to control space debris.

Europe is expected to witness the fastest market growth in the forecast period. The usage of satellites for military operations and a group of important stakeholders are entering into collaboration to address space debris and carry out many space operations contribute to the increased development of the region. Europe is expected to undergo development for many reasons, such as the increasing numbers of space exploration missions, the growing investment into space launches, major companies’ expansion to new locations, and governmental and charity organizations’ heavy presence in the market. The European Space Agency and many other agencies and organizations focusing on various space activities are crucial to the observation and removal of space debris.

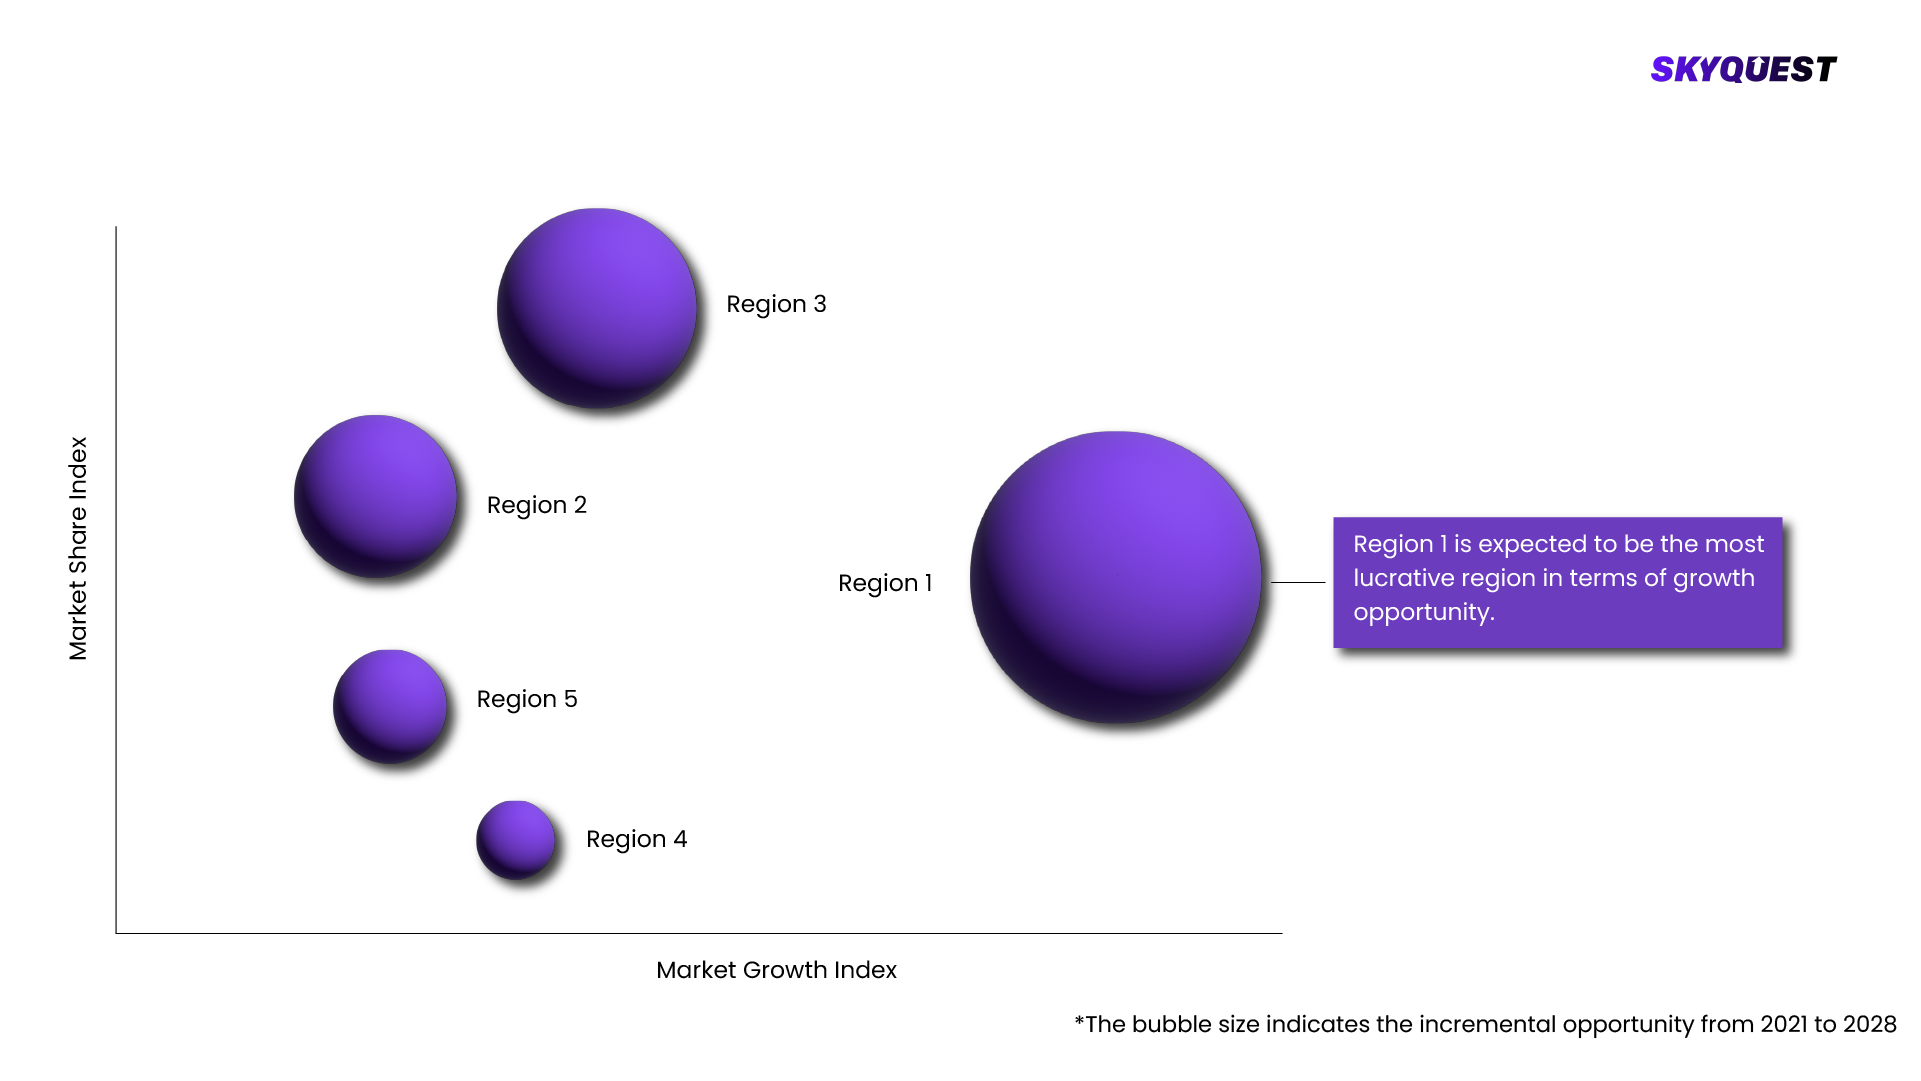
Global Space Debris Monitoring and Removal Market By Geography
  • Largest
  • Fastest

To know more about the market opportunities by region and country, click here to
Buy The Complete Report

Space Debris Monitoring and Removal Market Dynamics

Drivers

Increasing Space Activities and Growth in Commercial Space Activities

  • One of the key drivers for the market is the increasing number of space activities, such as satellite launches or space missions. As a result, more debris is expected to be observed. For this reason, it is critical to develop effective monitoring and removal solutions to make future space operations safe and sustainable.

Increasing Awareness and Regulatory Initiatives

  • Governments and space agencies have been addressing the issue of space debris through regulatory initiatives and guidelines. Such initiatives have been developed to ensure responsible space operations, minimize debris generation, and encourage the development of technologies for debris removal. In this way, the development of clear standards and guidelines helps create a framework within which debris monitoring and removal practices should be implemented.

Restraints

Limited Resources and Funding

  • Monitoring and removal of space debris implies a significant cost. Considerable expenses are related to the development and implementation of monitoring systems, including ground-based radars and space-based sensors. Subsequently, the development and operation of debris removal means, implying either active or passive approach, is further associated with high costs of spacecraft design, launch, and maneuvers. The mentioned costs make it challenging to ensure widespread monitoring and removal of space debris.

Different Types of Debris Makes the Monitoring and Removal Process Complicated

  • Space debris can be identified as a more modern challenge related to the concept of space. It is common knowledge that there are several significant objects, planks and other elements in space that cover specific ranges of areas. In most cases, this is instrumental and other equipment and technologies that have been lost by human resources and remain in orbit for a long period. Although this concept is not connected with human interference directly, it is still a potential threat to the concept of exploiting space and implementing new exploration initiatives.

Request Free Customization of this report to help us to meet your business objectives.

Space Debris Monitoring and Removal Market Competitive Landscape

Companies that engage in the removal of space debris are mandated to control the growing population of debris in space. Additionally, the companies are concerned with new product launches, patents, new technological tactical deployment and several other strategies. Rise in the awareness of space pollutants and increasing installation of satellites is the major factor expected to surge the growth of the global space debris monitoring market during the forecast period. The rising number of space tourists has helped the scientists to cater to the rising demand for the technology for monitoring space debris. Several companies have increased the budget of the R&D department to provide monitoring for the use of latest technologies such as coherent amplifying network lasers, and super wide field of view telescopes.

Top Player’s Company Profile 

  • Airbus S.A.S (Netherlands)
  • Astroscale (Netherlands)
  • ClearSpace (Switzerland)
  • Electro Optic Systems (Australia)
  • Lockheed Martin Corporation (U.S.)
  • Northrop Grumman Corporation (U.S.)
  • Orbit Guardians (U.S.)
  • Obruta (Canada)
  • Share my space (France)
  • Voyager Space Holdings Inc. (U.S.)

Recent Developments

  • In July 2023, Obruta Space Solutions corp. has received a contract by the Canadian Space Agency through the Space Technology Development Program for A Novel Multi-Target Space Debris Removal Technology Feasibility Study.
  • In May 2023, ClearSpace and Arianespace have signed the contract for the launch of the ClearSpace-1, the first active debris removal mission. It is able to capture and deorbit of a derelict space debris object of more than 100 kg.
  • In January 2022, Northrop Grumman Corporation has signed an agreement with the U.S. Space Force to develop a radar to track active satellites and debris in higher orbits. The contract’s amount is USD 341 million. Northrop’s radar will be situated in the Indo-Pacific region and will constitute one of the three planed ground-based radar sites for the DARC program.

Space Debris Monitoring and Removal Key Market Trends

  • Advancements in Tracking and Monitoring Technologies: Round-based radars, space-based sensors, and optical telescopes are becoming more sensitive and therefore able to track increasingly smaller debris parts, creating an increasingly comprehensive picture of their locations. This progress allows the growing population of debris to be consistently cataloged, providing valuable information for assessing the risk of future collisions and planning their removal.
  • Increasing Collaboration between Government and Private Sector: One of the most important trends in the space debris monitoring and removal market is the cooperation between space agencies, private companies, and research institutions. Partnerships and collaborations between these organizations enable the sharing of resources, expertise, and technologies, making monitoring and removal solutions more effective. In addition, international cooperation is important because of the need to develop global frameworks and standards for monitoring and removing space debris.

Space Debris Monitoring and Removal Market SkyQuest Analysis

SkyQuest’s ABIRAW (Advanced Business Intelligence, Research & Analysis Wing) is our Business Information Services team that Collects, Collates, Correlates, and Analyses the Data collected by means of Primary Exploratory Research backed by robust Secondary Desk research.

As per SkyQuest analysis, the Space Debris Monitoring and Removal market is projected to witness substantial growth, with increasing space activities especially from the commercial sector. International organizations, commercial enterprises, and governmental bodies are increasingly affecting the course of space debris cleanup. Public-private partnerships, such as the one created by NASA with commercial organizations, are made to share the risks, resources, and experience required for a more effective removal system. The latter helps generate improved debris removal systems more quickly and with lower costs, as well as motivates continuous development of technologies. Collaboration is vital for addressing the space debris problem and ensuring sustainable space functioning; this can be done by leveraging diverse expertise and encouraging innovation.

Report Metric Details
Market size value in 2022 USD 1.01 Billion
Market size value in 2031 USD 1.75 Billion
Growth Rate 7.15%
Base year 2023
Forecast period (2024-2031)
Forecast Unit (Value) USD Billion
Segments covered
  • Debris Size Range
    • 1mm to 1cm Debris Size, 1cm to 10cm Debris Size, and Greater than 10cm
  • Orbit Type
    • Low Earth Orbit and Medium & Geostationary Earth Orbit
  • End-use
    • Commercial and Defense
Regions covered North America (US, Canada), Europe (Germany, France, United Kingdom, Italy, Spain, Rest of Europe), Asia Pacific (China, India, Japan, Rest of Asia-Pacific), Latin America (Brazil, Rest of Latin America), Middle East & Africa (South Africa, GCC Countries, Rest of MEA)
Companies covered
  • Airbus S.A.S (Netherlands)
  • Astroscale (Netherlands)
  • ClearSpace (Switzerland)
  • Electro Optic Systems (Australia)
  • Lockheed Martin Corporation (U.S.)
  • Northrop Grumman Corporation (U.S.)
  • Orbit Guardians (U.S.)
  • Obruta (Canada)
  • Share my space (France)
  • Voyager Space Holdings Inc. (U.S.)
Customization scope

Free report customization with purchase. Customization includes:-

  • Segments by type, application, etc
  • Company profile
  • Market dynamics & outlook
  • Region

To get a free trial access to our platform which is a one stop solution for all your data requirements for quicker decision making. This platform allows you to compare markets, competitors who are prominent in the market, and mega trends that are influencing the dynamics in the market. Also, get access to detailed SkyQuest exclusive matrix.

Buy The Complete Report to read the analyzed strategies adopted by the top vendors either to retain or gain market share

Table Of Content

Executive Summary

Market overview

  • Exhibit: Executive Summary – Chart on Market Overview
  • Exhibit: Executive Summary – Data Table on Market Overview
  • Exhibit: Executive Summary – Chart on Space Debris Monitoring and Removal Market Characteristics
  • Exhibit: Executive Summary – Chart on Market by Geography
  • Exhibit: Executive Summary – Chart on Market Segmentation
  • Exhibit: Executive Summary – Chart on Incremental Growth
  • Exhibit: Executive Summary – Data Table on Incremental Growth
  • Exhibit: Executive Summary – Chart on Vendor Market Positioning

Parent Market Analysis

Market overview

Market size

  • Market Dynamics
    • Exhibit: Impact analysis of DROC, 2021
      • Drivers
      • Opportunities
      • Restraints
      • Challenges
  • SWOT Analysis

KEY MARKET INSIGHTS

  • Technology Analysis
    • (Exhibit: Data Table: Name of technology and details)
  • Pricing Analysis
    • (Exhibit: Data Table: Name of technology and pricing details)
  • Supply Chain Analysis
    • (Exhibit: Detailed Supply Chain Presentation)
  • Value Chain Analysis
    • (Exhibit: Detailed Value Chain Presentation)
  • Ecosystem Of the Market
    • Exhibit: Parent Market Ecosystem Market Analysis
    • Exhibit: Market Characteristics of Parent Market
  • IP Analysis
    • (Exhibit: Data Table: Name of product/technology, patents filed, inventor/company name, acquiring firm)
  • Trade Analysis
    • (Exhibit: Data Table: Import and Export data details)
  • Startup Analysis
    • (Exhibit: Data Table: Emerging startups details)
  • Raw Material Analysis
    • (Exhibit: Data Table: Mapping of key raw materials)
  • Innovation Matrix
    • (Exhibit: Positioning Matrix: Mapping of new and existing technologies)
  • Pipeline product Analysis
    • (Exhibit: Data Table: Name of companies and pipeline products, regional mapping)
  • Macroeconomic Indicators

COVID IMPACT

  • Introduction
  • Impact On Economy—scenario Assessment
    • Exhibit: Data on GDP - Year-over-year growth 2016-2022 (%)
  • Revised Market Size
    • Exhibit: Data Table on Space Debris Monitoring and Removal Market size and forecast 2021-2027 ($ million)
  • Impact Of COVID On Key Segments
    • Exhibit: Data Table on Segment Market size and forecast 2021-2027 ($ million)
  • COVID Strategies By Company
    • Exhibit: Analysis on key strategies adopted by companies

MARKET DYNAMICS & OUTLOOK

  • Market Dynamics
    • Exhibit: Impact analysis of DROC, 2021
      • Drivers
      • Opportunities
      • Restraints
      • Challenges
  • Regulatory Landscape
    • Exhibit: Data Table on regulation from different region
  • SWOT Analysis
  • Porters Analysis
    • Competitive rivalry
      • Exhibit: Competitive rivalry Impact of key factors, 2021
    • Threat of substitute products
      • Exhibit: Threat of Substitute Products Impact of key factors, 2021
    • Bargaining power of buyers
      • Exhibit: buyers bargaining power Impact of key factors, 2021
    • Threat of new entrants
      • Exhibit: Threat of new entrants Impact of key factors, 2021
    • Bargaining power of suppliers
      • Exhibit: Threat of suppliers bargaining power Impact of key factors, 2021
  • Skyquest special insights on future disruptions
    • Political Impact
    • Economic impact
    • Social Impact
    • Technical Impact
    • Environmental Impact
    • Legal Impact

Market Size by Region

  • Chart on Market share by geography 2021-2027 (%)
  • Data Table on Market share by geography 2021-2027(%)
  • North America
    • Chart on Market share by country 2021-2027 (%)
    • Data Table on Market share by country 2021-2027(%)
    • USA
      • Exhibit: Chart on Market share 2021-2027 (%)
      • Exhibit: Market size and forecast 2021-2027 ($ million)
    • Canada
      • Exhibit: Chart on Market share 2021-2027 (%)
      • Exhibit: Market size and forecast 2021-2027 ($ million)
  • Europe
    • Chart on Market share by country 2021-2027 (%)
    • Data Table on Market share by country 2021-2027(%)
    • Germany
      • Exhibit: Chart on Market share 2021-2027 (%)
      • Exhibit: Market size and forecast 2021-2027 ($ million)
    • Spain
      • Exhibit: Chart on Market share 2021-2027 (%)
      • Exhibit: Market size and forecast 2021-2027 ($ million)
    • France
      • Exhibit: Chart on Market share 2021-2027 (%)
      • Exhibit: Market size and forecast 2021-2027 ($ million)
    • UK
      • Exhibit: Chart on Market share 2021-2027 (%)
      • Exhibit: Market size and forecast 2021-2027 ($ million)
    • Rest of Europe
      • Exhibit: Chart on Market share 2021-2027 (%)
      • Exhibit: Market size and forecast 2021-2027 ($ million)
  • Asia Pacific
    • Chart on Market share by country 2021-2027 (%)
    • Data Table on Market share by country 2021-2027(%)
    • China
      • Exhibit: Chart on Market share 2021-2027 (%)
      • Exhibit: Market size and forecast 2021-2027 ($ million)
    • India
      • Exhibit: Chart on Market share 2021-2027 (%)
      • Exhibit: Market size and forecast 2021-2027 ($ million)
    • Japan
      • Exhibit: Chart on Market share 2021-2027 (%)
      • Exhibit: Market size and forecast 2021-2027 ($ million)
    • South Korea
      • Exhibit: Chart on Market share 2021-2027 (%)
      • Exhibit: Market size and forecast 2021-2027 ($ million)
    • Rest of Asia Pacific
      • Exhibit: Chart on Market share 2021-2027 (%)
      • Exhibit: Market size and forecast 2021-2027 ($ million)
  • Latin America
    • Chart on Market share by country 2021-2027 (%)
    • Data Table on Market share by country 2021-2027(%)
    • Brazil
      • Exhibit: Chart on Market share 2021-2027 (%)
      • Exhibit: Market size and forecast 2021-2027 ($ million)
    • Rest of South America
      • Exhibit: Chart on Market share 2021-2027 (%)
      • Exhibit: Market size and forecast 2021-2027 ($ million)
  • Middle East & Africa (MEA)
    • Chart on Market share by country 2021-2027 (%)
    • Data Table on Market share by country 2021-2027(%)
    • GCC Countries
      • Exhibit: Chart on Market share 2021-2027 (%)
      • Exhibit: Market size and forecast 2021-2027 ($ million)
    • South Africa
      • Exhibit: Chart on Market share 2021-2027 (%)
      • Exhibit: Market size and forecast 2021-2027 ($ million)
    • Rest of MEA
      • Exhibit: Chart on Market share 2021-2027 (%)
      • Exhibit: Market size and forecast 2021-2027 ($ million)

KEY COMPANY PROFILES

  • Competitive Landscape
    • Total number of companies covered
      • Exhibit: companies covered in the report, 2021
    • Top companies market positioning
      • Exhibit: company positioning matrix, 2021
    • Top companies market Share
      • Exhibit: Pie chart analysis on company market share, 2021(%)

Methodology

For the Space Debris Monitoring and Removal Market, our research methodology involved a mixture of primary and secondary data sources. Key steps involved in the research process are listed below:

1. Information Procurement: This stage involved the procurement of Market data or related information via primary and secondary sources. The various secondary sources used included various company websites, annual reports, trade databases, and paid databases such as Hoover's, Bloomberg Business, Factiva, and Avention. Our team did 45 primary interactions Globally which included several stakeholders such as manufacturers, customers, key opinion leaders, etc. Overall, information procurement was one of the most extensive stages in our research process.

2. Information Analysis: This step involved triangulation of data through bottom-up and top-down approaches to estimate and validate the total size and future estimate of the Space Debris Monitoring and Removal Market.

3. Report Formulation: The final step entailed the placement of data points in appropriate Market spaces in an attempt to deduce viable conclusions.

4. Validation & Publishing: Validation is the most important step in the process. Validation & re-validation via an intricately designed process helped us finalize data points to be used for final calculations. The final Market estimates and forecasts were then aligned and sent to our panel of industry experts for validation of data. Once the validation was done the report was sent to our Quality Assurance team to ensure adherence to style guides, consistency & design.

Analyst Support

Customization Options

With the given market data, our dedicated team of analysts can offer you the following customization options are available for the Space Debris Monitoring and Removal Market:

Product Analysis: Product matrix, which offers a detailed comparison of the product portfolio of companies.

Regional Analysis: Further analysis of the Space Debris Monitoring and Removal Market for additional countries.

Competitive Analysis: Detailed analysis and profiling of additional Market players & comparative analysis of competitive products.

Go to Market Strategy: Find the high-growth channels to invest your marketing efforts and increase your customer base.

Innovation Mapping: Identify racial solutions and innovation, connected to deep ecosystems of innovators, start-ups, academics, and strategic partners.

Category Intelligence: Customized intelligence that is relevant to their supply Markets will enable them to make smarter sourcing decisions and improve their category management.

Public Company Transcript Analysis: To improve the investment performance by generating new alpha and making better-informed decisions.

Social Media Listening: To analyze the conversations and trends happening not just around your brand, but around your industry as a whole, and use those insights to make better Marketing decisions.

$5,300
BUY NOW

REQUEST FOR SAMPLE

Want to customize this report?
REQUEST FREE CUSTOMIZATION

FAQs

Global Space Debris Monitoring and Removal Market size was valued at USD 1.01 Billion in 2022 and is poised to grow from USD 1.08 Billion in 2023 to USD 1.75 Billion by 2031, growing at a CAGR of 7.15% in the forecast period (2024-2031).

Companies that engage in the removal of space debris are mandated to control the growing population of debris in space. Additionally, the companies are concerned with new product launches, patents, new technological tactical deployment and several other strategies. Rise in the awareness of space pollutants and increasing installation of satellites is the major factor expected to surge the growth of the global space debris monitoring market during the forecast period. The rising number of space tourists has helped the scientists to cater to the rising demand for the technology for monitoring space debris. Several companies have increased the budget of the R&D department to provide monitoring for the use of latest technologies such as coherent amplifying network lasers, and super wide field of view telescopes. 'Airbus S.A.S (Netherlands)', 'Astroscale (Netherlands)', 'ClearSpace (Switzerland)', 'Electro Optic Systems (Australia)', 'Lockheed Martin Corporation (U.S.)', 'Northrop Grumman Corporation (U.S.)', 'Orbit Guardians (U.S.)', 'Obruta (Canada)', 'Share my space (France)', 'Voyager Space Holdings Inc. (U.S.) '

One of the key drivers for the market is the increasing number of space activities, such as satellite launches or space missions. As a result, more debris is expected to be observed. For this reason, it is critical to develop effective monitoring and removal solutions to make future space operations safe and sustainable.

Advancements in Tracking and Monitoring Technologies: Round-based radars, space-based sensors, and optical telescopes are becoming more sensitive and therefore able to track increasingly smaller debris parts, creating an increasingly comprehensive picture of their locations. This progress allows the growing population of debris to be consistently cataloged, providing valuable information for assessing the risk of future collisions and planning their removal.

North America was the dominant region in 2023 due to the imposition of strict rules by the US government regarding the sale and distribution of space-related goods and the increase in the number of space launches in the region. The United States is the leading potential regulator for the high impact of the business and existences of the International Traffic in Arms Regulations. It is a United States regulatory provision that governs the development, commerce, transfer, and utilization of defense and space-related commodities. The market players in the region are incurring high costs and facing stiff competition whenever they wish to transact business that does not comply with US policies. Therefore, the United States will come up with effective regulations to control space debris.

Request Free Customization

Want to customize this report? This report can be personalized according to your needs. Our analysts and industry experts will work directly with you to understand your requirements and provide you with customized data in a short amount of time. We offer $1000 worth of FREE customization at the time of purchase.

logo-images

Feedback From Our Clients

Space Debris Monitoring and Removal Market

Report ID: SQMIG20A2268

sales@skyquestt.com
USA +1 351-333-4748

BUY NOW GET FREE SAMPLE