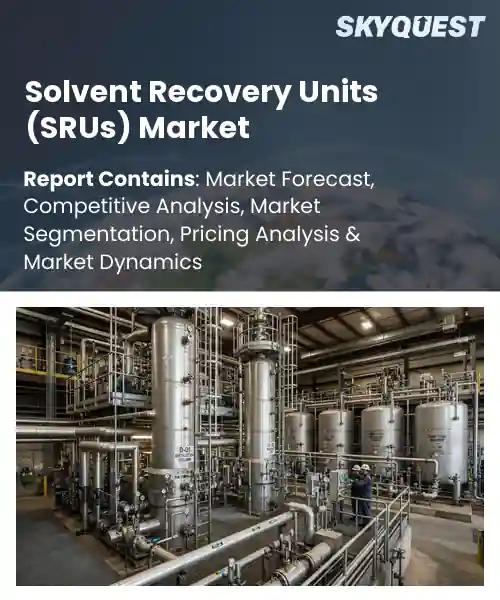
Solvent Recovery Units (SRUs) Market
Report ID: SQMIG20I3706
Report ID: SQMIG20I3706
[email protected]
USA +1 351-333-4748
Report ID:
SQMIG20I3706 |
Region:
Global |
Published Date: August, 2026
Pages:
157
|Tables:
147
|Figures:
78


Global Solvent Recovery Units (Srus) Market size was valued at USD 1.84 Billion in 2024 and is poised to grow from USD 1.97 Billion in 2025 to USD 3.33 Billion by 2033, growing at a CAGR of 6.8% during the forecast period (2026-2033).
Regulatory compliance now serves as the principal catalyst accelerating global SRU demand, because firms that ignore emission limits face fines, production shutdowns, and reputational damage. Consequently, manufacturers invest in modular recovery systems that can be retrofitted to existing plants, reducing capital outlay while delivering immediate solvent‑recovery rates of 80 percent or higher. In the electronics sector, a Taiwanese printed‑circuit board producer reported a 15 percent reduction in solvent purchase costs after installing a closed‑loop SRU, demonstrating direct financial upside environmentally significantly. Parallel growth in circular‑economy initiatives further expands market opportunities, as waste‑to‑resource policies encourage companies to monetize recovered solvents rather than dispose of them.
How is AI-driven automation influencing efficiency and cost reductions in the solvent recovery units (SRU) market?
AI‑driven automation is reshaping solvent recovery units by embedding intelligent sensors and real‑time analytics into each stage of the process. Advanced algorithms monitor temperature, pressure and solvent purity, allowing the system to self‑adjust and maintain optimal conditions without manual intervention. Predictive maintenance alerts operators to component wear before failure occurs, reducing downtime and extending equipment life. Integrated control software coordinates multiple recovery stages, improving throughput while cutting energy demand and solvent loss. These capabilities create a more resilient operation that aligns with the broader market’s shift toward sustainable and cost‑effective manufacturing, reinforcing confidence among plant managers and investors alike.On March 5 2026 the market was valued at US$1.09 billion, a milestone that highlights how AI‑enabled efficiency gains are driving adoption and supporting continued expansion of solvent recovery technologies.
Market snapshot - (2026-2033)
Global Market Size
USD 1.84 Billion
Largest Segment
Distillation-Based Recovery
Fastest Growth
Membrane-Based Recovery
Growth Rate
6.8% CAGR
To get more insights on this market click here to Request a Free Sample Report
Global solvent recovery units (srus) market is segmented by recovery technology, solvent type, application, end-use industry, operation and region. Based on recovery technology, the market is segmented into Distillation-Based Recovery, Membrane-Based Recovery, Adsorption-Based Recovery and Condensation-Based Recovery. Based on solvent type, the market is segmented into Hydrocarbon Solvents, Oxygenated Solvents, Halogenated Solvents and Aqueous Solvents. Based on application, the market is segmented into Solvent Recycling, Emission Control and Waste Reduction. Based on end-use industry, the market is segmented into Pharmaceuticals, Chemicals, Paints & Coatings, Printing & Packaging and Food & Beverage. Based on operation, the market is segmented into Batch and Continuous. Based on region, the market is segmented into North America, Europe, Asia Pacific, Latin America and Middle East & Africa.
Distillation-based recovery segment dominates because it leverages mature thermal separation principles that efficiently handle a wide range of solvent volatilities, offering reliable solvent purity and low operational risk. Its entrenched infrastructure, proven scalability, and compatibility with existing plant layouts drive widespread adoption, making it the preferred choice for manufacturers seeking consistent performance and regulatory compliance in solvent recovery while also minimizing energy consumption through heat integration and enabling flexible process control.
However, membrane-based recovery segment is witnessing strongest growth momentum because advances in selective membrane materials and modular designs are unlocking high recovery efficiencies for low boiling solvents, reducing capital intensity and enabling rapid deployment. This innovation aligns with sustainability targets and permits decentralized installations, accelerating market expansion and creating opportunities for niche applications.
Hydrocarbon solvents segment dominates because their high volatility and established supply chains enable efficient thermal separation, delivering consistent solvent purity with relatively low energy input. Their compatibility with existing distillation infrastructure reduces retrofit costs, while their broad usage across multiple industries reinforces demand for reliable recovery solutions. This convergence of technical suitability and economic practicality sustains their leadership in the solvent recovery units market and facilitates compliance with environmental regulations.
Meanwhile, oxygenated solvents segment is experiencing rapid expansion because their higher polarity and lower toxicity are driving adoption in green chemistry and specialty formulations, prompting manufacturers to seek recovery systems that preserve functional groups. Emerging regulatory incentives for reduced emissions and the push for safer processing are fueling investment, positioning this segment as a catalyst for future market growth.
To get detailed segments analysis, Request a Free Sample Report
North America dominates the global Solvent Recovery Units (SRUs) Market due to its advanced manufacturing infrastructure, proactive regulatory environment, and deep expertise in chemical processing. Companies benefit from early adoption of energy‑efficient technologies supported by stringent emission standards that drive the implementation of closed‑loop solvent systems. A robust network of equipment manufacturers and engineering service providers delivers scalable and modular SRU solutions tailored to diverse industrial applications. Strong investment in research and development, coupled with collaborative partnerships between industry and academic institutions, fuels continuous innovation. The region’s focus on sustainability and cost reduction reinforces its leadership, making North America a benchmark for high‑performance solvent recovery practices worldwide. Additional support comes from federal tax incentives and state‑level sustainability programs that lower capital barriers and encourage broader deployment across automotive, aerospace, and specialty chemical sectors.
Solvent Recovery Units (SRUs) Market in the United States are propelled by a manufacturing base that prioritises efficiency and compliance. Strong regulatory frameworks encourage adoption of closed‑loop solvent systems, while established expertise in chemical processing fuels innovation. Industry clusters integrate control technologies, enabling deployment of recovery solutions. Networks between equipment suppliers, research institutions, and end‑users accelerate transfer, reinforcing the United States position as a benchmark for robust scalable SRU implementations.
Solvent Recovery Units (SRUs) Market in Canada benefit from a strong emphasis on sustainable manufacturing and proactive environmental policies. Close collaboration between federal agencies and industry accelerates the adoption of energy‑efficient solvent recovery technologies. Regional petrochemical hubs provide a skilled workforce that supports the design and operation of advanced recovery systems. Academic research centers contribute innovative process optimization techniques, reinforcing Canada reputation for high‑performance SRU deployment across diverse sectors.
Europe’s Solvent Recovery Units (SRUs) Market is propelled by a convergence of rigorous environmental regulations, strong industrial heritage, and a commitment to circular economy initiatives. The region’s mature chemical and pharmaceutical sectors demand high‑performance solvent management to reduce waste footprints and comply with tightening emissions standards. Collaborative frameworks among governments, research institutions, and equipment manufacturers foster rapid technology transfer and the scaling of modular recovery solutions. Incentive programs encourage investment in energy‑efficient systems, while trade associations disseminate best‑practice guidelines that harmonize standards across borders. This integrated ecosystem positions Europe as a leader in adopting innovative SRU technologies that enhance productivity while supporting sustainability goals. Moreover, the presence of a dense network of specialized engineering firms enables customized solutions that address the diverse process requirements of automotive, food processing, and specialty chemical manufacturers. Investment in monitoring and automation further strengthens operational efficiency, making European SRU deployments a benchmark for best practice.
Solvent Recovery Units (SRUs) Market in Germany is anchored by a chemical industry that places value on resource efficiency and regulatory compliance. Government incentives promote investment in energy‑saving technologies, encouraging firms to integrate sophisticated recovery modules. Strong engineering expertise and a supplier network facilitate customization of SRU solutions for varied process requirements. Collaborative research programs between universities and corporations drive improvement, keeping Germany at the forefront of solvent management practices.
Solvent Recovery Units (SRUs) Market in the United Kingdom is experiencing uptake driven by stringent environmental directives and a chemicals sector. Industry leaders prioritize closed‑loop solvent cycles to reduce waste and lower operating costs. A network of technology providers offers modular SRU designs that can be commissioned across diverse manufacturing sites. Academic‑industry partnerships generate innovative process improvements, reinforcing the United Kingdom reputation as a hub for sustainable solvent recovery solutions.
Solvent Recovery Units (SRUs) Market in France is emerging as firms seek to align with climate targets and economy principles. Growing awareness of solvent waste costs motivates adoption of recovery units that integrate with existing process lines. Support from research agencies fosters development of energy‑efficient technologies, while regulatory guidance encourages implementation. This environment positions France as an attractive arena for innovative SRU solutions across the pharmaceutical and specialty chemicals industries.
Asia Pacific is strengthening its position in the Solvent Recovery Units (SRUs) Market through rapid industrial expansion, increasing environmental awareness, and strategic government initiatives. The region’s growing chemical, electronics, and automotive manufacturing bases demand efficient solvent management to reduce operational costs and meet tightening emission guidelines. Investments in localized research and development centers enable the adaptation of SRU technologies to specific process conditions, while public‑private partnerships accelerate the rollout of energy‑saving recovery systems. Emerging markets within the region are adopting modular and compact SRU designs that fit limited plant footprints, fostering wider acceptance. These combined factors are elevating Asia Pacific as a dynamic hub for innovative and cost‑effective solvent recovery solutions. Furthermore, governments are introducing subsidies and streamlined approval processes that lower entry barriers for new SRU technologies, encouraging both domestic manufacturers and foreign investors to expand their presence in the market.
Solvent Recovery Units (SRUs) Market in Japan is driven by a highly advanced manufacturing sector that prioritises precision and waste minimisation. Strict environmental regulations motivate companies to integrate sophisticated recovery systems that capture and reuse solvents efficiently. Close collaboration between major industrial firms and technology developers accelerates the deployment of compact, high‑efficiency SRU units across electronics, chemicals, and automotive production lines. Strong government support for green innovation, combined with a skilled engineering workforce, reinforces Japan’s reputation for leading‑edge solvent management and continuous process improvement.
Solvent Recovery Units (SRUs) Market in South Korea benefits from a proactive policy framework that encourages sustainable manufacturing practices. Leading conglomerates invest heavily in closed‑loop solvent technologies to enhance competitiveness and reduce environmental impact. A vibrant ecosystem of research institutes and equipment suppliers promotes rapid adoption of modular SRU designs tailored to the nation’s extensive petrochemical and semiconductor industries. Strategic incentives and public‑private collaborations streamline technology transfer, enabling South Korea to achieve high recovery rates while supporting its broader ambition of a low‑carbon industrial economy.
To know more about the market opportunities by region and country, click here to
Buy The Complete Report
Increasing Environmental Regulations
Growing Demand for Sustainable Processes
High Capital Investment Requirements
Complexity of Technology Integration
Request Free Customization of this report to help us to meet your business objectives.
The competitive landscape is shaped by intensified M&A activity, with leading equipment manufacturers acquiring niche solvent‑recovery specialists to broaden portfolio breadth, while strategic partnerships between pharmaceutical firms and technology providers accelerate integration of closed‑loop solvent systems, and continuous tech innovation drives the rollout of modular, energy‑efficient units that reduce operating costs and environmental impact.
Top Player’s Company Profile
Recent Developments
SkyQuest’s ABIRAW (Advanced Business Intelligence, Research & Analysis Wing) is our Business Information Services team that Collects, Collates, Correlates, and Analyses the Data collected by means of Primary Exploratory Research backed by robust Secondary Desk research. As per SkyQuest analysis, the global solvent recovery units market is being propelled primarily by tightening environmental regulations that compel manufacturers to capture and reuse solvents, while a second strong catalyst is the rising demand for sustainable processes that reduce waste and improve brand reputation. The market is led by North America, where advanced manufacturing infrastructure and supportive policies drive early adoption, and distillation‑based recovery remains the dominant technology segment because of its proven reliability and compatibility with existing plants. However, the high capital investment required to design, install and commission these systems acts as a notable restraint, slowing uptake among smaller operators.
| Report Metric | Details |
|---|---|
| Market size value in 2024 | USD 1.84 Billion |
| Market size value in 2033 | USD 3.33 Billion |
| Growth Rate | 6.8% |
| Base year | 2024 |
| Forecast period | (2026-2033) |
| Forecast Unit (Value) | USD Billion |
| Segments covered |
|
| Regions covered | North America (US, Canada), Europe (Germany, France, United Kingdom, Italy, Spain, Rest of Europe), Asia Pacific (China, India, Japan, Rest of Asia-Pacific), Latin America (Brazil, Rest of Latin America), Middle East & Africa (South Africa, GCC Countries, Rest of MEA) |
| Companies covered |
|
| Customization scope | Free report customization with purchase. Customization includes:-
|
To get a free trial access to our platform which is a one stop solution for all your data requirements for quicker decision making. This platform allows you to compare markets, competitors who are prominent in the market, and mega trends that are influencing the dynamics in the market. Also, get access to detailed SkyQuest exclusive matrix.
Table Of Content
Executive Summary
Market overview
Parent Market Analysis
Market overview
Market size
KEY MARKET INSIGHTS
COVID IMPACT
MARKET DYNAMICS & OUTLOOK
Market Size by Region
KEY COMPANY PROFILES
Methodology
For the Solvent Recovery Units (SRUs) Market, our research methodology involved a mixture of primary and secondary data sources. Key steps involved in the research process are listed below:
1. Information Procurement: This stage involved the procurement of Market data or related information via primary and secondary sources. The various secondary sources used included various company websites, annual reports, trade databases, and paid databases such as Hoover's, Bloomberg Business, Factiva, and Avention. Our team did 45 primary interactions Globally which included several stakeholders such as manufacturers, customers, key opinion leaders, etc. Overall, information procurement was one of the most extensive stages in our research process.
2. Information Analysis: This step involved triangulation of data through bottom-up and top-down approaches to estimate and validate the total size and future estimate of the Solvent Recovery Units (SRUs) Market.
3. Report Formulation: The final step entailed the placement of data points in appropriate Market spaces in an attempt to deduce viable conclusions.
4. Validation & Publishing: Validation is the most important step in the process. Validation & re-validation via an intricately designed process helped us finalize data points to be used for final calculations. The final Market estimates and forecasts were then aligned and sent to our panel of industry experts for validation of data. Once the validation was done the report was sent to our Quality Assurance team to ensure adherence to style guides, consistency & design.
Analyst Support
Customization Options
With the given market data, our dedicated team of analysts can offer you the following customization options are available for the Solvent Recovery Units (SRUs) Market:
Product Analysis: Product matrix, which offers a detailed comparison of the product portfolio of companies.
Regional Analysis: Further analysis of the Solvent Recovery Units (SRUs) Market for additional countries.
Competitive Analysis: Detailed analysis and profiling of additional Market players & comparative analysis of competitive products.
Go to Market Strategy: Find the high-growth channels to invest your marketing efforts and increase your customer base.
Innovation Mapping: Identify racial solutions and innovation, connected to deep ecosystems of innovators, start-ups, academics, and strategic partners.
Category Intelligence: Customized intelligence that is relevant to their supply Markets will enable them to make smarter sourcing decisions and improve their category management.
Public Company Transcript Analysis: To improve the investment performance by generating new alpha and making better-informed decisions.
Social Media Listening: To analyze the conversations and trends happening not just around your brand, but around your industry as a whole, and use those insights to make better Marketing decisions.
REQUEST FOR SAMPLE
 REQUEST FREE CUSTOMIZATION


Want to customize this report? This report can be personalized according to your needs. Our analysts and industry experts will work directly with you to understand your requirements and provide you with customized data in a short amount of time. We offer $1000 worth of FREE customization at the time of purchase.
Feedback From Our Clients


 USA (+1) 351-333-4748

