Smart Stadium Market Size, Share, Growth Analysis, By Component (Software, Services), By Deployment Mode (On-premises, Cloud-based), By Application (Digital Content Management, Stadium and Public Security), By Region -Industry Forecast 2025-2032


Report ID: SQMIG25P2020 | Region: Global | Published Date: January, 2025
Pages: 197 |Tables: 90 |Figures: 73

Smart Stadium Market Insights

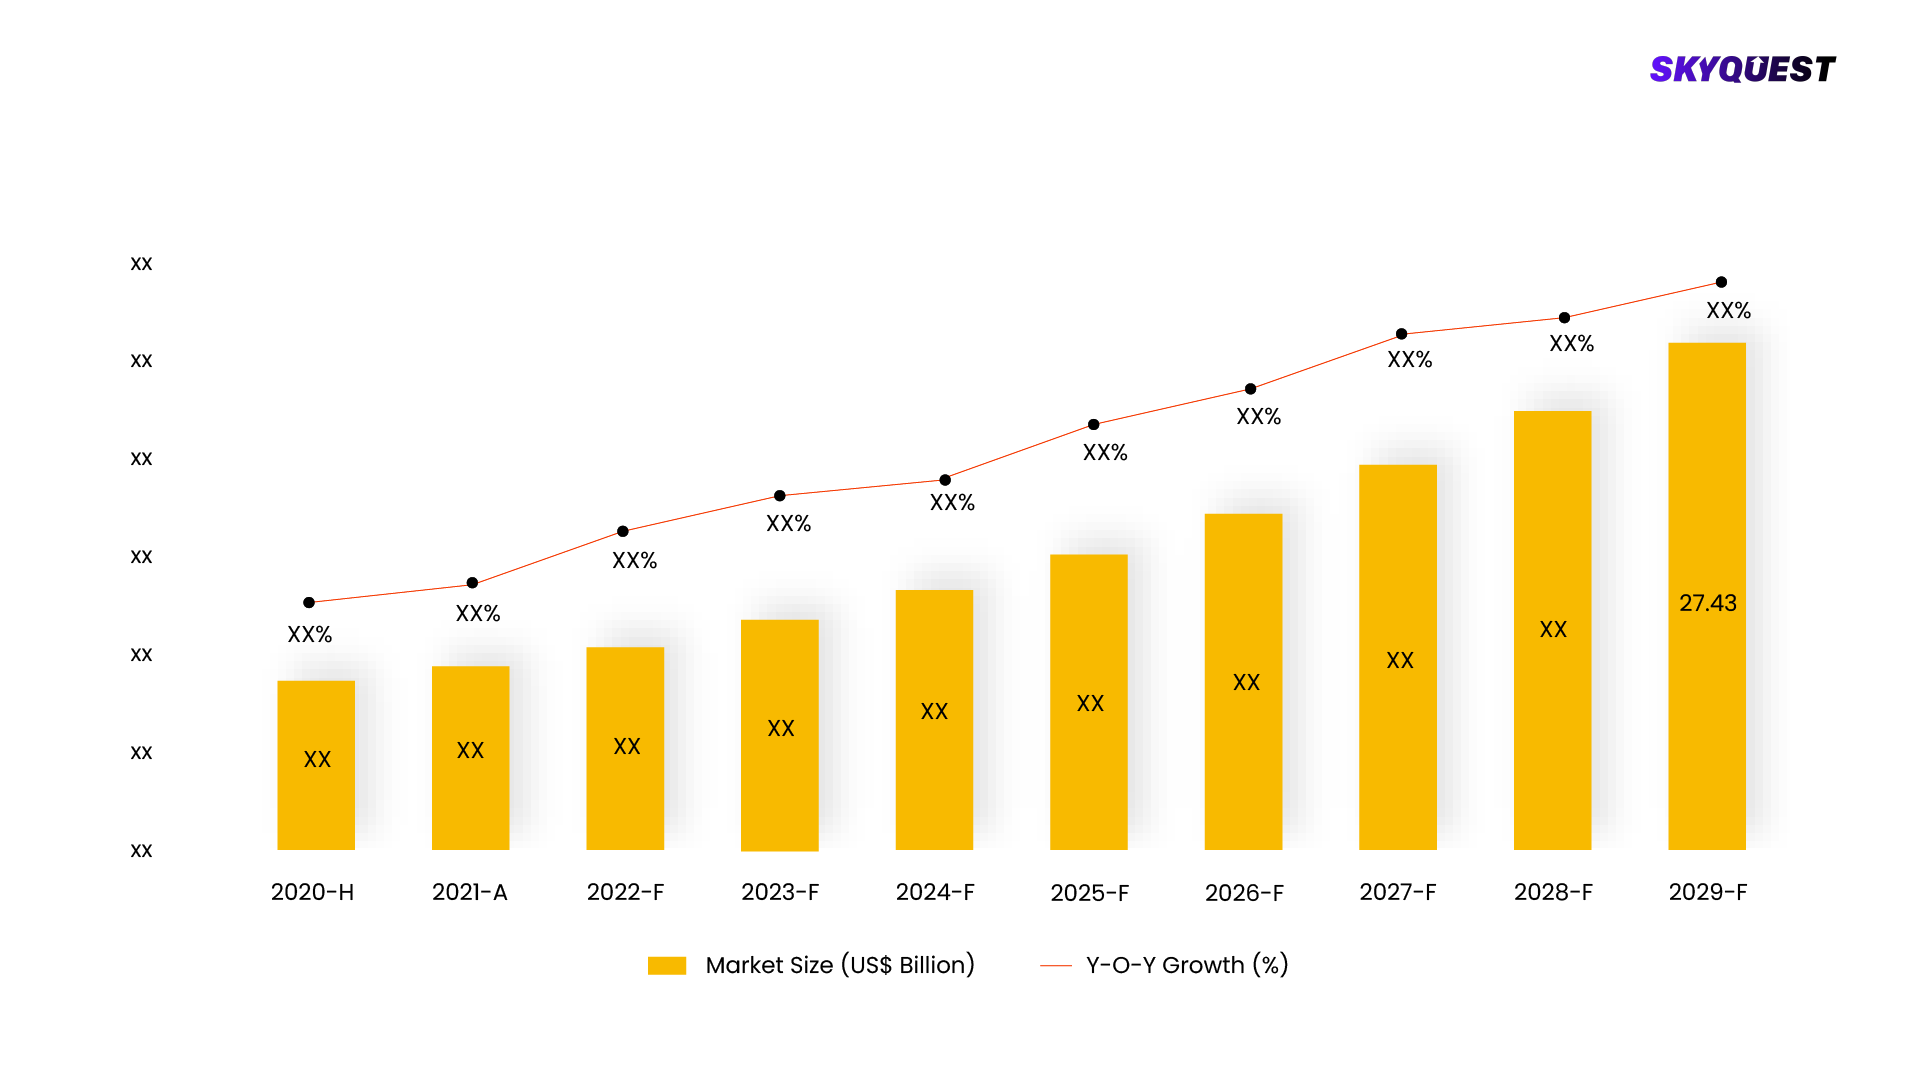
Global Smart Stadium Market size was valued at USD 8.66 Billion in 2023 and is poised to grow from USD 10.44 Billion in 2024 to USD 46.73 Billion by 2032, growing at a CAGR of 20.6% in the forecast period (2025-2032).

This increasing trend could be attributed to the increasing demand for effectively engaging fans during sports activities with the help of integrated technologies. Additionally, the advancing sports league culture in developed and developing countries is likely to provide substantial opportunities to the players operating in smart stadium industry. As it stands, smart stadiums have various integrated solutions that allow the venues to improve and meet the demands and the experience of players, fans and medics.

The advanced network of a smart stadium contains a wide range of integrated solutions such as surveillance, digital signage, parking, and sensors among others through wireless or wired networks. These solutions also enhance fans experience by providing them with real-time details like long queues at concession stands, in-stadium merchandise pricing, and parking spaces available. There are huge renovations carried out in the stadiums themselves to add to the event’s complete experience scope such as better security, increased efficiency, and smart parking integration. The stricter policies enforced by sporting organizations to protect spectators, personnel, athletes, and crews during competitions are also fueling the expansion of the smart stadium market.

Market snapshot - (2025-2032)

Global Market Size

USD 8.66 Billion

Largest Segment

Software

Fastest Growth

Service

Growth Rate

20.6% CAGR

Global Smart Stadium Market ($ Bn)
Country Share for Europe Region (%)

To get more reports on the above market click here to Buy The Report

Smart Stadium Market Segmental Analysis

The global smart stadium market is segmented into component, deployment model, application, and region. Based on components, the market is segmented into software and services. Based on the deployment model, the market is segmented into on-premises and cloud-based. Based on application, the market is segmented into digital content management, stadium and public security, building automation management, event management, crowd management, network management, and others. Based on region, the market is segmented into North America, Europe, Asia-Pacific, Latin America, and the Middle East & Africa.

Analysis by Component

Based on component, the software segment is dominating the market with the largest smart stadium market share. The digital revolution is of great importance to both the stadium owners and the fans. Various aspects and features can be integrated into smart stadiums, a few include, management of crowds, purchasing tickets, upgrading seating, and even the management of parking vehicles. Moreover, it entails various functions such as ordering food, fetching closet restroom queues, posting on social media, incident response management, buying merchandise, social Wi-Fi networks, clever lighting, and integrated security systems. Additionally, there are certain software solutions that incorporate features of social networking sites, allowing fans to communicate and interact with the teams and events. Besides, analytics software provides useful functionality to stadium managers to supervise and improve the management of all operations including spectator control and sales of concessions counters and machines.

The service segment is expected to grow at a significant CAGR during the forecast period.  This segment is growing rapidly because with data analysis and mobile applications, the stadiums can provide timely alerts, special offers and reminders regarding any occasion or concern as well as the ability to cater to the events individually. This improves the entire fan engagement and experience as a whole. Moreover, the use of automation in ticketing, parking space allocation and crowd management enhances the efficiency of the processes, decreases the congestion and elevates the level of service. These factors are expected to propel market growth over the coming years. Stadium infrastructure would include technologies such as network management, building automation and digital content management. Stadiums are able to combine enterprise solutions, partners as well as people, and additionally enrich the project with the help of deployment and integration services.

Analysis by Deployment Type

Based on deployment type, the on-premises segment is dominating the smart stadium market.  Smart stadiums have numerous cameras, sensors and digital signs that are connected to servers through wired and wireless networks. It helps provide real-time data to the security in charge of monitoring activities of the crowd. All these devices are installed on premises which need a huge allocation of resources in the form of hardware and software creating a larger revenue share of segment throughout the forecasting period. Moreover, on-premises solutions provide stadium operators with full control of their data which guarantees high levels of security and privacy. They permit extensive tailoring in order to achieve the set requirements of specific stadiums to provide better results. With on-premises deployment, the data is protected as it is limited to the infrastructure of the stadium resulting in low chances of breach of law concerning data. Furthermore, on-premises solutions enable stadium operators to meet domestic and international regulations so they can easily control how and where data is stored and processed.

As per smart stadium market analysis, cloud-based segment is experiencing tremendous growth and opportunities in recent years. The cloud-based segment is going through the fastest growth during the forecast period due to the budget friendly nature of cloud solutions and the pay-per-use model for IaaS. To improve areas such as fan engagement, data analytics, IoT integration, and security, smart stadiums will be able to utilize external cloud vendors. The cloud-based segmentation of the smart stadiums market is gaining traction, owing to the low operational cost and the shortened deployment time that comes with it. This segment also enables more flexibility since businesses only have to pay for the services used. This allows businesses to raise or lower resources especially during the demand of stadium on seasonal basis.

Global Smart Stadium Market Analysis by Component

To get detailed analysis on other segments, Request For Free Sample Report

Smart Stadium Market Regional Insights

Europe is dominating with the largest smart stadium market share. In addition to the growing integration of social media with stadium technologies, the European market is being propelled by a greater demand for enhanced viewing experiences. Furthermore, a growing number of stadium owners are being compelled to modernize their facilities due to regulatory measures aimed at securing public order during competitions. In March 2022, Real Madrid entered into a multi-year cooperation agreement with Cisco Systems Inc, by means of which will deploy the largest Wi-Fi 6 stadium network, hence making the Santiago Bernabeu Stadium one of the most technologically advanced sports venues worldwide. In addition, this multipurpose stadium will have more than 1200 Wi-Fi 6 access points, which allow for more data to be transmitted simultaneously at greater speeds and reliability than previous Wi-Fi technologies making the fan experience much more interactive.

Over the course of the projected period, it is anticipated that the smart stadium market in Asia Pacific would expand with the highest growth rate. The growth is mainly because of the rising investments in sports infrastructure, technology integration, and growing interest in different sports. The Tokyo 2020 Olympics which took place in Japan propelled the use of smart technologies in sports facilities in the country. Sports infrastructure in the region is being developed, including the installation of smart technologies in sports arenas. The government of China is also heavily investing in sport infrastructure which includes smart stadium technologies targeting the enhancement of sports tourism and hosting international events. Furthermore, the Melbourne Cricket Ground in Australia deployed IoT and artificial intelligence technologies to improve fans’ experience and the venue operations. Therefore, the drive to improve fan experience, the efficiency of operations and security will further improve the region in the region.

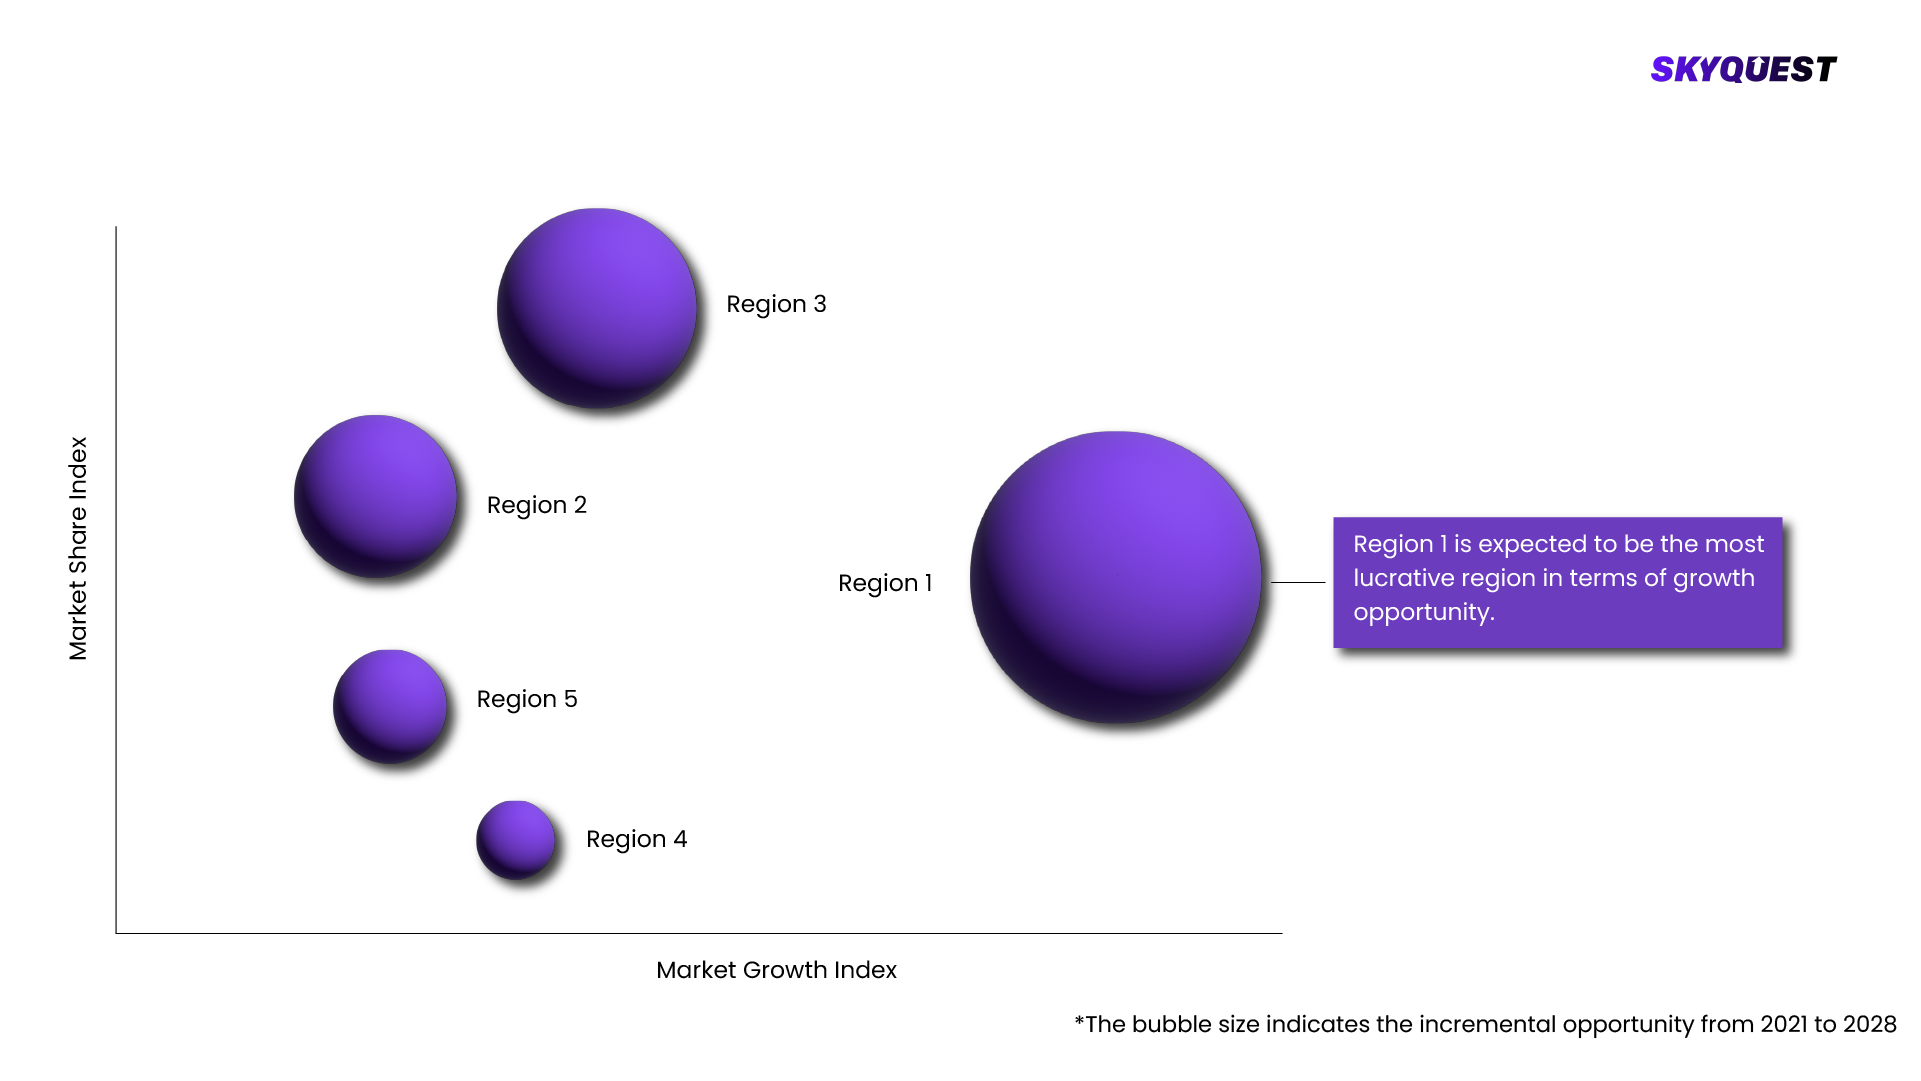
Global Smart Stadium Market By Geography
  • Largest
  • Fastest

To know more about the market opportunities by region and country, click here to
Buy The Complete Report

Smart Stadium Market Dynamics

Drivers

Growing Opportunities to Increase Revenue

  • Operators of smart stadiums are not only able to enhance the customer experience but also create high-quality, customized offerings which increase spending thereby providing lucrative revenue sources for the operators. Due to the increased level of convenience, the cost of operation per fan increases, which in turn makes such a business model far more profitable. Moreover, smart stadiums also assist in data analysis of the fans’ behavior for recognition of marketing prospects and personalized promotions. Operators can improve pricing strategies for concessions, merchandise, and ticketing by analyzing the core consumer prices and spending patterns of smart stadium attendees and maximize revenue.

Better Operational Efficiency and Cost Savings

  • Smart stadiums assist venue operators in minimizing their expenditure and increase efficiency which contribute towards an increase in market size. This means that real-time data analytics facilitates better management of resources through greater control over energy usage and supply, crowd movement, active maintenance measures raising operating standards to a new level. It also helps to use the capacity utilization analysis along the entire chain to optimize the cost significantly by optimizing staffing levels and resource allocation.

Restraints

Increasing Investments and Maintenance Expense

  • The initial expense to build a smart stadium is extremely high. Even the cost of transforming an ordinary stadium into a smart stadium through incorporation of modern technologies can be a limitation to market expansion. Moreover, smart stadiums are more expensive to maintain, mainly because they require software upgrades, data security, and sensor maintenance, which significantly elevates the costs of operation. The structural barriers to the incorporation of smart technologies in large stadiums that are budget constrained can limit them from reaping the benefits of the smart stadiums market.

High Data Security Concerns

  • The expansion of smart devices, as well as the increase of digital services, has increased the risk of abusing personal data in smart stadiums. Smart stadiums collect and store extensive amounts of data through mobile applications, security cameras and IoT devices, making them vulnerable for cyberattacks. The information leakage can result in adverse effects for society due to fraudulent AI phishing attacks being on the upsurge. Stadiums are enhancing the security of their systems to avoid any fear of large-scale threats to data privacy that would greatly limit the development of the sector.

Request Free Customization of this report to help us to meet your business objectives.

Smart Stadium Market Competitive Landscape

Key market participants in the smart stadium industry are developing new products to meet the increasing demand from other sectors. Many businesses are engaging in various activities and market developments such as new product launches, procurement contracts, mergers and acquisitions, increased investments, and the signing of agreements with other companies to increase their market share. To remain competitive, players in the smart stadium market must offer low-cost products. Supply chain optimization strategies are gaining traction among the smart stadium industry market leaders globally, who are frequently allocating research and development funding to this purpose.

Top Player’s Company Profile

  • DB Schenker
  • Dignia Systems Ltd.
  • GP Smart Stadium
  • Hawk Eye Innovations Ltd.
  • Hewlett Packard Enterprise Co.
  • Honeywell International Inc.
  • Huawei Technologies Co. Ltd.
  • Infosys Ltd.
  • Intel Corp.
  • International Business Machines Corp.
  • Johnson Controls International Plc
  • Lumen Technologies Inc.
  • NEC Corp.
  • Nippon Telegraph and Telephone Corp.
  • Telefonaktiebolaget LM Ericsson
  • Weblib
  • DS worldwide Ltd.

Recent Developments

  • In July 2024, Johnson Controls became partners with the International Olympic Committee. So, the company installed HVAC, advanced building automation systems and fire suppression technologies at eight venues of Olympic Games Paris 2024 to turn the buildings into smart and energy efficient olympic stadiums.
  • In October 2023, Cisco Systems Inc in conjunction with the Australians went into a partnership with the Kardinia Park Stadium Trust (KPST). With this partnership, Cisco was to implement its VisionEDGEedge digital service featuring the WaitTime crowd measurement penetration system into the operating environment of the Kardinia Park.
  • In September 2023, Climatec, LLC entered into an agreement with JIG-SAW. With this partnership, JIG-SAW aims to rollout smart stadium technology in Major League Baseball (MLB). Moreover, Climatec will provide its IoT technology at the design, deployment and service stages.

Smart Stadium Key Market Trends

  • Incorporation of Advanced Technologies: The market's rising profit share is significantly driven by the adoption of cutting-edge technologies such as IoT, AI, AR and 5G solutions. The implementation of these technologies greatly enhances fan experience and increases fan turnout in the stadium, thus generating more revenue. IoT solutions such as haptic seats, smart ticketing and smart concessions improve the fan experience in smart stadiums. 5G networks allow fans to experience AR with reduced latencies.
  • Advent of Augmented Reality: The expansion of augmented reality technology and the introduction of new venues are adding the potential to advance growth and trends of the market. The increasing penetration of augmented reality is likely to progressively access this area of business too. Attendees are able to use augmented reality technologies by installing the relevant AR application on their devices. This application enhances the enjoyment of the attendees in the stadiums by allowing the user to see individual players, providing various statistics about the game in play. It also explains the reasons for the decisions made by referees and umpires and enabling him/her to view action replays from different camera angles.

Smart Stadium Market SkyQuest Analysis

SkyQuest’s ABIRAW (Advanced Business Intelligence, Research & Analysis Wing) is our Business Information Services team that Collects, Collates, Correlates, and Analyses the Data collected by means of Primary Exploratory Research backed by robust Secondary Desk research.

As per SkyQuest analysis, an amalgam of technology development and consumer expectations is propelling the smart stadium industry to change swiftly. The emergence of stadiums into connected spaces is mainly because of the deployment of state-of-the-art systems like 5G, VR, and AI. Stadium operators are taking advantage of the sensor based IoT, AI controlled queue system, and wireless networks to increase their productivity and improve fan experience. In addition, NFL programs, such as Next Gen Stats, as well as other innovations shows the market’s commitment towards fan engagement and improvement in operational efficiency. Security measures including weapons scanners, weapons detection security systems and over viewing solutions augment security norms whilst curtailing tendencies to privacy intrusion and data breaches.

Report Metric Details
Market size value in 2023 USD 8.66 Billion
Market size value in 2032 USD 46.73 Billion
Growth Rate 20.6%
Base year 2024
Forecast period (2025-2032)
Forecast Unit (Value) USD Billion
Segments covered
  • Component
    • Software and Service
  • Deployment Model
    • On-Premise and Cloud-Based
  • Application
    • Digital Content Management, Stadium and Public Security, Building Automation Management, Event Management, Crowd Management, Network Management, and Others
Regions covered North America (US, Canada), Europe (Germany, France, United Kingdom, Italy, Spain, Rest of Europe), Asia Pacific (China, India, Japan, Rest of Asia-Pacific), Latin America (Brazil, Rest of Latin America), Middle East & Africa (South Africa, GCC Countries, Rest of MEA)
Companies covered
  • DB Schenker
  • Dignia Systems Ltd.
  • GP Smart Stadium
  • Hawk Eye Innovations Ltd.
  • Hewlett Packard Enterprise Co.
  • Honeywell International Inc.
  • Huawei Technologies Co. Ltd.
  • Infosys Ltd.
  • Intel Corp.
  • International Business Machines Corp.
  • Johnson Controls International Plc
  • Lumen Technologies Inc.
  • NEC Corp.
  • Nippon Telegraph and Telephone Corp.
  • Telefonaktiebolaget LM Ericsson
  • Weblib
  • DS worldwide Ltd.
Customization scope

Free report customization with purchase. Customization includes:-

  • Segments by type, application, etc
  • Company profile
  • Market dynamics & outlook
  • Region

To get a free trial access to our platform which is a one stop solution for all your data requirements for quicker decision making. This platform allows you to compare markets, competitors who are prominent in the market, and mega trends that are influencing the dynamics in the market. Also, get access to detailed SkyQuest exclusive matrix.

Buy The Complete Report to read the analyzed strategies adopted by the top vendors either to retain or gain market share

Table Of Content

Executive Summary

Market overview

  • Exhibit: Executive Summary – Chart on Market Overview
  • Exhibit: Executive Summary – Data Table on Market Overview
  • Exhibit: Executive Summary – Chart on Smart Stadium Market Characteristics
  • Exhibit: Executive Summary – Chart on Market by Geography
  • Exhibit: Executive Summary – Chart on Market Segmentation
  • Exhibit: Executive Summary – Chart on Incremental Growth
  • Exhibit: Executive Summary – Data Table on Incremental Growth
  • Exhibit: Executive Summary – Chart on Vendor Market Positioning

Parent Market Analysis

Market overview

Market size

  • Market Dynamics
    • Exhibit: Impact analysis of DROC, 2021
      • Drivers
      • Opportunities
      • Restraints
      • Challenges
  • SWOT Analysis

KEY MARKET INSIGHTS

  • Technology Analysis
    • (Exhibit: Data Table: Name of technology and details)
  • Pricing Analysis
    • (Exhibit: Data Table: Name of technology and pricing details)
  • Supply Chain Analysis
    • (Exhibit: Detailed Supply Chain Presentation)
  • Value Chain Analysis
    • (Exhibit: Detailed Value Chain Presentation)
  • Ecosystem Of the Market
    • Exhibit: Parent Market Ecosystem Market Analysis
    • Exhibit: Market Characteristics of Parent Market
  • IP Analysis
    • (Exhibit: Data Table: Name of product/technology, patents filed, inventor/company name, acquiring firm)
  • Trade Analysis
    • (Exhibit: Data Table: Import and Export data details)
  • Startup Analysis
    • (Exhibit: Data Table: Emerging startups details)
  • Raw Material Analysis
    • (Exhibit: Data Table: Mapping of key raw materials)
  • Innovation Matrix
    • (Exhibit: Positioning Matrix: Mapping of new and existing technologies)
  • Pipeline product Analysis
    • (Exhibit: Data Table: Name of companies and pipeline products, regional mapping)
  • Macroeconomic Indicators

COVID IMPACT

  • Introduction
  • Impact On Economy—scenario Assessment
    • Exhibit: Data on GDP - Year-over-year growth 2016-2022 (%)
  • Revised Market Size
    • Exhibit: Data Table on Smart Stadium Market size and forecast 2021-2027 ($ million)
  • Impact Of COVID On Key Segments
    • Exhibit: Data Table on Segment Market size and forecast 2021-2027 ($ million)
  • COVID Strategies By Company
    • Exhibit: Analysis on key strategies adopted by companies

MARKET DYNAMICS & OUTLOOK

  • Market Dynamics
    • Exhibit: Impact analysis of DROC, 2021
      • Drivers
      • Opportunities
      • Restraints
      • Challenges
  • Regulatory Landscape
    • Exhibit: Data Table on regulation from different region
  • SWOT Analysis
  • Porters Analysis
    • Competitive rivalry
      • Exhibit: Competitive rivalry Impact of key factors, 2021
    • Threat of substitute products
      • Exhibit: Threat of Substitute Products Impact of key factors, 2021
    • Bargaining power of buyers
      • Exhibit: buyers bargaining power Impact of key factors, 2021
    • Threat of new entrants
      • Exhibit: Threat of new entrants Impact of key factors, 2021
    • Bargaining power of suppliers
      • Exhibit: Threat of suppliers bargaining power Impact of key factors, 2021
  • Skyquest special insights on future disruptions
    • Political Impact
    • Economic impact
    • Social Impact
    • Technical Impact
    • Environmental Impact
    • Legal Impact

Market Size by Region

  • Chart on Market share by geography 2021-2027 (%)
  • Data Table on Market share by geography 2021-2027(%)
  • North America
    • Chart on Market share by country 2021-2027 (%)
    • Data Table on Market share by country 2021-2027(%)
    • USA
      • Exhibit: Chart on Market share 2021-2027 (%)
      • Exhibit: Market size and forecast 2021-2027 ($ million)
    • Canada
      • Exhibit: Chart on Market share 2021-2027 (%)
      • Exhibit: Market size and forecast 2021-2027 ($ million)
  • Europe
    • Chart on Market share by country 2021-2027 (%)
    • Data Table on Market share by country 2021-2027(%)
    • Germany
      • Exhibit: Chart on Market share 2021-2027 (%)
      • Exhibit: Market size and forecast 2021-2027 ($ million)
    • Spain
      • Exhibit: Chart on Market share 2021-2027 (%)
      • Exhibit: Market size and forecast 2021-2027 ($ million)
    • France
      • Exhibit: Chart on Market share 2021-2027 (%)
      • Exhibit: Market size and forecast 2021-2027 ($ million)
    • UK
      • Exhibit: Chart on Market share 2021-2027 (%)
      • Exhibit: Market size and forecast 2021-2027 ($ million)
    • Rest of Europe
      • Exhibit: Chart on Market share 2021-2027 (%)
      • Exhibit: Market size and forecast 2021-2027 ($ million)
  • Asia Pacific
    • Chart on Market share by country 2021-2027 (%)
    • Data Table on Market share by country 2021-2027(%)
    • China
      • Exhibit: Chart on Market share 2021-2027 (%)
      • Exhibit: Market size and forecast 2021-2027 ($ million)
    • India
      • Exhibit: Chart on Market share 2021-2027 (%)
      • Exhibit: Market size and forecast 2021-2027 ($ million)
    • Japan
      • Exhibit: Chart on Market share 2021-2027 (%)
      • Exhibit: Market size and forecast 2021-2027 ($ million)
    • South Korea
      • Exhibit: Chart on Market share 2021-2027 (%)
      • Exhibit: Market size and forecast 2021-2027 ($ million)
    • Rest of Asia Pacific
      • Exhibit: Chart on Market share 2021-2027 (%)
      • Exhibit: Market size and forecast 2021-2027 ($ million)
  • Latin America
    • Chart on Market share by country 2021-2027 (%)
    • Data Table on Market share by country 2021-2027(%)
    • Brazil
      • Exhibit: Chart on Market share 2021-2027 (%)
      • Exhibit: Market size and forecast 2021-2027 ($ million)
    • Rest of South America
      • Exhibit: Chart on Market share 2021-2027 (%)
      • Exhibit: Market size and forecast 2021-2027 ($ million)
  • Middle East & Africa (MEA)
    • Chart on Market share by country 2021-2027 (%)
    • Data Table on Market share by country 2021-2027(%)
    • GCC Countries
      • Exhibit: Chart on Market share 2021-2027 (%)
      • Exhibit: Market size and forecast 2021-2027 ($ million)
    • South Africa
      • Exhibit: Chart on Market share 2021-2027 (%)
      • Exhibit: Market size and forecast 2021-2027 ($ million)
    • Rest of MEA
      • Exhibit: Chart on Market share 2021-2027 (%)
      • Exhibit: Market size and forecast 2021-2027 ($ million)

KEY COMPANY PROFILES

  • Competitive Landscape
    • Total number of companies covered
      • Exhibit: companies covered in the report, 2021
    • Top companies market positioning
      • Exhibit: company positioning matrix, 2021
    • Top companies market Share
      • Exhibit: Pie chart analysis on company market share, 2021(%)

Methodology

For the Smart Stadium Market, our research methodology involved a mixture of primary and secondary data sources. Key steps involved in the research process are listed below:

1. Information Procurement: This stage involved the procurement of Market data or related information via primary and secondary sources. The various secondary sources used included various company websites, annual reports, trade databases, and paid databases such as Hoover's, Bloomberg Business, Factiva, and Avention. Our team did 45 primary interactions Globally which included several stakeholders such as manufacturers, customers, key opinion leaders, etc. Overall, information procurement was one of the most extensive stages in our research process.

2. Information Analysis: This step involved triangulation of data through bottom-up and top-down approaches to estimate and validate the total size and future estimate of the Smart Stadium Market.

3. Report Formulation: The final step entailed the placement of data points in appropriate Market spaces in an attempt to deduce viable conclusions.

4. Validation & Publishing: Validation is the most important step in the process. Validation & re-validation via an intricately designed process helped us finalize data points to be used for final calculations. The final Market estimates and forecasts were then aligned and sent to our panel of industry experts for validation of data. Once the validation was done the report was sent to our Quality Assurance team to ensure adherence to style guides, consistency & design.

Analyst Support

Customization Options

With the given market data, our dedicated team of analysts can offer you the following customization options are available for the Smart Stadium Market:

Product Analysis: Product matrix, which offers a detailed comparison of the product portfolio of companies.

Regional Analysis: Further analysis of the Smart Stadium Market for additional countries.

Competitive Analysis: Detailed analysis and profiling of additional Market players & comparative analysis of competitive products.

Go to Market Strategy: Find the high-growth channels to invest your marketing efforts and increase your customer base.

Innovation Mapping: Identify racial solutions and innovation, connected to deep ecosystems of innovators, start-ups, academics, and strategic partners.

Category Intelligence: Customized intelligence that is relevant to their supply Markets will enable them to make smarter sourcing decisions and improve their category management.

Public Company Transcript Analysis: To improve the investment performance by generating new alpha and making better-informed decisions.

Social Media Listening: To analyze the conversations and trends happening not just around your brand, but around your industry as a whole, and use those insights to make better Marketing decisions.

$5,300
BUY NOW

REQUEST FOR SAMPLE

Want to customize this report?
REQUEST FREE CUSTOMIZATION

FAQs

Global Smart Stadium Market size was valued at USD 8.66 Billion in 2023 and is poised to grow from USD 10.44 Billion in 2024 to USD 46.73 Billion by 2032, growing at a CAGR of 20.6% in the forecast period (2025-2032).

Key market participants in the smart stadium industry are developing new products to meet the increasing demand from other sectors. Many businesses are engaging in various activities and market developments such as new product launches, procurement contracts, mergers and acquisitions, increased investments, and the signing of agreements with other companies to increase their market share. To remain competitive, players in the smart stadium market must offer low-cost products. Supply chain optimization strategies are gaining traction among the smart stadium industry market leaders globally, who are frequently allocating research and development funding to this purpose. 'DB Schenker', 'Dignia Systems Ltd.', 'GP Smart Stadium', 'Hawk Eye Innovations Ltd.', 'Hewlett Packard Enterprise Co.', 'Honeywell International Inc.', 'Huawei Technologies Co. Ltd.', 'Infosys Ltd.', 'Intel Corp.', 'International Business Machines Corp.', 'Johnson Controls International Plc', 'Lumen Technologies Inc.', 'NEC Corp.', 'Nippon Telegraph and Telephone Corp.', 'Telefonaktiebolaget LM Ericsson', 'Weblib', 'DS worldwide Ltd.'

Operators of smart stadiums are not only able to enhance the customer experience but also create high-quality, customized offerings which increase spending thereby providing lucrative revenue sources for the operators. Due to the increased level of convenience, the cost of operation per fan increases, which in turn makes such a business model far more profitable. Moreover, smart stadiums also assist in data analysis of the fans’ behavior for recognition of marketing prospects and personalized promotions. Operators can improve pricing strategies for concessions, merchandise, and ticketing by analyzing the core consumer prices and spending patterns of smart stadium attendees and maximize revenue.

Incorporation of Advanced Technologies: The market's rising profit share is significantly driven by the adoption of cutting-edge technologies such as IoT, AI, AR and 5G solutions. The implementation of these technologies greatly enhances fan experience and increases fan turnout in the stadium, thus generating more revenue. IoT solutions such as haptic seats, smart ticketing and smart concessions improve the fan experience in smart stadiums. 5G networks allow fans to experience AR with reduced latencies.

Europe is dominating with the largest smart stadium market share. In addition to the growing integration of social media with stadium technologies, the European market is being propelled by a greater demand for enhanced viewing experiences. Furthermore, a growing number of stadium owners are being compelled to modernize their facilities due to regulatory measures aimed at securing public order during competitions. In March 2022, Real Madrid entered into a multi-year cooperation agreement with Cisco Systems Inc, by means of which will deploy the largest Wi-Fi 6 stadium network, hence making the Santiago Bernabeu Stadium one of the most technologically advanced sports venues worldwide. In addition, this multipurpose stadium will have more than 1200 Wi-Fi 6 access points, which allow for more data to be transmitted simultaneously at greater speeds and reliability than previous Wi-Fi technologies making the fan experience much more interactive.

Request Free Customization

Want to customize this report? This report can be personalized according to your needs. Our analysts and industry experts will work directly with you to understand your requirements and provide you with customized data in a short amount of time. We offer $1000 worth of FREE customization at the time of purchase.

logo-images

Feedback From Our Clients

Smart Stadium Market

Report ID: SQMIG25P2020

[email protected]
USA +1 351-333-4748

BUY NOW GET FREE SAMPLE