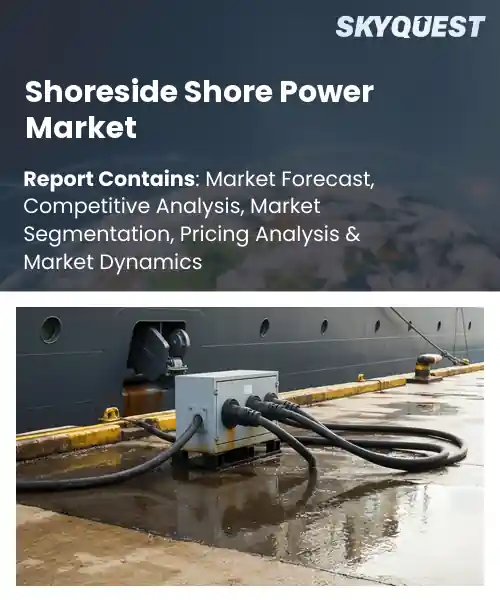
Shoreside Shore Power Market
Report ID: SQMIG10B2171
Report ID: SQMIG10B2171
[email protected]
USA +1 351-333-4748
Report ID:
SQMIG10B2171 |
Region:
Global |
Published Date: May, 2026
Pages:
157
|Tables:
200
|Figures:
80


Global Shoreside Shore Power Market size was valued at USD 1.6 Billion in 2024 and is poised to grow from USD 1.77 Billion in 2025 to USD 3.9 Billion by 2033, growing at a CAGR of 10.4% during the forecast period (2026-2033).
The main force behind the global shoreside shore power market growth is regulatory pressure, basically to reduce port emissions, which then nudges shipping firms and terminal operators to use onshore hookups so berthed vessels can be powered without running their own engines. Shoreside power, often also called cold ironing, lets a ship turn off auxiliary engines and plug into electricity from the dock, so it can sharply cut local nitrogen oxides , sulfur oxides and particulate matter that otherwise mess with nearby neighborhoods. This whole market really matters for air quality, compliance expenses and overall maritime competitiveness, and it has moved from early pilot runs in Northern Europe and California to broader rollouts in big container ports and cruise ports, showing that the approach is scalable and that teams learn over time.
On top of those regulatory drivers, one of the biggest things pushing adoption is investment in grid infrastructure and clean electricity sources because ports need dependable, low-carbon power to hit emissions targets without simply moving pollution inland. When utilities improve transmission capacity and bring in more renewables, shore power becomes practical for vessel calls and busier terminals. Then, cruise ships in Miami or container terminals in Singapore can connect during loading windows. That, in turn, opens commercial doors for equipment makers, energy service providers, and financing structures that package infrastructure costs together with port fees, which reduces the hurdle for smaller ports to join in and deploy shore power.
IoT enabled energy management is reshaping the market by tying together sensors, connectivity and cloud analytics, giving operators more visibility and tighter control. A few core parts show up again and again, real time monitoring of connections, automated load management that follows vessel demand, predictive maintenance for the equipment, and smoother integration of renewables , plus storage. In the background there is a broader push for decarbonization and higher reliability, and as ports modernize, operators also want better billing accuracy and less downtime. In practice, cloud based monitoring and data platforms help improve fault response and add operational transparency, so electrification feels more dependable for both shipping lines and terminal staff. ABB, January 2026 announced it was selected by Rotterdam Shore Power for a large multi terminal shore power project, including SCADA and data acquisition systems. This on the ground deployment shows how IoT enabled energy management can optimize power dispatch, improve billing accuracy and make it easier to integrate renewables, supporting market growth and efficiency.
Market snapshot - (2026-2033)
Global Market Size
USD 1.6 Billion
Largest Segment
Shore Connection Systems
Fastest Growth
Control & Monitoring Systems
Growth Rate
10.4% CAGR
To get more insights on this market click here to Request a Free Sample Report
The global shoreside shore power market is segmented by component, installation type, connection type, power rating, power source, deployment mode, end user, and region. Based on component, the market is segmented into Frequency Converters, Shore Connection Systems, Switchgear & Protection Systems, Transformers, Cable Management Systems, Control & Monitoring Systems and Others. Based on installation type, the market is segmented into New Installation and Retrofit Installation. Based on connection type, the market is segmented into High Voltage Shore Connection (HVSC) and Low Voltage Shore Connection (LVSC). Based on power rating, the market is segmented into Up to 5 MVA, 5–15 MVA and Above 15 MVA. Based on power source, the market is segmented into Grid-Powered Shore Systems, Renewable Integrated Shore Systems and Hybrid Shore Power Systems. Based on deployment mode, the market is segmented into Fixed Shore Power Systems and Mobile Shore Power Systems. Based on end user, the market is segmented into Port Authorities, Ship Operators, Naval & Defense Organizations and Offshore Energy Operators. Based on region, the market is segmented into North America, Europe, Asia Pacific, Latin America and Middle East & Africa.
As per the shoreside shore power market analysis, Transformers segment leads, mostly because transformers sit at the heart of voltage conditioning, galvanic isolation and resilience across shoreside shore power setups, letting it be safer to connect shore grids with all sorts of vessel electrical designs. Their durability and already-proven dependability lower the chances of long stoppages, plus they make meeting shipboard power rules feel a lot easier, so buyers tend to lean this way. Also, the utility fit, a long service span, and the key job of smoothing harmonics and handling short-lived transients are what keep investment attention locked in, so position transformers as basic infrastructure.
That said, Control & Monitoring Systems are the fastest moving part, as digital transformation brings remote diagnostics, and predictive maintenance improves what operators can actually see in real time, while cutting down the onboard staffing pressure. When these systems sync with grid management plus asset analytics, they open up fresh value streams, speed up regulatory signoff, and even create retrofit and modernization work that pulls in more adoption.
Renewable Integrated Shore Systems take the top spot because they can swap out fossil fuel usage directly on visiting vessels, and that matches the current momentum in regulation and corporate decarbonization. So ports that want lower emissions often pick this route, clearly. The mix of generation, storage, and smart dispatch helps ease overall grid load, trims the operational carbon footprint, and ends up steering procurement decisions. In practice this pulls in sustainability financing too, and it supports long-term operating models that push planning and investment toward renewables-first shore power installations.
Meanwhile, Hybrid Shore Power Systems are showing the strongest growth push, since their flexibility combines grid supply, distributed renewables, and energy storage to keep service steady when a single-source approach hits limits. With modular designs and adaptability to different vessel power needs, phased upgrades become more realistic, and scalable rollouts look easier. That, in turn, widens the commercial appeal and speeds up retrofit activity.
To get detailed segments analysis, Request a Free Sample Report
Europe dominates the global shoreside shore power market because the regulatory setup is aligned, the ports already have big infrastructure, and everyone started pushing maritime emissions cuts early. There’s this coordinated planning thing, port authorities, utilities , and equipment manufacturers, so the whole project pipeline feels predictable, which then pulls in money for new tech and investment. Also, there’s a deep industrial base and engineering firms that know their way around retrofits and they can handle complex system integration without too much chaos. At the same time, standardization efforts that are collaborative lower interoperability hurdles, and public private partnerships plus some targeted funding help to soften the capital intensity part. And, strong urban air quality goals along the coast keep the demand steady, while research centers and marine clusters keep tightening the operational best practices and deployment models, again and again.
Germany Shoreside Shore Power Market
Shoreside Shore Power Market in Germany is formed by a strong port network, engineering capacity, and a pragmatic mindset around grid integration. Port and regional authorities work together with manufacturers and utilities on project designs that really stress interoperability and long term performance. A mature industrial supply chain backs up turnkey delivery and even lifecycle service models, and then academic and research institutions show up too, they help drive standards development and performance optimization. The retrofit experience also makes the new build rollout strategies fit together well, like it’s complementary not competing.
United Kingdom Shoreside Shore Power Market
Shoreside Shore Power Market in United Kingdom is pushed forward by coordinated port modernization, environmental regulation , and close collaboration between port authorities, utilities, and ship operators. The emphasis on flexible power delivery and interoperability has opened space for pilot deployments and technology trials across a bunch of berths that are different from one another. Service providers talk a lot about uptime , maintenance , and training for the installation teams, so the rollout doesn’t get stuck later. Consultative planning between local governments and private investors supports scalable expansion and it ties into improved urban air quality targets.
France Shoreside Shore Power Market
Shoreside Shore Power Market in France is shaped by strategic port electrification, coordination across maritime clusters, and solid engineering capability. Port authorities partner with utilities and equipment manufacturers to deliver adaptable connections , plus shore equipment that fits different vessel types. The focus stays on environmental performance and community engagement, and that helps with local acceptance. Project methods prioritize reliability, scalable infrastructure , and integration with renewable energy, so port emissions drop and coastal air quality improves where it matters.
Asia Pacific is seeing fast expansion in the shoreside shore power market because ports are modernizing, there’s solid regional manufacturing capability in electrical and maritime technologies, and there’s close collaboration between shipbuilding yards and equipment suppliers. Governments and port authorities are putting emissions reduction high on the list especially for crowded coastal zones, which leads to pilot programs and infrastructure upgrades. There’s high maritime activity near major urban centers, so get strong operational incentives but also public health incentives that don’t feel abstract. Domestic engineering firms and utilities are building adaptable connection systems and grid integration methods that match local vessel profiles, not some one size idea. Cross sector partnerships speed up deployment, and retrofit experience keeps informing scalable operating models plus alignment on regional technical specifications. Targeted funding mechanisms and capacity building for port engineers and operators also reduce deployment friction and help sustain maintenance frameworks across multiple ports.
Japan Shoreside Shore Power Market
Shoreside Shore Power Market in Japan benefits from a mature shipbuilding ecosystem, plus very precise engineering expertise. Port authorities coordinate with utilities and equipment manufacturers to test adaptable connection systems and grid management solutions. The focus is on equipment reliability and vessel interfacing, and that supports localized testing and standards development. Partnerships between tech firms, research institutes , and operators aim for durable installations and workforce training, so wider retrofit , and also new installation efforts, can move forward across more ports.
South Korea Shoreside Shore Power Market
Shoreside Shore Power Market in South Korea benefits from a strong shipbuilding industry, advanced electrical manufacturing, and a clear push toward port modernization. Port operators, utilities, and equipment suppliers collaborate to deliver reliable modular systems and faster deployment approaches. There’s an emphasis on grid compatibility and standardized interfaces, which helps interoperability across vessel classes. Industry clusters and research centers work with operators to improve maintenance and training too, which supports efficient retrofit pathways and scalable installation methods across terminals.
North America is strengthening its position in the shoreside shore power market, mainly by doing targeted investments in ports, closer utility engagement, and also more public-private collaboration that keeps growing. Port authorities are basically blending shore power into wider decarbonization and resilience planning, and they are coordinating with grid operators to handle capacity limits and connection tactics. Meanwhile equipment manufacturers and service providers are working on ruggedized hardware, plus modular installation approaches, that fit with very different berth conditions, so it does not feel one-size-fits-all. There is also emphasis on workforce development, maintenance protocols, and interoperability testing, which reduces operational friction, and helps teams avoid surprise downtime. At the same time cross border knowledge exchange, along with pilot programs, refines technical standards, while research institutions and energy companies align on grid friendly solutions that integrate renewables and storage for steadier operations.
United States Shoreside Shore Power Market
Shoreside shore power market in United States is pushed forward by big commercial and cruise ports that prioritize emissions reduction, and resilience. Port authorities work alongside utilities and equipment suppliers on flexible connection systems, plus grid management planning. Industry groups and academic partners are collaborating on standards, interoperability testing, and training, so maintenance stays supported and consistent. Public-private coordination, and financing models too, are trying to cut down deployment hurdles and make it easier to scale retrofit work, plus new installations across different port layouts.
Canada Shoreside Shore Power Market
Shoreside shore power market in Canada is driven by commitments to cleaner port operations and collaboration among utilities, port authorities, and equipment providers. The focus stays on adaptable connection designs and grid integration, which helps address varying harbour conditions, and those cold climate constraints. Research partners push ahead with standards, reliability testing, and maintenance regimes, designed for terminals that face harsher environments. Coordination between public agencies and private investors supports financing strategies that enable retrofits, and also new installations at ports across multiple regions.
To know more about the market opportunities by region and country, click here to
Buy The Complete Report
Drivers
Stricter Emission Regulations Worldwide
Port Electrification Investment Incentives
Restraints
High Infrastructure and Retrofit Costs
Grid Capacity and Interconnection Challenges
Request Free Customization of this report to help us to meet your business objectives.
Competition across the global shoreside shore power market is getting more and more intense, as older players and newer entrants chase port agreements consortium pilots, plus some tech differentiation that’s being pushed by tighter port decarbonization rules . Companies then go for alliances and product launches, like Stillstrom taking charge of an EU backed offshore charging pilot , and Cavotec grabbing multi market shore power deals while also doing corporate reshaping and even acquisition style moves.
Top Player’s Company Profile
Recent Developments
SkyQuest’s ABIRAW (Advanced Business Intelligence, Research & Analysis Wing) is our Business Information Services team that Collects, Collates, Correlates, and Analyses the Data collected by means of Primary Exploratory Research backed by robust Secondary Desk research.
As per SkyQuest analysis, the global shoreside shore power market is being pushed mainly by regulatory pressure to cut port emissions. That pressure basically forces ports and ship operators to use onshore power, so they can hit air quality requirements and compliance targets. Adoption is also sped up by investment in grid infrastructure, and by cleaner electricity, which helps keep connections reliable and low carbon. Still, growth is held back because infrastructure upgrades and retrofit costs are high, which raises capital hurdles and stretches payback periods. Europe stays the leading region, largely due to earlier regulatory alignment and fairly mature port ecosystems. In terms of components, transformers lead the mix, because they support critical voltage adaptation and resilience for shore connections.
| Report Metric | Details |
|---|---|
| Market size value in 2024 | USD 1.6 Billion |
| Market size value in 2033 | USD 3.9 Billion |
| Growth Rate | 10.4% |
| Base year | 2024 |
| Forecast period | (2026-2033) |
| Forecast Unit (Value) | USD Billion |
| Segments covered |
|
| Regions covered | North America (US, Canada), Europe (Germany, France, United Kingdom, Italy, Spain, Rest of Europe), Asia Pacific (China, India, Japan, Rest of Asia-Pacific), Latin America (Brazil, Rest of Latin America), Middle East & Africa (South Africa, GCC Countries, Rest of MEA) |
| Companies covered |
|
| Customization scope | Free report customization with purchase. Customization includes:-
|
To get a free trial access to our platform which is a one stop solution for all your data requirements for quicker decision making. This platform allows you to compare markets, competitors who are prominent in the market, and mega trends that are influencing the dynamics in the market. Also, get access to detailed SkyQuest exclusive matrix.
Table Of Content
Executive Summary
Market overview
Parent Market Analysis
Market overview
Market size
KEY MARKET INSIGHTS
COVID IMPACT
MARKET DYNAMICS & OUTLOOK
Market Size by Region
KEY COMPANY PROFILES
Methodology
For the Shoreside Shore Power Market, our research methodology involved a mixture of primary and secondary data sources. Key steps involved in the research process are listed below:
1. Information Procurement: This stage involved the procurement of Market data or related information via primary and secondary sources. The various secondary sources used included various company websites, annual reports, trade databases, and paid databases such as Hoover's, Bloomberg Business, Factiva, and Avention. Our team did 45 primary interactions Globally which included several stakeholders such as manufacturers, customers, key opinion leaders, etc. Overall, information procurement was one of the most extensive stages in our research process.
2. Information Analysis: This step involved triangulation of data through bottom-up and top-down approaches to estimate and validate the total size and future estimate of the Shoreside Shore Power Market.
3. Report Formulation: The final step entailed the placement of data points in appropriate Market spaces in an attempt to deduce viable conclusions.
4. Validation & Publishing: Validation is the most important step in the process. Validation & re-validation via an intricately designed process helped us finalize data points to be used for final calculations. The final Market estimates and forecasts were then aligned and sent to our panel of industry experts for validation of data. Once the validation was done the report was sent to our Quality Assurance team to ensure adherence to style guides, consistency & design.
Analyst Support
Customization Options
With the given market data, our dedicated team of analysts can offer you the following customization options are available for the Shoreside Shore Power Market:
Product Analysis: Product matrix, which offers a detailed comparison of the product portfolio of companies.
Regional Analysis: Further analysis of the Shoreside Shore Power Market for additional countries.
Competitive Analysis: Detailed analysis and profiling of additional Market players & comparative analysis of competitive products.
Go to Market Strategy: Find the high-growth channels to invest your marketing efforts and increase your customer base.
Innovation Mapping: Identify racial solutions and innovation, connected to deep ecosystems of innovators, start-ups, academics, and strategic partners.
Category Intelligence: Customized intelligence that is relevant to their supply Markets will enable them to make smarter sourcing decisions and improve their category management.
Public Company Transcript Analysis: To improve the investment performance by generating new alpha and making better-informed decisions.
Social Media Listening: To analyze the conversations and trends happening not just around your brand, but around your industry as a whole, and use those insights to make better Marketing decisions.
REQUEST FOR SAMPLE
 REQUEST FREE CUSTOMIZATION
Global Shoreside Shore Power Market size was valued at USD 1.6 Billion in 2024 and is poised to grow from USD 1.77 Billion in 2025 to USD 3.9 Billion by 2033, growing at a CAGR of 10.4% during the forecast period (2026-2033).
Competition in the global shoreside shore power market has intensified as incumbents and new entrants pursue port contracts, consortium pilots, and technology differentiation driven by stricter port decarbonization mandates. Firms execute partnerships and product rollouts, for example Stillstrom leading an EU funded offshore charging pilot, and Cavotec securing multimarket shore power contracts while pursuing corporate restructuring and acquisition moves. 'ABB', 'Siemens', 'Schneider Electric', 'General Electric', 'Cavotec', 'Eaton', 'Wärtsilä', 'Hitachi Energy', 'Danfoss', 'PowerCon', 'Wabtec Corporation', 'Siemens Energy', 'AEG Power Solutions', 'Emerson Electric', 'Konecranes', 'VINCI Energies', 'ESL Power Systems', 'Norwegian Electric Systems', 'Piller Power Systems', 'Stemmann-Technik'
Mandated limits on air pollutants and greenhouse gases at ports encourage port authorities and shipping operators to adopt shore power to reduce vessel emissions while berthed. Such regulations create clear compliance imperatives and stimulate investment in onshore electrical infrastructure as a preferred mitigation measure, prompting coordinated planning between utilities, terminal operators, and stakeholders. The regulatory focus also elevates the priority of low emission solutions in port masterplans, accelerating project approvals and incentivizing public and private funding commitments that directly support market expansion.
Renewable Integration With Shore Power: The accelerating focus on renewable energy integration is reshaping shore power value propositions by enabling lower-carbon electricity for docked vessels and aligning with corporate decarbonization commitments. Port operators, utilities and renewable developers are forming partnerships to interconnect wind and solar generation, paired with energy management systems and storage, to smooth variability and ensure supply reliability. This qualitative shift enhances environmental credibility, attracts corporate and regulatory support, and improves project acceptability and long-term strategic alignment across stakeholders, driving broader adoption.
Why does Europe Dominate the Global Shoreside Shore Power Market? |@12


Want to customize this report? This report can be personalized according to your needs. Our analysts and industry experts will work directly with you to understand your requirements and provide you with customized data in a short amount of time. We offer $1000 worth of FREE customization at the time of purchase.
Feedback From Our Clients


 USA (+1) 351-333-4748

