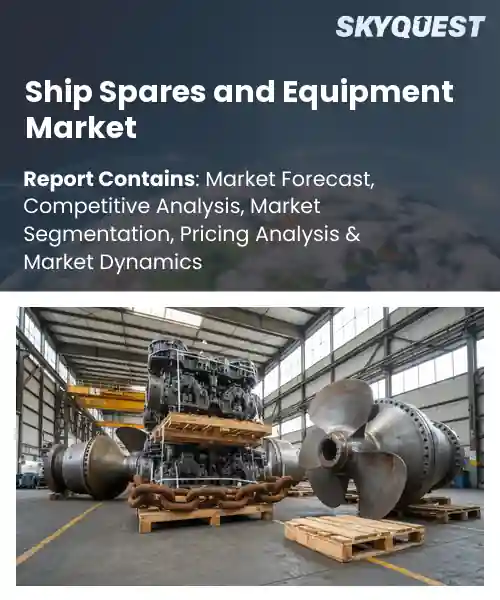
Ship Spares and Equipment Market
Report ID: SQMIG15F2371
Report ID: SQMIG15F2371
[email protected]
USA +1 351-333-4748
Report ID:
SQMIG15F2371 |
Region:
Global |
Published Date: June, 2026
Pages:
157
|Tables:
179
|Figures:
79


Global Ship Spares And Equipment Market size was valued at USD 13.1 Billion in 2024 and is poised to grow from USD 14.03 Billion in 2025 to USD 24.29 Billion by 2033, growing at a CAGR of 7.1% during the forecast period (2026-2033).
The ship spares and equipment market provides replacement parts and consumables that keep ships moving and not stuck. Its relevance is obvious once if one important component is delayed a container ship can end up grounded for days, pushing charter rates up and messing with supply chains. For a long time, the market was mostly led by OEMs , but now there’s a noticeable shift toward the aftermarket, mainly because the fleet is aging and the regulations are becoming stricter. The IMO Tier III emissions standards acted like a trigger, owners had to retrofit exhaust treatment units and that sparked demand for specialized catalysts and control modules.
Moreover, digitalization combined with predictive maintenance is driving the ship spares and equipment market growth. Sensors on propulsion and auxiliary systems feed real-time information, operators use it to foresee failures , and then they request the exact spare part rather than just holding huge inventories. That change also nudges manufacturers to launch remote service platforms. For instance Wärtsilä’s Fleet Operations Solution, can arrange spare-part delivery within hours after an anomaly is detected. The faster provisioning part then creates a stronger need for regional hubs near major ports, which cuts lead times, and can help lower emissions too. At the same time, sustainability rules keep tightening, so owners are also retrofitting with low-emission scrubbers and hybrid modules, which broadens the product mix and opens up more revenue opportunities.
AI-driven predictive maintenance is changing the ship spares and equipment market outlook from a “fix it later” model into something closer to prevention. Instead of waiting for trouble, sensors gather real-time performance data from engines, pumps and even navigation-related systems. Then machine-learning models pick up on wear patterns , so they can forecast when a component is likely to fail. With this early warning, operators can schedule replacements ahead of time, which helps reduce sudden downtime and also supports longer asset life. There’s also the supply-side effect: inventory management gets less guessy. Spare parts are ordered from predictive insights rather than from older consumption habits, so storage costs can drop and cash flow usually looks healthier. Ship owners gain from higher availability, and crews see fewer emergency interventions, so day to day operations become more reliable across different regions and fleets.
Market snapshot - (2026-2033)
Global Market Size
USD 13.1 Billion
Largest Segment
Engine & Propulsion Spares
Fastest Growth
Navigation & Communication Equipment
Growth Rate
7.1% CAGR
To get more insights on this market click here to Request a Free Sample Report
The global ship spares and equipment market is segmented by product type, vessel type, application, end user, supply type, distribution channel, and region. Based on product type, the market is categorized into Engine & Propulsion Spares, Deck & Mooring Equipment, Electrical & Automation Equipment, Navigation & Communication Equipment, Safety & Life-Saving Equipment, and Others. Based on vessel type, the market is divided into Cargo Ships, Tankers, Passenger Ships & Cruise Vessels, Offshore Support Vessels, Naval & Defense Vessels, and Others. Based on application, the market is segmented into Maintenance & Repair, Retrofit & Upgrade, and New Vessel Supply. Based on end user, the market is classified into Commercial Shipping Companies, Shipyards, Naval & Defense Organizations, Offshore Oil & Gas Operators, and Others. Based on supply type, the market is bifurcated into OEM Parts & Equipment and Aftermarket Parts & Equipment. Based on the distribution channel, the market is segmented into Direct Sales, Marine Equipment Distributors, Ship Chandlers, and Others. Geographically, the market is analyzed across North America, Europe, Asia Pacific, Latin America, and the Middle East & Africa.
As per the ship spares and equipment market analysis, the Engine & Propulsion Spares segment is the one that leads, because it is essential, like literally, for keeping commercial vessels at their core performance level. Propulsion reliability ends up, directly, setting how well a ship can stick to its timeline and also how efficiently it burns fuel. Ship owners tend to push for original equipment manufacturer quality, and then they want replacement cycles that are fast not slow. So there’s this continuous appetite for these parts. And because engine health is so critical, plus the downtime penalties are strict, the segment keeps getting favored across the whole global fleet, without much real change.
On the other hand, the Navigation & Communication Equipment segment emerges as the fastest-growing segment, because autonomous navigation techniques and integrated communication packages are being adopted more widely. That makes the demand for advanced sensors, satellite links, and digital chart systems start rising quickly. It is being pulled along by regulatory safety pushes, and also by operators who want real time data analytics, which is a new baseline for decision-making. As a result, this segment becomes a catalyst for additional market expansion later on.
According to the ship spares and equipment market forecast, the Cargo Ships segment dominates, mostly because global trade moves in large quantities and it mostly leans on these vessels. So they become the main buyers for ship spares and safety equipment as well. Since they run continuously, with tight operational windows, they end up needing frequent maintenance and more regular component swapping. This is especially true for propulsion related parts and for cargo handling gear, but safety kits are part of that same maintenance rhythm. Because of this, operators tend to lean toward dependable aftermarket support and OEM reliability, which keeps purchasing patterns steady and strong across the market.
However, the Offshore Support Vessels segment shows up as the one with the quickest expansion because offshore energy programs are intensifying. That increases the need for specialized deck and mooring equipment, along with sturdy navigation and safety hardware. Also, harsh sea conditions mean high availability becomes non negotiable, and that pushes procurement cycles to happen faster. So the safety & life-saving equipment demand grows in parallel, which opens new growth avenues and widens the overall market footprint.
To get detailed segments analysis, Request a Free Sample Report
As per the ship spares and equipment market regional forecast, Asia Pacific keeps a leading role mostly because there is a mix of advanced manufacturing, long maritime roots, and supply chains that just seem to work better than many other regions. The area actually enjoys big shipbuilding capacity, so there’s always pressure for a steady supply of high‑quality parts. Due to that, there are close relationships between original equipment manufacturers and the downstream service guys who install , maintain, and upgrade. On top of that, strategic port clusters and logistics hubs make it easier to move spares quickly across local routes and out into international lanes. And then there’s a skilled engineering workforce that keeps pushing retrofit programs and digital monitoring approaches, which pulls demand upward by itself. Government support, especially around sustainability and vessel efficiency, also makes operators look harder for modern spares, so Asia Pacific becomes both a production powerhouse and a serious procurement hub for global players.
Japan Ship Spares and Equipment Market
The Ship Spares and Equipment sector in Japan is built on a long history of precision engineering plus a dense web of specialized suppliers. Japanese shipyards tend to keep close ties with component manufacturers, so access to advanced parts is generally faster and smoother. At the same time, initiatives aimed at updating older fleets and switching toward green propulsion systems are keeping retrofit demand active. There’s also a collaborative research ecosystem, which helps smart monitoring devices move from idea to deployment sooner than you’d expect. Together, these elements keep Japan as a key supplier and connector inside the regional supply chain.
South Korea Ship Spares and Equipment Market
In South Korea, the Ship Spares and Equipment industry benefits from both large‑scale shipbuilding players and nimble tier‑one suppliers. The country’s emphasis on high‑efficiency vessel construction creates an ongoing need for reliable propulsion as well as navigation related components. Lately, investments in digital ship management platforms are boosting interest in integrated sensor suites and predictive maintenance tools. And because shipyards and aftermarket distributors coordinate closely, lead times tend to shrink. That quick-response rhythm helps strengthen South Korea’s reputation as a hub that can react fast for maritime operators worldwide.
The European ship spares and equipment market penetration is growing due to regulations that strongly push emissions cuts, while many operators still manage a mature fleet that needs more advanced maintenance. Across major maritime countries, industry clusters are also working together, which supports innovation in modular components and digital twin type solutions. This gives ship owners improved reliability, and often better cost control too. Another factor is the presence of top tier engineering firms, so technical knowledge stays high. Plus, ports and infrastructure are fairly strong, which makes logistics feel less complicated. More and more operators are also prioritizing green retrofits, and even circular economy principles, so there’s growing appetite for parts that can be reused or recycled. All of this places Europe in a position where sustainability and advanced engineering overlap, and that overlap is helping the market expand faster.
Germany Ship Spares and Equipment Market
The Ship Spares and Equipment industry in Germany stands out because there’s a compact ecosystem of precision manufacturers and engineering research institutes. German suppliers are especially strong in high‑performance propulsion systems and automation, which supports a fleet that wants reliability and a technological edge. When shipyards collaborate with component makers, emission-control solutions can be integrated more quickly. Germany also leans into standardization and quality assurance, which builds trust for international operators trying to rely on dependable aftermarket support.
United Kingdom Ship Spares and Equipment Market
The Ship Spares and Equipment Market in the United Kingdom has a lively blend of legacy shipyards alongside specialist firms that keep expanding. The UK’s geographic role as a gateway to Atlantic routes increases demand for advanced navigation and safety equipment. On the policy side, government initiatives linked to decarbonization are encouraging adoption of hybrid propulsion components and offshore wind support vessel related hardware, which ends up accelerating aftermarket activity. There’s also a network of innovation hubs that connects classic engineering talent with newer digital services. Because of that, the United Kingdom is trending as a focal point for quicker market growth.
France Ship Spares and Equipment Market
The Ship Spares and Equipment Market share in France is developing through naval engineering experience paired with rising offshore renewable initiatives. French suppliers often focus on niche propulsion modules and more sophisticated control systems, which helps them serve a broad mix of vessel types. Growth in green retrofitting efforts, plus work on autonomous vessel prototypes, is increasing demand for specialized retrofit kits and sensor arrays. And with collaboration frameworks spanning shipyards, research centers, and maritime clusters, France is better positioned to deliver tailored solutions as the market keeps changing.
North America keeps pushing its influence in the ship spares and equipment world by mixing a lot of day to day commercial vessel work with some fairly new technological development. This can be seen in how the big ports act like key distribution points, which makes it easier to get components out to operators along the Atlantic and Pacific routes. At the same time there are strong relationships between defense contractors, research universities, and private producers, and that combination helps ideas move faster toward smart monitoring, improved propulsion efficiency, and better alternative fuel integration. Plus, more money going into coastal infrastructure and offshore energy activity is creating a steady need for trustworthy replacement parts, and also for retrofit solutions that actually work in practice. And then there is the whole regulatory and sustainability angle, which keeps pushing people to choose advanced low‑emission gear, so North America ends up being not only a major consumer hub but also a place that produces pioneering maritime technology.
United States Ship Spares and Equipment Market
In the United States, the ship spares and equipment market basically rides on the sheer size of the commercial fleet, plus a supplier landscape that is very varied. Top manufacturers bring out propulsion, power management, and digital analytics solutions that fit both local operations and longer trans‑oceanic runs. There are also joint efforts between ship operators and tech companies that help predictive maintenance systems get deployed earlier, rather than waiting forever. With solid logistics networks, and ports that are somewhat specialized, delivery times tend to shrink. On top of that, the regulatory push toward lower emissions directly boosts demand for clean‑technology retrofits, which then makes the U.S. a central piece of the regional supply chain.
Canada Ship Spares and Equipment Market
Canada’s ship spares and equipment market is driven by northern and coastal shipping realities, where reliability matters, and cold‑weather performance is non negotiable. Many Canadian companies focus on tough hull related components, ice‑class propulsion systems, and navigation gear that can handle harsh weather. There are partnerships with offshore renewable developers too, and those links increase demand for modular retrofit kits that are low‑emission by design. Intermodal transport connections are fairly efficient, and Canada’s closeness to major Atlantic gateways also supports faster spare parts distribution across the continent. All of this makes Canada a dependable source for high‑quality maritime solutions, even when conditions are not easy.
To know more about the market opportunities by region and country, click here to
Buy The Complete Report
Growing Global Trade Volumes
Regulatory Compliance Prompting Upgrades
Fluctuating Raw Material Prices
Extended Vessel Lifecycle Reducing Replacement
Request Free Customization of this report to help us to meet your business objectives.
In this ship spares and equipment market, things are intense, like rivalry between the big shipbuilders and the technology people who actually build the systems. There is Hyundai Heavy Industries keeps pushing ahead by leaning into strategic partnerships with innovators such as Framergy, while Daewoo Shipbuilding seems to expand its portfolio through joint ventures and a handful of targeted buys of smaller niche parts distributors. And somehow these decisions end up squeezing the competition harder, then the whole industry moves faster toward digital and AI‑enabled maintenance options, like it’s a reflex.
Top Player’s Company Profile
Recent Developments in the Ship Spares and Equipment Market
SkyQuest’s ABIRAW (Advanced Business Intelligence, Research & Analysis Wing) is our Business Information Services team that Collects, Collates, Correlates, and Analyses the Data collected by means of Primary Exploratory Research backed by robust Secondary Desk research.
As per SkyQuest analysis, the global ship spares and equipment market is predicted to growth due to the rising global trade volumes that basically pressure operators to keep ships running near peak efficiency. Another strong driver is stricter regulatory compliance , which is forcing owners to retrofit fleets with low emission upgrades along with ballast water treatment solutions. Growth though is tempered by swinging raw material prices, so purchases can get delayed and margins can feel squeezed. Asia Pacific stays the lead region due to its wide shipbuilding footprint and connected supply chains. Engine and propulsion spares still dominate the segment landscape, probably because the propulsion side needs to stay reliable, consistently.
| Report Metric | Details |
|---|---|
| Market size value in 2024 | USD 13.1 Billion |
| Market size value in 2033 | USD 24.29 Billion |
| Growth Rate | 7.1% |
| Base year | 2024 |
| Forecast period | (2026-2033) |
| Forecast Unit (Value) | USD Billion |
| Segments covered |
|
| Regions covered | North America (US, Canada), Europe (Germany, France, United Kingdom, Italy, Spain, Rest of Europe), Asia Pacific (China, India, Japan, Rest of Asia-Pacific), Latin America (Brazil, Rest of Latin America), Middle East & Africa (South Africa, GCC Countries, Rest of MEA) |
| Companies covered |
|
| Customization scope | Free report customization with purchase. Customization includes:-
|
To get a free trial access to our platform which is a one stop solution for all your data requirements for quicker decision making. This platform allows you to compare markets, competitors who are prominent in the market, and mega trends that are influencing the dynamics in the market. Also, get access to detailed SkyQuest exclusive matrix.
Table Of Content
Executive Summary
Market overview
Parent Market Analysis
Market overview
Market size
KEY MARKET INSIGHTS
COVID IMPACT
MARKET DYNAMICS & OUTLOOK
Market Size by Region
KEY COMPANY PROFILES
Methodology
For the Ship Spares and Equipment Market, our research methodology involved a mixture of primary and secondary data sources. Key steps involved in the research process are listed below:
1. Information Procurement: This stage involved the procurement of Market data or related information via primary and secondary sources. The various secondary sources used included various company websites, annual reports, trade databases, and paid databases such as Hoover's, Bloomberg Business, Factiva, and Avention. Our team did 45 primary interactions Globally which included several stakeholders such as manufacturers, customers, key opinion leaders, etc. Overall, information procurement was one of the most extensive stages in our research process.
2. Information Analysis: This step involved triangulation of data through bottom-up and top-down approaches to estimate and validate the total size and future estimate of the Ship Spares and Equipment Market.
3. Report Formulation: The final step entailed the placement of data points in appropriate Market spaces in an attempt to deduce viable conclusions.
4. Validation & Publishing: Validation is the most important step in the process. Validation & re-validation via an intricately designed process helped us finalize data points to be used for final calculations. The final Market estimates and forecasts were then aligned and sent to our panel of industry experts for validation of data. Once the validation was done the report was sent to our Quality Assurance team to ensure adherence to style guides, consistency & design.
Analyst Support
Customization Options
With the given market data, our dedicated team of analysts can offer you the following customization options are available for the Ship Spares and Equipment Market:
Product Analysis: Product matrix, which offers a detailed comparison of the product portfolio of companies.
Regional Analysis: Further analysis of the Ship Spares and Equipment Market for additional countries.
Competitive Analysis: Detailed analysis and profiling of additional Market players & comparative analysis of competitive products.
Go to Market Strategy: Find the high-growth channels to invest your marketing efforts and increase your customer base.
Innovation Mapping: Identify racial solutions and innovation, connected to deep ecosystems of innovators, start-ups, academics, and strategic partners.
Category Intelligence: Customized intelligence that is relevant to their supply Markets will enable them to make smarter sourcing decisions and improve their category management.
Public Company Transcript Analysis: To improve the investment performance by generating new alpha and making better-informed decisions.
Social Media Listening: To analyze the conversations and trends happening not just around your brand, but around your industry as a whole, and use those insights to make better Marketing decisions.
REQUEST FOR SAMPLE
 REQUEST FREE CUSTOMIZATION
Global Ship Spares And Equipment Market size was valued at USD 13.1 Billion in 2024 and is poised to grow from USD 14.03 Billion in 2025 to USD 24.29 Billion by 2033, growing at a CAGR of 7.1% during the forecast period (2026-2033).
The ship spares and equipment market is shaped by intense rivalry among major shipbuilders and technology providers. Hyundai Heavy Industries accelerates growth through strategic partnerships with innovators such as Framergy, while Daewoo Shipbuilding expands its portfolio via joint ventures and selective acquisitions of niche parts distributors. These moves intensify competition and drive rapid adoption of digital and AI‑enabled maintenance solutions. 'Wärtsilä Corporation', 'MAN Energy Solutions', 'Kongsberg Maritime', 'ABB Marine & Ports', 'Alfa Laval AB', 'Caterpillar Marine', 'Rolls-Royce Power Systems', 'Yanmar Marine International', 'Furuno Electric Co., Ltd.', 'Japan Radio Co., Ltd.', 'Sperry Marine', 'MacGregor', 'Wilhelmsen Ship Service', 'VIKING Life-Saving Equipment', 'Survitec Group', 'Trelleborg Marine Systems', 'SKF Group', 'Parker Hannifin Corporation', 'Bosch Rexroth AG', 'Hempel A/S'
Global trade expansion increases vessel deployments, leading to higher operational hours and more frequent maintenance cycles. As shipping companies strive to sustain efficiency, the demand for reliable spare parts and advanced equipment rises. Continuous cargo movement creates pressure on ship owners to minimize downtime, prompting proactive procurement strategies. This environment encourages manufacturers to develop comprehensive product ranges and support services, thereby stimulating market growth through sustained client engagement and recurring purchase requirements and fostering long‑term supplier relationships across the industry.
Digital Twin Integration: Digital twin technology is being integrated into ship spares logistics, enabling real‑time simulation of component wear and predictive maintenance scheduling. Operators can virtually test replacements before physical installation, reducing downtime and ensuring compatibility. This proactive approach drives inventory optimization, as spare parts are stocked based on simulated failure forecasts rather than historical averages. The resulting efficiency gains improve vessel availability, lower operational costs, and create new service models for equipment providers, positioning them as strategic partners in fleet performance management.
Why does Asia Pacific Dominate the Global Ship Spares and Equipment Market? |@12


Want to customize this report? This report can be personalized according to your needs. Our analysts and industry experts will work directly with you to understand your requirements and provide you with customized data in a short amount of time. We offer $1000 worth of FREE customization at the time of purchase.
Feedback From Our Clients


 USA (+1) 351-333-4748

