Shale Gas Market Size, Share, and Growth Analysis

Global Shale Gas Market

Shale Gas Market By Technology (Horizontal fracking, Vertical fracking), By Application (Power Generation, Industrial), By Region - Industry Forecast 2025-2032


Report ID: SQMIG10D2049 | Region: Global | Published Date: February, 2025
Pages: 195 |Tables: 91 |Figures: 71

Format - word format excel data power point presentation

Shale Gas Market Insights

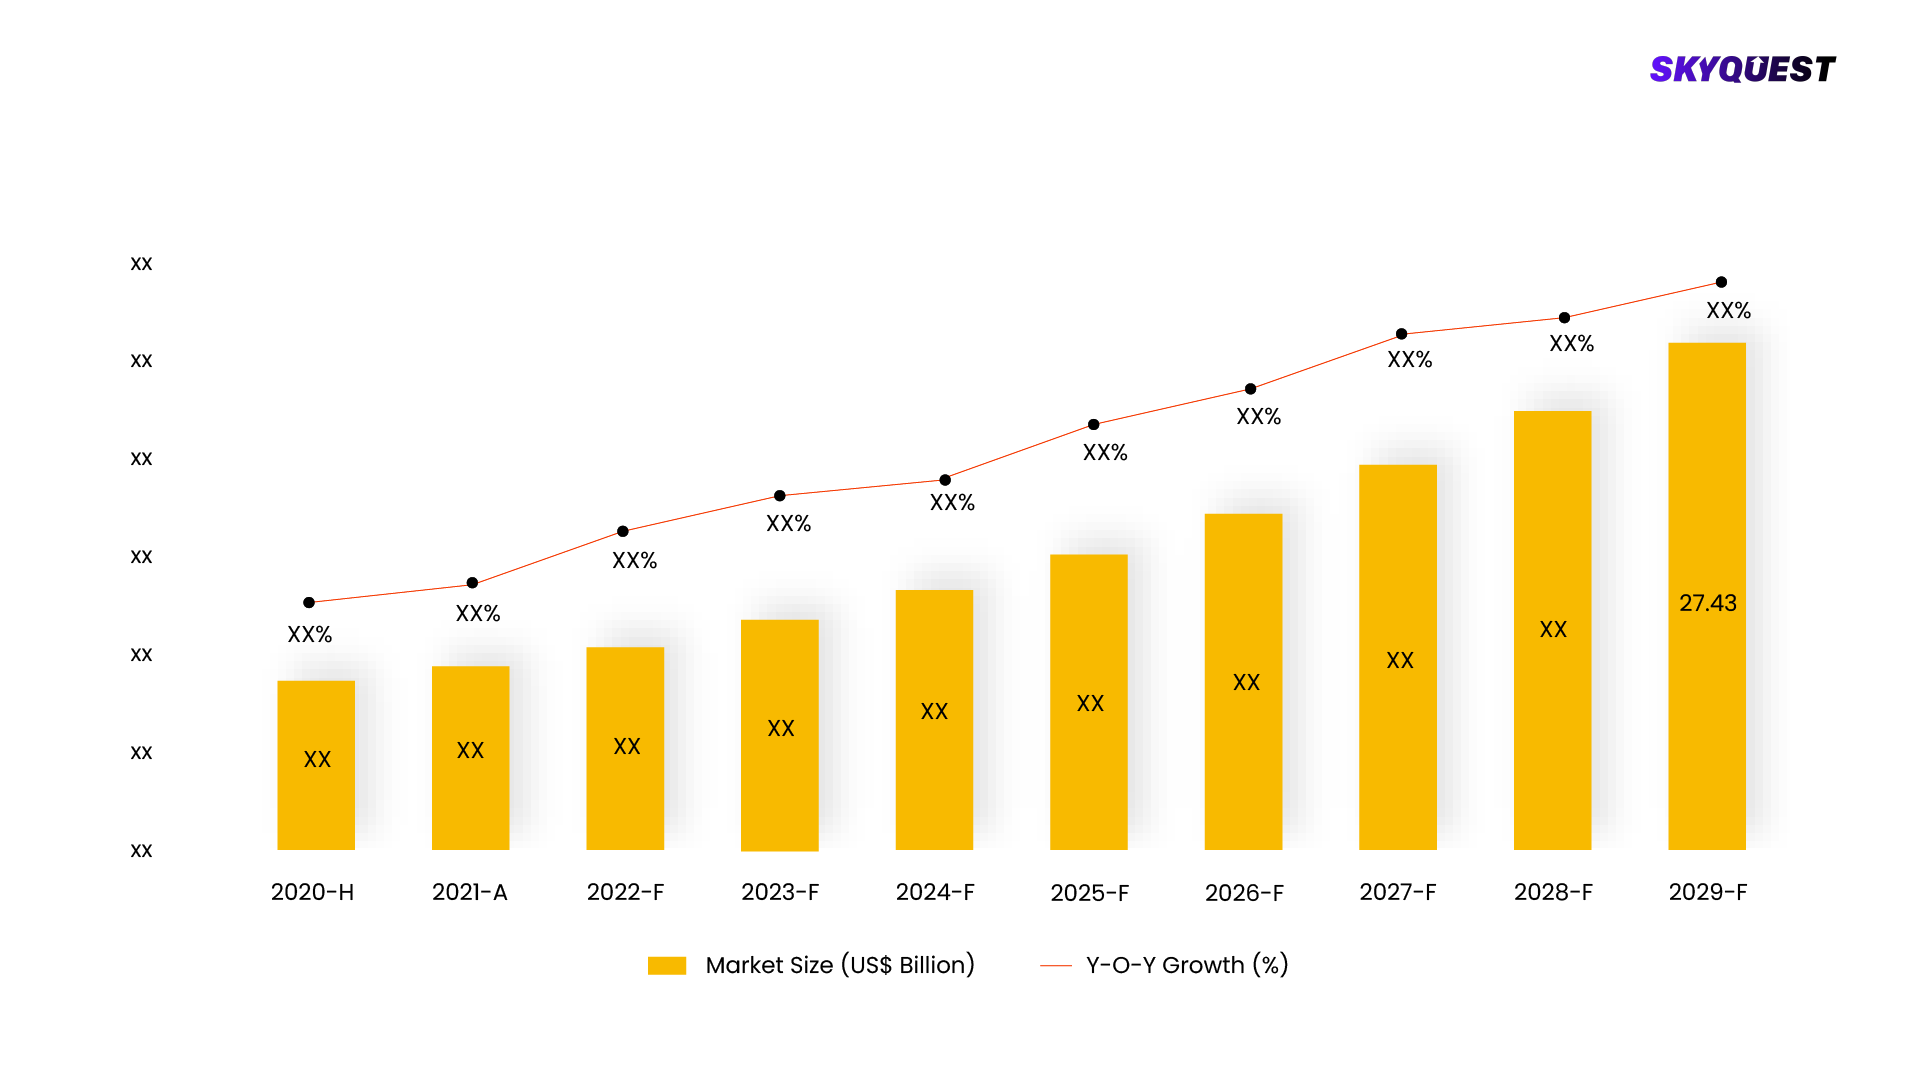
Shale Gas Market size was valued at USD 89.3 billion in 2023 and is poised to grow from USD 96.53 billion in 2024 to USD 180.0 billion by 2032, growing at a CAGR of 8.1% during the forecast period (2025-2032).

This growth is driven by the rise in energy demand and depleting supplies of conventional gas, shifting the focus to unconventional sources such as shale gas. The cost also comes down and enhances the rate of extraction by technological improvements, especially with horizontal drilling and hydraulic fracturing. Moreover, increasing environmental awareness promotes natural gas for electricity and heating purposes. It is expected to surge significantly in response to these developments in extraction techniques. Furthermore, technical improvements in extraction techniques like horizontal drilling and hydraulic fracturing lead to greater efficiency of production and lower prices.

In addition, as shale gas releases much less carbon dioxide compared to coal and oil, the shift towards greener fuel sources in the globe will make it a proper fit. Significant shale deposits can be used by nations to improve energy security and lessen their dependency on foreign fuels. The demand for natural gas in industrial and transportation applications is increasing, creating more opportunities for the global shale gas market growth. The global shale gas market is going to be at the forefront of the globe’s energy landscape as countries aim to balance environmental sustainability and economic prosperity.

Market snapshot - 2025-2032

Global Market Size

USD 89.3 billion

Largest Segment

Shale Gas

Fastest Growth

Shale Oil

Growth Rate

8.1% CAGR

Global Shale Gas Market ($ Bn)
Country Share for North America (%)

To get more reports on the above market click here to Buy The Report

Shale Gas Market Segments Analysis

Global Shale Gas Market is segmented by Technology, Application and region. Based on Technology, the market is segmented into Horizontal fracking, Vertical fracking and Rotary fracking. Based on Application, the market is segmented into Power Generation, Industrial, Residential, Commercial and Transportation. Based on region, the market is segmented into North America, Europe, Asia Pacific, Latin America and Middle East & Africa.

Analysis by Source

Based on the 2024 global shale gas market analysis, the shale gas segment dominated the market. This is attributed to its significant contribution to energy output globally. Especially in regions such as North America, where shale gas deposits as large as the Marcellus and Eagle Ford basins exist, shale gas, which is recovered from deep shale formations, has emerged as a prime source of natural gas. Shale gas has accelerated the change from coal to cleaner energy sources in power generation by offering even more ecologically favorable alternatives. In addition, the explosive growth of shale gas has led to significant infrastructural progress, and therefore, it is a critical source of energy for many industries such as chemicals and manufacturing.

However, the rising global demand for crude oil and growing production capabilities in regions such as North America would propel the shale oil segment to the leading position in the global shale gas industry. Shale oil, commonly referred to as tight oil, will be instrumental in satisfying the globe's increasing oil demand, particularly with the growing demand for petrochemical products and transportation fuels. It is an attractive resource since it can be produced in the same locations as shale gas, and advances in extraction techniques such as horizontal drilling and hydraulic fracturing make it even more important in the near future.

Analysis By Application

As per the 2024 global shale gas market forecast, the power generation category dominated the market with the highest revenue share of 27.4%. This is primarily because of the overall trend toward more sustainable power generation and the ever-growing demand for cleaner sources of energy worldwide. One of the most significant shifts from coal to natural gas in power plants has been observed as countries look to reduce their greenhouse gas emissions, and shale gas has played a key role in this, by being lower in carbon intensity. Other technological advancements, like horizontal drilling and hydraulic fracturing, have also brought shale gas closer and made it relatively cheaper. This has encouraged its use in energy production, which has further helped the market to grow continuously.

However, the industrial application segment is expected to grow at a compounded annual growth rate of 5.9% between 2024 and 2031. This is attributed to the flexibility of shale gas, concerning its feedstock being used in any of the different chemical processes. Business houses are, therefore, increasingly using shale gas in value-addition processes such as the production of plastics, chemicals, and fertilizers. This reduces prices and increases operational efficiency. Furthermore, the abundance of shale gas resources ensures that enterprises will have a stable supply of energy, which encourages innovation and growth. In addition, the new technology and infrastructure for shale gas usage development create new industrial applications, thus becoming a favorite among firms that strive to maximize efficiency in their production while lowering their impact on the environment.

Global Shale Gas Market By Source

To get detailed analysis on other segments, Request For Free Sample Report

Shale Gas Market Regional Insights

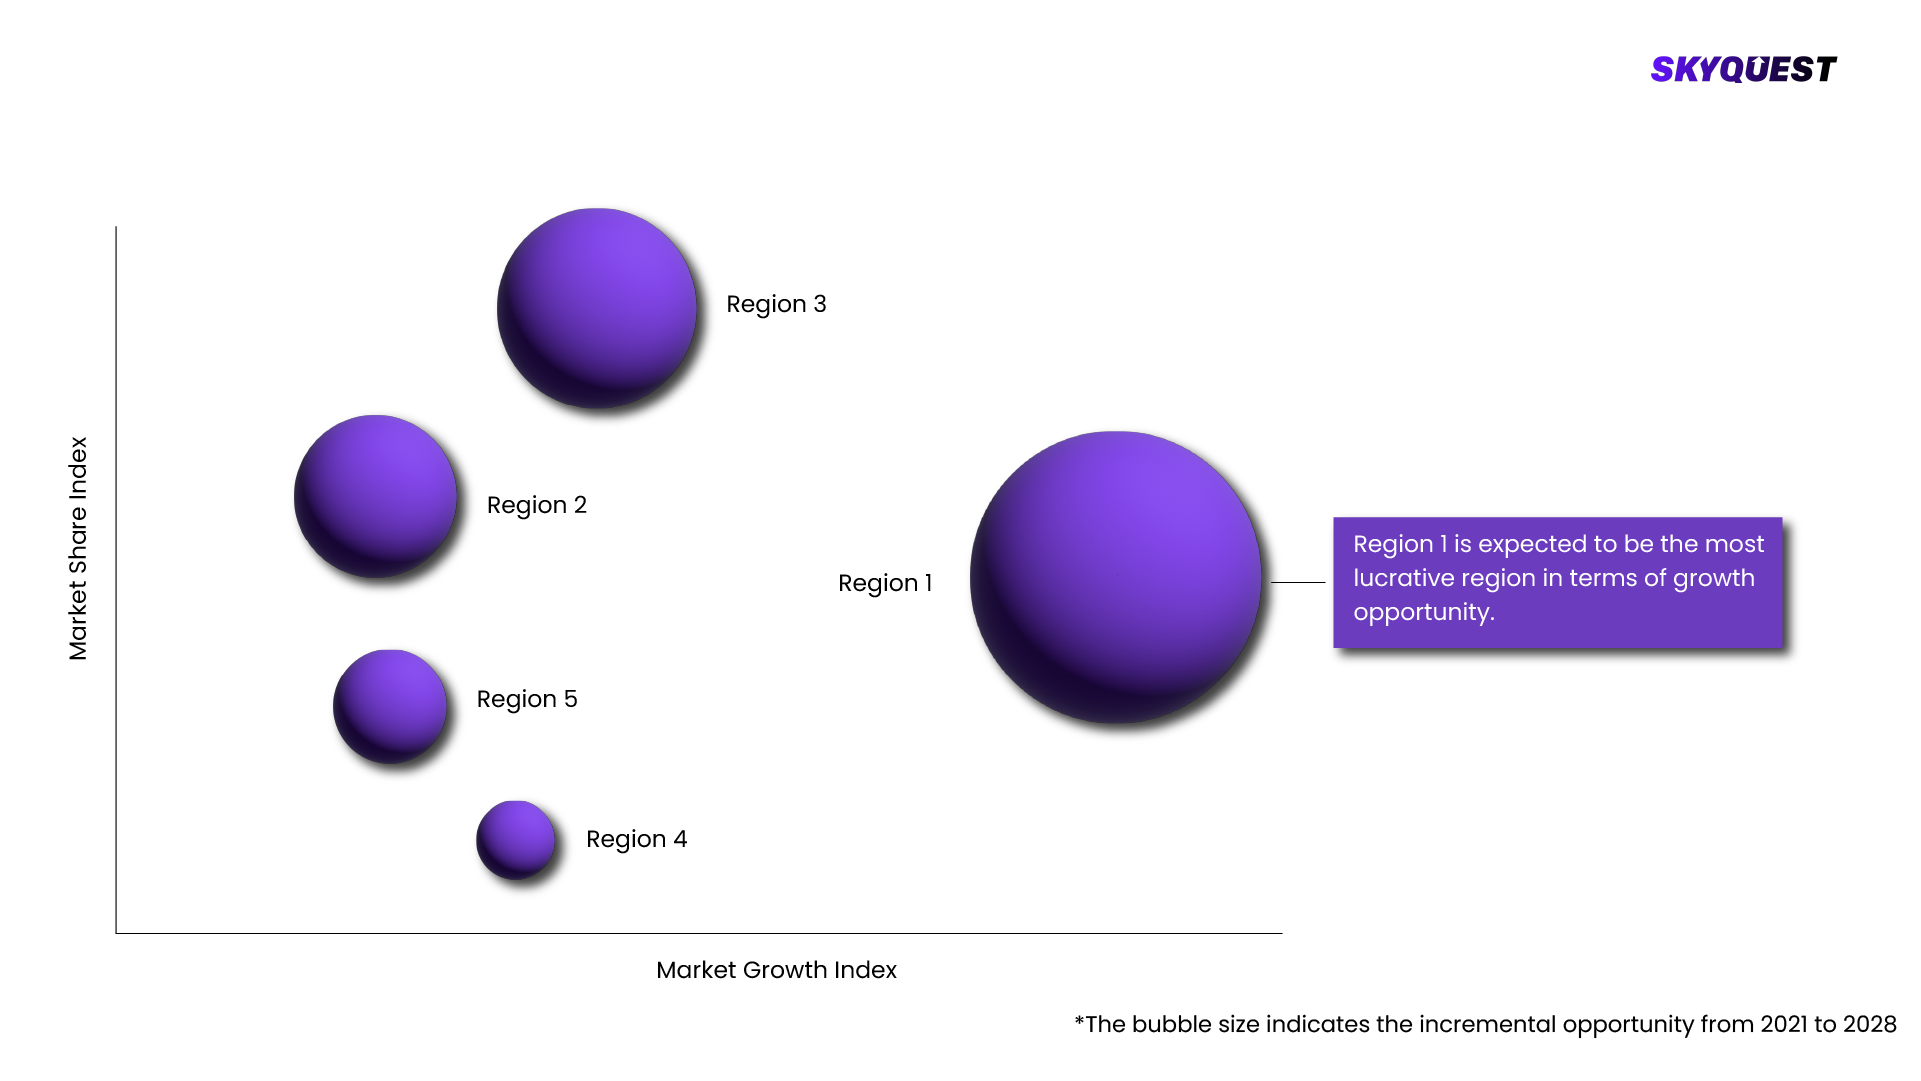
North America segment stood at the highest revenue share of 45.6% in 2024. This region has been endowed with such shale gas resources, specifically the Permian and Eagle Ford and the Marcellus basins, that it can dominate the global arena. Advanced extraction technologies such as horizontal drilling and hydraulic fracturing in North America have made production more cost efficient and affordable. On the other hand, natural gas has also experienced a steady growth trend because of an increasing tendency towards using cleaner energy sources attributable to policies on the environment and lower greenhouse gas emissions. North America's dominance in the shale gas market is reinforced by favorable regulatory conditions and ongoing exploration.

The Asia-Pacific shale gas market is expected to soar in the coming years, and the region is forecasted to lead the rest of the world. Developing countries such as China and India are looking at diversifying their energy sources and makes it the main driver of the rise in the energy needs of this region. Asia-Pacific countries are adopting shale gas development to achieve improved energy security and reduce dependency on imported natural gas. Growing industrialization in the region and the increasing expenditure incurred in exploration and production operations is expected to stimulate market growth. Development of shale gas resources is being encouraged by the governments of these countries with incentives and an effective regulatory framework, and this will sustain the market growth in the long run.

Global Shale Gas Market By Geography
  • Largest
  • Fastest

To know more about the market opportunities by region and country, click here to
Buy The Complete Report

Shale Gas Market Dynamics

Shale Gas Market Drivers

Growing Interest in Clean Energy

  • The global trend towards greener sources of energy highly impacts the global shale gas market. Natural gas, including shale gas, is considered a greener source of energy as its carbon footprint is relatively smaller than the demand of any country to reduce the emission of greenhouse gases and look for alternatives other than coal. Diversified investments have also been made in exploration and production of shale natural gas with the hope of addressing increased energy demand and moves in environmental sustainability considerations.

Technological Advancements in Extraction

  • Due to technological advancement, especially in horizontal drilling and hydraulic fracturing (fracking), shale gas production is now much more efficient and economical. These technologies have opened more sources of shale gas from previously unexploited reservoirs, making the business more profitable and lowering the cost of production. This is expanding the global shale gas industry, due to other areas using these technologies.

Shale Gas Market Restraints

Regulatory and Environmental Issues

  • Groundwater contamination, air pollution, and seismic activity are a few environmental issues caused by shale gas production, particularly hydraulic fracturing. Strict laws and local public resistance severely impede the expansion of the market. Stricter environmental regulations imposed by governments might increase operating costs and limit the development of shale gas extraction businesses.

Water Usage and Management Problems

  • Large volumes of water are required in the process of hydraulic fracturing commonly referred to as fracking, an important component in shale gas production. Water scarcity issues will arise in areas experiencing droughts or water shortages. Moreover, wrong management of the wastewater coming out during fracking may lead to contamination of waters. Strict laws and public outcry over these water issues could limit the growth of shale gas in some regions.

Request Free Customization of this report to help us to meet your business objectives.

Shale Gas Market Competitive Landscape

The global shale gas industry is highly filled with competition among BP, Royal Dutch Shell, Chevron, ExxonMobil, and ConocoPhillips. These companies lead operations due to major extraction operations and technology innovations combined with partnerships. With a boost in investments in infrastructure and exploration, it has continued competition with local players, especially in North America. They compete against each other to maintain the competitive edge of the companies by introducing innovations and abiding by regulations.

Top Players in Shale Gas Market

  • Nabors Industries (United States)
  • Cuadrilla Resources (United Kingdom) 
  • Helmerich & Payne (United States) 
  • CNX Resources (United States) 
  • Occidental Petroleum (United States) 
  • Range Resources (United States) 
  • Flywheel Energy (United States) 
  • Oilmax Energy (India) 
  • Covey Park Energy (United States) 
  • Essar Oil (India) 
  • Royal Dutch Shell plc (Netherlands) 
  • ExxonMobil Corporation (United States) 
  • Chevron Corporation (United States) 
  • ConocoPhillips (United States) 
  • SINOPEC Corp. (China) 
  • China National Petroleum Corp (CNPC) (China) 
  • Arrow Energy Limited (Australia) 
  • Total SA (France)

Recent Developments

  • Exxon Mobil Corp, in November 2024, announced that it would sell its conventional oil drilling operations in the Permian Basin. The cost of sales would be approx. USD 1 billion to Hilcorp Energy. As per the company's policy of selling older sites while investing in newer, high-growth shale production, these assets are put up for sale. The assets are predominantly vertical wells and not horizontal shale wells and are expected to produce approximately 26,000 barrels of oil equivalent per day. The deal is predicted to close in the first half of 2025, and this sale fits the industry trend of divesting from the established oil fields.
  • The UK government unveiled a new series of measures, in December 2023, to fulfil its election manifesto commitment on shale gas production support. These include Shale Environmental Regulator and a newly Planning Brokerage Service entirely devoted to the planning process.
  • Falcon Oil & Gas and its joint venture partner Tamboran Resources, in August 2023, discovered a considerable prospective dry gas presence while drilling the Shenandoah South 1H (SS1H) shale gas exploration well in Australia's Beetaloo sub-basin, discovered a considerable prospective dry gas presence while drilling the Shenandoah South 1H (SS1H) shale gas exploration well in Australia's Beetaloo sub-basin.

Shale Gas Key Market Trends

Shale Gas Market SkyQuest Analysis

SkyQuest's ABIRAW (Advanced Business Intelligence, Research & Analysis Wing) is our Business Information Services team that Collects, Collates, Correlates, and Analyses the Data collected using Primary Exploratory Research backed by robust Secondary Desk research.

As per SkyQuest analysis, the increasing demand for cleaner energy and better extraction techniques, including horizontal drilling and hydraulic fracturing, are predicted to propel the fast growth of the global shale gas market. Investments in shale gas exploration, with increased energy demand in this region, will further serve as a growth driver for Asia-Pacific, and North America currently dominates the market owing to its vast reserves and complex infrastructure. However, the market has challenges that include high manufacturing costs, regulatory barriers, and environmental concerns. Despite these disadvantages, shale gas will be critical in meeting the global energy requirements in the coming years because of the improvements in extraction technologies and the shift towards cleaner sources.

Report Metric Details
Market size value in 2023 USD 89.3 billion
Market size value in 2032 USD 180.0 billion
Growth Rate 8.1%
Base year 2024
Forecast period 2025-2032
Forecast Unit (Value) USD Billion
Segments covered
  • Technology
    • Horizontal fracking
    • Vertical fracking
    • Rotary fracking
  • Application
    • Power Generation
    • Industrial
    • Residential
    • Commercial
    • Transportation
Regions covered North America (US, Canada), Europe (Germany, France, United Kingdom, Italy, Spain, Rest of Europe), Asia Pacific (China, India, Japan, Rest of Asia-Pacific), Latin America (Brazil, Rest of Latin America), Middle East & Africa (South Africa, GCC Countries, Rest of MEA)
Companies covered
  • Nabors Industries (United States)
  • Cuadrilla Resources (United Kingdom) 
  • Helmerich & Payne (United States) 
  • CNX Resources (United States) 
  • Occidental Petroleum (United States) 
  • Range Resources (United States) 
  • Flywheel Energy (United States) 
  • Oilmax Energy (India) 
  • Covey Park Energy (United States) 
  • Essar Oil (India) 
  • Royal Dutch Shell plc (Netherlands) 
  • ExxonMobil Corporation (United States) 
  • Chevron Corporation (United States) 
  • ConocoPhillips (United States) 
  • SINOPEC Corp. (China) 
  • China National Petroleum Corp (CNPC) (China) 
  • Arrow Energy Limited (Australia) 
  • Total SA (France)
Customization scope

Free report customization with purchase. Customization includes:-

  • Segments by type, application, etc
  • Company profile
  • Market dynamics & outlook
  • Region

To get a free trial access to our platform which is a one stop solution for all your data requirements for quicker decision making. This platform allows you to compare markets, competitors who are prominent in the market, and mega trends that are influencing the dynamics in the market. Also, get access to detailed SkyQuest exclusive matrix.

Buy The Complete Report to read the analyzed strategies adopted by the top vendors either to retain or gain market share

Table Of Content

Executive Summary

Market overview

  • Exhibit: Executive Summary – Chart on Market Overview
  • Exhibit: Executive Summary – Data Table on Market Overview
  • Exhibit: Executive Summary – Chart on Shale Gas Market Characteristics
  • Exhibit: Executive Summary – Chart on Market by Geography
  • Exhibit: Executive Summary – Chart on Market Segmentation
  • Exhibit: Executive Summary – Chart on Incremental Growth
  • Exhibit: Executive Summary – Data Table on Incremental Growth
  • Exhibit: Executive Summary – Chart on Vendor Market Positioning

Parent Market Analysis

Market overview

Market size

  • Market Dynamics
    • Exhibit: Impact analysis of DROC, 2021
      • Drivers
      • Opportunities
      • Restraints
      • Challenges
  • SWOT Analysis

KEY MARKET INSIGHTS

  • Technology Analysis
    • (Exhibit: Data Table: Name of technology and details)
  • Pricing Analysis
    • (Exhibit: Data Table: Name of technology and pricing details)
  • Supply Chain Analysis
    • (Exhibit: Detailed Supply Chain Presentation)
  • Value Chain Analysis
    • (Exhibit: Detailed Value Chain Presentation)
  • Ecosystem Of the Market
    • Exhibit: Parent Market Ecosystem Market Analysis
    • Exhibit: Market Characteristics of Parent Market
  • IP Analysis
    • (Exhibit: Data Table: Name of product/technology, patents filed, inventor/company name, acquiring firm)
  • Trade Analysis
    • (Exhibit: Data Table: Import and Export data details)
  • Startup Analysis
    • (Exhibit: Data Table: Emerging startups details)
  • Raw Material Analysis
    • (Exhibit: Data Table: Mapping of key raw materials)
  • Innovation Matrix
    • (Exhibit: Positioning Matrix: Mapping of new and existing technologies)
  • Pipeline product Analysis
    • (Exhibit: Data Table: Name of companies and pipeline products, regional mapping)
  • Macroeconomic Indicators

COVID IMPACT

  • Introduction
  • Impact On Economy—scenario Assessment
    • Exhibit: Data on GDP - Year-over-year growth 2016-2022 (%)
  • Revised Market Size
    • Exhibit: Data Table on Shale Gas Market size and forecast 2021-2027 ($ million)
  • Impact Of COVID On Key Segments
    • Exhibit: Data Table on Segment Market size and forecast 2021-2027 ($ million)
  • COVID Strategies By Company
    • Exhibit: Analysis on key strategies adopted by companies

MARKET DYNAMICS & OUTLOOK

  • Market Dynamics
    • Exhibit: Impact analysis of DROC, 2021
      • Drivers
      • Opportunities
      • Restraints
      • Challenges
  • Regulatory Landscape
    • Exhibit: Data Table on regulation from different region
  • SWOT Analysis
  • Porters Analysis
    • Competitive rivalry
      • Exhibit: Competitive rivalry Impact of key factors, 2021
    • Threat of substitute products
      • Exhibit: Threat of Substitute Products Impact of key factors, 2021
    • Bargaining power of buyers
      • Exhibit: buyers bargaining power Impact of key factors, 2021
    • Threat of new entrants
      • Exhibit: Threat of new entrants Impact of key factors, 2021
    • Bargaining power of suppliers
      • Exhibit: Threat of suppliers bargaining power Impact of key factors, 2021
  • Skyquest special insights on future disruptions
    • Political Impact
    • Economic impact
    • Social Impact
    • Technical Impact
    • Environmental Impact
    • Legal Impact

Market Size by Region

  • Chart on Market share by geography 2021-2027 (%)
  • Data Table on Market share by geography 2021-2027(%)
  • North America
    • Chart on Market share by country 2021-2027 (%)
    • Data Table on Market share by country 2021-2027(%)
    • USA
      • Exhibit: Chart on Market share 2021-2027 (%)
      • Exhibit: Market size and forecast 2021-2027 ($ million)
    • Canada
      • Exhibit: Chart on Market share 2021-2027 (%)
      • Exhibit: Market size and forecast 2021-2027 ($ million)
  • Europe
    • Chart on Market share by country 2021-2027 (%)
    • Data Table on Market share by country 2021-2027(%)
    • Germany
      • Exhibit: Chart on Market share 2021-2027 (%)
      • Exhibit: Market size and forecast 2021-2027 ($ million)
    • Spain
      • Exhibit: Chart on Market share 2021-2027 (%)
      • Exhibit: Market size and forecast 2021-2027 ($ million)
    • France
      • Exhibit: Chart on Market share 2021-2027 (%)
      • Exhibit: Market size and forecast 2021-2027 ($ million)
    • UK
      • Exhibit: Chart on Market share 2021-2027 (%)
      • Exhibit: Market size and forecast 2021-2027 ($ million)
    • Rest of Europe
      • Exhibit: Chart on Market share 2021-2027 (%)
      • Exhibit: Market size and forecast 2021-2027 ($ million)
  • Asia Pacific
    • Chart on Market share by country 2021-2027 (%)
    • Data Table on Market share by country 2021-2027(%)
    • China
      • Exhibit: Chart on Market share 2021-2027 (%)
      • Exhibit: Market size and forecast 2021-2027 ($ million)
    • India
      • Exhibit: Chart on Market share 2021-2027 (%)
      • Exhibit: Market size and forecast 2021-2027 ($ million)
    • Japan
      • Exhibit: Chart on Market share 2021-2027 (%)
      • Exhibit: Market size and forecast 2021-2027 ($ million)
    • South Korea
      • Exhibit: Chart on Market share 2021-2027 (%)
      • Exhibit: Market size and forecast 2021-2027 ($ million)
    • Rest of Asia Pacific
      • Exhibit: Chart on Market share 2021-2027 (%)
      • Exhibit: Market size and forecast 2021-2027 ($ million)
  • Latin America
    • Chart on Market share by country 2021-2027 (%)
    • Data Table on Market share by country 2021-2027(%)
    • Brazil
      • Exhibit: Chart on Market share 2021-2027 (%)
      • Exhibit: Market size and forecast 2021-2027 ($ million)
    • Rest of South America
      • Exhibit: Chart on Market share 2021-2027 (%)
      • Exhibit: Market size and forecast 2021-2027 ($ million)
  • Middle East & Africa (MEA)
    • Chart on Market share by country 2021-2027 (%)
    • Data Table on Market share by country 2021-2027(%)
    • GCC Countries
      • Exhibit: Chart on Market share 2021-2027 (%)
      • Exhibit: Market size and forecast 2021-2027 ($ million)
    • South Africa
      • Exhibit: Chart on Market share 2021-2027 (%)
      • Exhibit: Market size and forecast 2021-2027 ($ million)
    • Rest of MEA
      • Exhibit: Chart on Market share 2021-2027 (%)
      • Exhibit: Market size and forecast 2021-2027 ($ million)

KEY COMPANY PROFILES

  • Competitive Landscape
    • Total number of companies covered
      • Exhibit: companies covered in the report, 2021
    • Top companies market positioning
      • Exhibit: company positioning matrix, 2021
    • Top companies market Share
      • Exhibit: Pie chart analysis on company market share, 2021(%)

Methodology

For the Shale Gas Market, our research methodology involved a mixture of primary and secondary data sources. Key steps involved in the research process are listed below:

1. Information Procurement: This stage involved the procurement of Market data or related information via primary and secondary sources. The various secondary sources used included various company websites, annual reports, trade databases, and paid databases such as Hoover's, Bloomberg Business, Factiva, and Avention. Our team did 45 primary interactions Globally which included several stakeholders such as manufacturers, customers, key opinion leaders, etc. Overall, information procurement was one of the most extensive stages in our research process.

2. Information Analysis: This step involved triangulation of data through bottom-up and top-down approaches to estimate and validate the total size and future estimate of the Shale Gas Market.

3. Report Formulation: The final step entailed the placement of data points in appropriate Market spaces in an attempt to deduce viable conclusions.

4. Validation & Publishing: Validation is the most important step in the process. Validation & re-validation via an intricately designed process helped us finalize data points to be used for final calculations. The final Market estimates and forecasts were then aligned and sent to our panel of industry experts for validation of data. Once the validation was done the report was sent to our Quality Assurance team to ensure adherence to style guides, consistency & design.

Analyst Support

Customization Options

With the given market data, our dedicated team of analysts can offer you the following customization options are available for the Shale Gas Market:

Product Analysis: Product matrix, which offers a detailed comparison of the product portfolio of companies.

Regional Analysis: Further analysis of the Shale Gas Market for additional countries.

Competitive Analysis: Detailed analysis and profiling of additional Market players & comparative analysis of competitive products.

Go to Market Strategy: Find the high-growth channels to invest your marketing efforts and increase your customer base.

Innovation Mapping: Identify racial solutions and innovation, connected to deep ecosystems of innovators, start-ups, academics, and strategic partners.

Category Intelligence: Customized intelligence that is relevant to their supply Markets will enable them to make smarter sourcing decisions and improve their category management.

Public Company Transcript Analysis: To improve the investment performance by generating new alpha and making better-informed decisions.

Social Media Listening: To analyze the conversations and trends happening not just around your brand, but around your industry as a whole, and use those insights to make better Marketing decisions.

$5,300

REQUEST FOR SAMPLE

Please verify that you're not a robot to proceed!
Want to customize this report? REQUEST FREE CUSTOMIZATION

FAQs

Global Shale Gas Market size was valued at USD 94.61 Billion in 2023 and is poised to grow from USD 102.65 Billion in 2024 to USD 197.16 Billion by 2032, growing at a CAGR of 8.5% in the forecast period (2025-2032).

The global shale gas industry is highly filled with competition among BP, Royal Dutch Shell, Chevron, ExxonMobil, and ConocoPhillips. These companies lead operations due to major extraction operations and technology innovations combined with partnerships. With a boost in investments in infrastructure and exploration, it has continued competition with local players, especially in North America. They compete against each other to maintain the competitive edge of the companies by introducing innovations and abiding by regulations. 'ExxonMobil', 'Chevron Corporation', 'ConocoPhillips', 'Royal Dutch Shell', 'BP', 'EOG Resources', 'Devon Energy', 'Continental Resources', 'Anadarko Petroleum', 'Marathon Oil', 'Occidental Petroleum', 'Pioneer Natural Resources', 'Chesapeake Energy', 'Cabot Oil & Gas', 'Apache Corporation'

The global trend towards greener sources of energy highly impacts the global shale gas market. Natural gas, including shale gas, is considered a greener source of energy as its carbon footprint is relatively smaller than the demand of any country to reduce the emission of greenhouse gases and look for alternatives other than coal. Diversified investments have also been made in exploration and production of shale natural gas with the hope of addressing increased energy demand and moves in environmental sustainability considerations.

Increasing Use of Shale Gas in Power Generation: There is a huge trend in the shale gas market to increase its use in electricity production. The trend is driven by abundant reserves, competitive prices, and fewer carbon emissions than coal. As hydraulic fracturing technology improves availability, shale gas becomes an increasingly preferred source of energy. Though this trend addresses growing power consumption and promotes cleaner energy transitions, environmental issues remain a key area of concern for sustainable growth.

North America segment stood at the highest revenue share of 45.6% in 2024. This region has been endowed with such shale gas resources, specifically the Permian and Eagle Ford and the Marcellus basins, that it can dominate the global arena. Advanced extraction technologies such as horizontal drilling and hydraulic fracturing in North America have made production more cost efficient and affordable. On the other hand, natural gas has also experienced a steady growth trend because of an increasing tendency towards using cleaner energy sources attributable to policies on the environment and lower greenhouse gas emissions. North America's dominance in the shale gas market is reinforced by favorable regulatory conditions and ongoing exploration.

Want to customize this report? This report can be personalized according to your needs. Our analysts and industry experts will work directly with you to understand your requirements and provide you with customized data in a short amount of time. We offer $1000 worth of FREE customization at the time of purchase.

AGC3x.webp
Aisin3x.webp
ASKA P Co. LTD3x.webp
BD3x.webp
BILL & MELIDA3x.webp
BOSCH3x.webp
CHUNGHWA TELECOM3x.webp
DAIKIN3x.webp
DEPARTMENT OF SCIENCE & TECHNOLOGY3x.webp
ETRI3x.webp
Fiti Testing3x.webp
GERRESHEIMER3x.webp
HENKEL3x.webp
HITACHI3x.webp
HOLISTIC MEDICAL CENTRE3x.webp
Institute for information industry3x.webp
JAXA3x.webp
JTI3x.webp
Khidi3x.webp
METHOD.3x.webp
Missul E&S3x.webp
MITSUBISHI3x.webp
MIZUHO3x.webp
NEC3x.webp
Nippon steel3x.webp
NOVARTIS3x.webp
Nttdata3x.webp
OSSTEM3x.webp
PALL3x.webp
Panasonic3x.webp
RECKITT3x.webp
Rohm3x.webp
RR KABEL3x.webp
SAMSUNG ELECTRONICS3x.webp
SEKISUI3x.webp
Sensata3x.webp
SENSEAIR3x.webp
Soft Bank Group3x.webp
SYSMEX3x.webp
TERUMO3x.webp
TOYOTA3x.webp
UNDP3x.webp
Unilever3x.webp
YAMAHA3x.webp
Yokogawa3x.webp

Feedback From Our Clients

Global Shale Gas Market
Shale Gas Market

Report ID: SQMIG10D2049

[email protected]
USA +1 351-333-4748

BUY NOW GET FREE SAMPLE