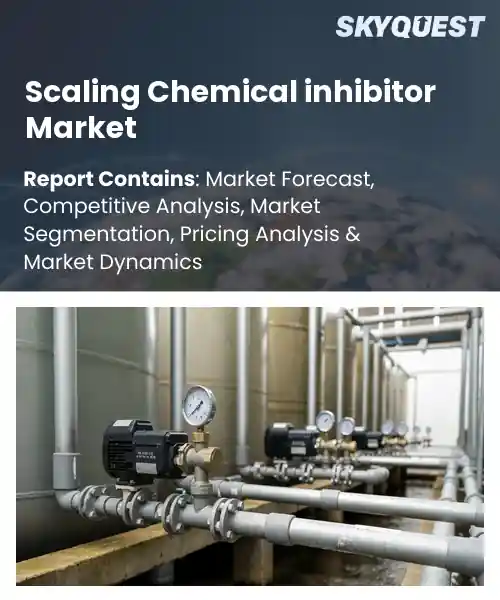
Scaling Chemical inhibitor Market
Report ID: SQMIG15B2188
Report ID: SQMIG15B2188
[email protected]
USA +1 351-333-4748
Report ID:
SQMIG15B2188 |
Region:
Global |
Published Date: March, 2026
Pages:
157
|Tables:
92
|Figures:
76


Global Scaling Chemical Inhibitor Market size was valued at USD 4.5 Billion in 2024 and is poised to grow from USD 4.75 Billion in 2025 to USD 7.29 Billion by 2033, growing at a CAGR of 5.5% during the forecast period (2026-2033).
As a research analyst, I identify regulatory-driven corrosion control and water treatment needs as the primary driver shaping demand. This market encompasses polymers, phosphonates and threshold inhibitors that prevent scale in industrial boilers, desalination plants and oil and gas pipelines, and it matters because scale reduces heat transfer efficiency, raises maintenance expense and prompts unplanned downtime that can cripple production. Over the past two decades adoption shifted from local chemical suppliers toward integrated offerings by multinational specialty firms, exemplified by broader use of phosphonate blends and polymer dispersants in seawater reverse osmosis systems across the Middle East and Latin America.Because aging infrastructure and tighter environmental regulations increase the operational risks and compliance costs of scale-related failures, demand for advanced chemical inhibitors has grown, creating opportunities for formulators who can demonstrate efficacy and lower ecological impact. For example, seawater reverse osmosis operators reduced downtime and chemical consumption after switching to tailored phosphonate-polymer formulations coupled with automated dosing, which in turn accelerated procurement of bundled treatment services from large suppliers. As industrial water scarcity intensifies and energy efficiency targets rise, companies that invest in bio-based inhibitors, digital monitoring and regional supply chains will capture share, driving consolidation and higher-margin service contracts.
How is AI enhancing formulation and deployment in the scaling chemical inhibitor market?
AI is transforming formulation and deployment in the scale inhibitor market by linking molecular design, process simulation, and field operations into a continuous feedback loop. Key aspects include predictive analytics for diverse water chemistries, generative chemistry tools that propose candidate inhibitors, and virtual testing that reduces lab iterations. The current state combines lab automation, digital twins, and sensor driven dosing to speed scale up and reduce unplanned shutdowns. Market pressure from environmental rules and the need for reliable uptime makes tailored, lower impact formulations more valuable, and enterprise AI helps capture legacy data to shorten development timelines and improve deployment consistency.Worley March 2026, Worley announced embedding an AI enterprise intelligence platform that organizes engineering knowledge and speeds decisions. By linking historical field data, chemistry models, and predictive maintenance insights the platform helps teams choose better inhibitor chemistries and tune dosing strategies before field trials. This drives faster commercialization and steadier plant performance.
Market snapshot - (2026-2033)
Global Market Size
USD 4.5 Billion
Largest Segment
Phosphonates & Polyphosphates
Fastest Growth
Green/Biodegradable Inhibitors
Growth Rate
5.5% CAGR
To get more insights on this market click here to Request a Free Sample Report
Global scaling chemical inhibitor market is segmented by chemical chemistry, application environment, end-use industry and region. Based on chemical chemistry, the market is segmented into Phosphonates & Polyphosphates, Polyacrylates & Polymers, Chelating Agents and Green/Biodegradable Inhibitors. Based on application environment, the market is segmented into High-Pressure / High-Temperature (HPHT) and High Salinity/Brine Water. Based on end-use industry, the market is segmented into Oil & Gas, Power Plant Cooling Towers, Desalination Plants, Mining & Mineral Processing and Pulp & Paper Mills. Based on region, the market is segmented into North America, Europe, Asia Pacific, Latin America and Middle East & Africa.
Phosphonates & Polyphosphates segment dominates because their strong threshold inhibition and calcium ion control make them the go-to chemistry for preventing scale formation across diverse water chemistries. Their molecular stability and compatibility with common co-treatments produce predictable performance, simplifying formulation and dosing. Market familiarity among formulators and operators drives widespread adoption, which reduces technical uncertainty and encourages procurement of established phosphonate-based blends in industrial and process cooling applications.
However, Green/Biodegradable Inhibitors are expanding fastest as environmental regulations and customer demand push operators toward lower-toxicity chemistries. Innovation in biodegradable polymers and nonpersistent chelants expands applicability where discharge or make-up water reuse is critical, creating new procurement channels and driving reformulation activity that accelerates adoption of ecofriendly inhibitor packages across treatment-intensive industries.
High Salinity/Brine Water segment dominates because extreme ionic strength and competing cations destabilize conventional inhibitor adsorption and reduce threshold performance, creating persistent scale risks. These harsh chemistries force formulators to prioritize ionic robustness, anti-salt precipitation mechanisms and chloride-tolerant dispersants. Consequently, product development and procurement tilt toward chemistries proven to retain activity in concentrated brines, making this application environment the primary driver of technical innovation and demand.
However, High-Pressure / High-Temperature (HPHT) is the fastest-growing area as operations demand thermally stable, pressure-tolerant inhibitors that maintain efficacy under elevated temperatures. Advances in high-temperature polymers, thermal stabilizers and field validation accelerate adoption in aggressive systems, prompting suppliers to invest in specialized formulations and testing capabilities that unlock new application opportunities.
To get detailed segments analysis, Request a Free Sample Report
Asia Pacific dominates the global Scaling Chemical inhibitor market due to a convergence of robust industrial activity, concentrated manufacturing hubs, and intensive water treatment needs across multiple sectors. Major economies in the region prioritize plant reliability and asset protection, driving adoption of advanced inhibitor chemistries and tailored service models. A dense network of local producers and technical service providers enables rapid product customization and on site support, while collaborative research between industry and academic institutions accelerates innovation. Strong supply chain integration reduces lead times and improves cost efficiency, and progressive regulatory emphasis on water reuse and scale control creates sustained demand for chemical inhibitor solutions and associated maintenance services throughout the region. Extensive aftermarket networks and partnerships with original equipment manufacturers enhance product integration, while workforce training programs build local expertise and confidence among end users.
Scaling Chemical inhibitor Market Japan plays a pivotal role through advanced formulation expertise and close collaboration with domestic equipment manufacturers. Demand is shaped by high expectations for plant reliability in electronics and power sectors, prompting tailored inhibitor chemistries and rigorous technical validation. A dense service ecosystem supports rapid deployment and aftercare, while strong research institutions and specialized suppliers enable continuous improvement and product development aligning with stringent water management practices.
Scaling Chemical inhibitor Market South Korea benefits from strong industrial demand across shipbuilding, petrochemical, and manufacturing sectors prioritizing operational continuity. Local chemical manufacturers combine application engineering with on site technical support to deliver tailored inhibitor regimes. Collaborative ties between industry and technical service providers enable quick troubleshooting and formulation adjustments. Emphasis on export manufacturing and efficiency improvements drives adoption of scale control solutions, encouraging investment in product performance and service.
Rapid expansion of the Scaling Chemical inhibitor market in North America is driven by an intersection of aging water handling infrastructure, proactive maintenance strategies, and strong adoption of advanced chemical solutions across industrial and municipal users. End users increasingly seek preventative scale control to protect equipment reliability and reduce downtime, prompting investments in tailored inhibitor programs and comprehensive service contracts. A mature supply chain of specialized chemical producers and technical service firms facilitates fast deployment and localized support, while strong collaboration with equipment manufacturers enables integrated solutions. Environmental stewardship and regulatory emphasis on water efficiency further encourage adoption of inhibitors that enable reuse and treatment optimization, and sophisticated procurement models promote long term supplier partnerships and innovation in application techniques.
Scaling Chemical inhibitor Market United States reflects broad industrial adoption across power generation, oil and gas, manufacturing, and municipal water treatment sectors where emphasis on uptime drives reliance on advanced inhibitor chemistries. Large service providers and specialized formulators deliver integrated programs combining application expertise with monitoring and troubleshooting. Collaboration with equipment manufacturers and institutions supports product validation, while procurement tends to favor long term supply agreements and local technical support.
Scaling Chemical inhibitor Market Canada is shaped by municipal water treatment and industrial demand across processing and manufacturing, where operators prioritize corrosion and scale mitigation in diverse climatic conditions. Domestic and regional chemical suppliers provide tailored formulations and service, while engagement with utilities supports performance validation. A culture of environmental stewardship and resilience encourages continued adoption of inhibitors that support water reuse, reliability, and integration with treatment and maintenance programs.
Europe is strengthening its position in the Scaling Chemical inhibitor market through a combination of regulatory emphasis on water efficiency, strong technical standards, and a vibrant innovation ecosystem that favors specialty chemistries. Regional stakeholders increasingly favor solutions that enable reuse and minimize environmental impact, prompting suppliers to develop low footprint formulations and robust service models. Established industrial sectors and utilities work closely with technical service providers to validate performance and integrate inhibitors into comprehensive treatment programs. Cross border collaboration and knowledge sharing among research institutions and manufacturers accelerates application innovation, while aftermarket capabilities and channel partnerships support widespread deployment across diverse end use sectors. Pilot projects and digital monitoring solutions enhance proof of performance, and lifecycle service contracts promote long term supplier alignment. Emphasis on circular economy principles further shapes product design and application approaches.
Scaling Chemical inhibitor Market Germany is driven by manufacturing and energy industries that prioritize process reliability and regulatory compliance. Chemical producers and engineering firms collaborate to deliver tailored inhibitor solutions integrated with plant maintenance programs. Rigorous technical validation and field testing ensure performance in demanding applications, while focus on energy efficiency and circular economy principles encourages selection of inhibitors that support water reuse and lower environmental footprint in industrial operations.
Scaling Chemical inhibitor Market United Kingdom is shaped by municipal and industrial water treatment activity emphasizing operational reliability and regulatory compliance. Service providers deliver programs that combine formulation expertise with digital monitoring and responsive field support. Collaboration between research centers and manufacturers fosters validation and performance optimization, while procurement practices and sustainability commitments encourage inhibitors that enable reuse and reduced environmental impact across utilities and industrial users and service models.
Scaling Chemical inhibitor Market France draws demand from chemical, energy, and municipal water treatment sectors where environmental performance and operational safety are prioritized. Local formulators and technical service providers offer tailored inhibitor programs with rigorous validation to meet exacting standards. Partnerships with research organizations support development of specialized chemistries, while national regulatory emphasis on water reuse encourage broader integration of inhibitors into treatment and maintenance strategies.
To know more about the market opportunities by region and country, click here to
Buy The Complete Report
Expansion In Industrial Applications
Advances In Inhibitor Formulations
Regulatory Compliance And Approval
High Production Costs And Complexity
Request Free Customization of this report to help us to meet your business objectives.
Global scale inhibitor competitive landscape is dominated by legacy specialty-chemical incumbents while agile water-tech entrants push green chemistries and digital dosing. Competition is driven by tighter discharge regulations and customer demand for lower-residual antiscalants. Firms pursue M&A to add niche chemistries, cite Baker Hughes' 2025 acquisition of Edge Molecular Analysis, product partnerships and AI dosing rollouts from Ecolab and Solenis.
Top Player’s Company Profile
Recent Developments
SkyQuest’s ABIRAW (Advanced Business Intelligence, Research & Analysis Wing) is our Business Information Services team that Collects, Collates, Correlates, and Analyses the Data collected by means of Primary Exploratory Research backed by robust Secondary Desk research. As per SkyQuest analysis, the global scaling chemical inhibitor market is driven by regulatory-driven corrosion control and water treatment needs that push operators to adopt effective antiscalants, while a second driver is advances in inhibitor formulations and digital monitoring that improve performance and lower environmental impact. One restraint is stringent regulatory compliance and approval processes that slow product introductions and raise costs. Asia Pacific is the dominating region due to concentrated industrial activity and strong demand for tailored services, and Phosphonates & Polyphosphates are the dominating segment because of proven threshold inhibition and compatibility with existing systems. Opportunities center on bio-based chemistries and integrated service models.
| Report Metric | Details |
|---|---|
| Market size value in 2024 | USD 4.5 Billion |
| Market size value in 2033 | USD 7.29 Billion |
| Growth Rate | 5.5% |
| Base year | 2024 |
| Forecast period | (2026-2033) |
| Forecast Unit (Value) | USD Billion |
| Segments covered |
|
| Regions covered | North America (US, Canada), Europe (Germany, France, United Kingdom, Italy, Spain, Rest of Europe), Asia Pacific (China, India, Japan, Rest of Asia-Pacific), Latin America (Brazil, Rest of Latin America), Middle East & Africa (South Africa, GCC Countries, Rest of MEA) |
| Companies covered |
|
| Customization scope | Free report customization with purchase. Customization includes:-
|
To get a free trial access to our platform which is a one stop solution for all your data requirements for quicker decision making. This platform allows you to compare markets, competitors who are prominent in the market, and mega trends that are influencing the dynamics in the market. Also, get access to detailed SkyQuest exclusive matrix.
Table Of Content
Executive Summary
Market overview
Parent Market Analysis
Market overview
Market size
KEY MARKET INSIGHTS
COVID IMPACT
MARKET DYNAMICS & OUTLOOK
Market Size by Region
KEY COMPANY PROFILES
Methodology
For the Scaling Chemical inhibitor Market, our research methodology involved a mixture of primary and secondary data sources. Key steps involved in the research process are listed below:
1. Information Procurement: This stage involved the procurement of Market data or related information via primary and secondary sources. The various secondary sources used included various company websites, annual reports, trade databases, and paid databases such as Hoover's, Bloomberg Business, Factiva, and Avention. Our team did 45 primary interactions Globally which included several stakeholders such as manufacturers, customers, key opinion leaders, etc. Overall, information procurement was one of the most extensive stages in our research process.
2. Information Analysis: This step involved triangulation of data through bottom-up and top-down approaches to estimate and validate the total size and future estimate of the Scaling Chemical inhibitor Market.
3. Report Formulation: The final step entailed the placement of data points in appropriate Market spaces in an attempt to deduce viable conclusions.
4. Validation & Publishing: Validation is the most important step in the process. Validation & re-validation via an intricately designed process helped us finalize data points to be used for final calculations. The final Market estimates and forecasts were then aligned and sent to our panel of industry experts for validation of data. Once the validation was done the report was sent to our Quality Assurance team to ensure adherence to style guides, consistency & design.
Analyst Support
Customization Options
With the given market data, our dedicated team of analysts can offer you the following customization options are available for the Scaling Chemical inhibitor Market:
Product Analysis: Product matrix, which offers a detailed comparison of the product portfolio of companies.
Regional Analysis: Further analysis of the Scaling Chemical inhibitor Market for additional countries.
Competitive Analysis: Detailed analysis and profiling of additional Market players & comparative analysis of competitive products.
Go to Market Strategy: Find the high-growth channels to invest your marketing efforts and increase your customer base.
Innovation Mapping: Identify racial solutions and innovation, connected to deep ecosystems of innovators, start-ups, academics, and strategic partners.
Category Intelligence: Customized intelligence that is relevant to their supply Markets will enable them to make smarter sourcing decisions and improve their category management.
Public Company Transcript Analysis: To improve the investment performance by generating new alpha and making better-informed decisions.
Social Media Listening: To analyze the conversations and trends happening not just around your brand, but around your industry as a whole, and use those insights to make better Marketing decisions.
REQUEST FOR SAMPLE
 REQUEST FREE CUSTOMIZATION


Want to customize this report? This report can be personalized according to your needs. Our analysts and industry experts will work directly with you to understand your requirements and provide you with customized data in a short amount of time. We offer $1000 worth of FREE customization at the time of purchase.
Feedback From Our Clients


 USA (+1) 351-333-4748

