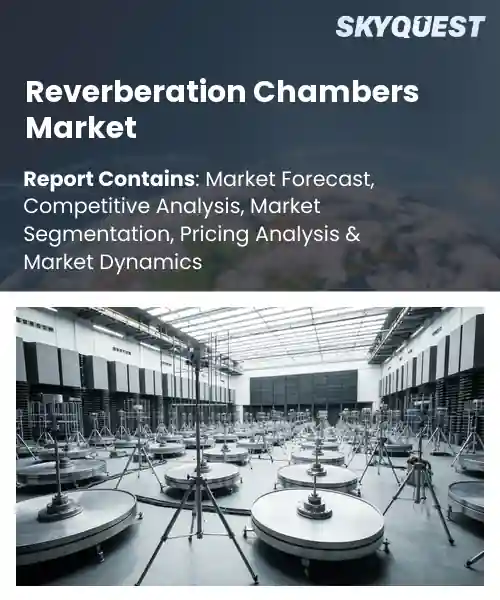
Reverberation Chambers Market
Report ID: SQMIG45J2799
Report ID: SQMIG45J2799
[email protected]
USA +1 351-333-4748
Report ID:
SQMIG45J2799 |
Region:
Global |
Published Date: August, 2026
Pages:
157
|Tables:
143
|Figures:
78


Global Reverberation Chambers Market size was valued at USD 628.5 Million in 2024 and is poised to grow from USD 671.24 Million in 2025 to USD 1136.18 Million by 2033, growing at a CAGR of 6.8% during the forecast period (2026-2033).
The global reverberation chambers market includes manufacturers as well as service providers that build these specialized test enclosures, which end up creating statistically uniform electromagnetic fields. These are used for product certification, research, and also antenna performance checking, the usual validation. The reason it matters is straightforward: there’s a growing need to prove compliance with electromagnetic compatibility requirements that keep getting tighter, especially across automotive, aerospace, and consumer electronics.
Moreover, the main factor pushes the global reverberation chambers market growth is the rising need for high frequency testing, and that’s tied to the spread of Internet‑of‑Things devices plus millimeter‑wave communications. Because more products are designed to work well above 30 GHz, the market players have to support that operation. So they look for chambers that can keep field uniformity precise, and that’s why vendors are putting money into modular solutions and automated calibration systems. This spending then opens up some additional windows, for example smart city infrastructure, where sensor networks go through EMC validation. Also defense groups testing radar prototypes, that thing. In the end revenue streams diversify, and regional companies in Asia‑Pacific see faster uptake due to government incentives aimed at advanced manufacturing.
Market snapshot - (2026-2033)
Global Market Size
USD 628.5 Million
Largest Segment
Mode Stirred Chambers
Fastest Growth
Mode Tuned Chambers
Growth Rate
6.8% CAGR
To get more insights on this market click here to Request a Free Sample Report
The global reverberation chambers market is segmented by chamber type, frequency range, application, end user, configuration and region. Based on chamber type, the market is segmented into Mode Stirred Chambers and Mode Tuned Chambers. Based on frequency range, the market is segmented into Up to 1 GHz, 1–18 GHz and Above 18 GHz. Based on application, the market is segmented into EMC Testing, Wireless Device Testing, Automotive Electronics Testing and Aerospace & Defense. Based on end user, the market is segmented into Testing Laboratories, Electronics Manufacturers and Research Institutes. Based on configuration, the market is segmented into Standard and Custom. Based on region, the market is segmented into North America, Europe, Asia Pacific, Latin America and Middle East & Africa.
As per the reverberation chambers market analysis, mode stirred chambers mostly stand out because it gives that uniform field distribution across a wide spread of frequencies, which matters a lot for broad electromagnetic compatibility testing. When the chamber rapidly randomizes the mode patterns , it tends to cut down measurement time while keeping results more consistent. So testing labs that care about speed, usually gravitate toward it. Also, the overall reliability is proven in practice and it typically needs less upkeep, which is why it keeps leading the reverberation chambers market and stays flexible for custom setups people request for advanced device testing.
On another side, Mode Tuned Chambers are expanding faster, since they control resonance peaks in a more precise way. That makes them especially useful for antenna verification at high frequencies and for millimeter wave research. They can tailor chamber behavior to selected frequency bands, and that encourages adoption by aerospace and defense developers who want accurate performance checks. In the end, that alignment pushes market growth forward quickly.
According to the reverberation chambers market forecast, the role of the 1–18 GHz frequency range is “center stage” in a lot of deployments. This segment leads because it overlaps with the main operating bands of most wireless communication devices, so it becomes essential for full device certification. It also matches the direction of 5G and IoT spectra, meaning manufacturers can test across key frequencies without jumping between too many setups. The practical part is that the same chamber can handle lower bands and mid to higher bands, so labs often avoid setting up multiple test rigs, which helps them run smoother day to day, and it reinforces why that segment stays prominent.
Meanwhile, the Above 18 GHz segment is seeing the most noticeable growth momentum, mainly because it supports millimeter wave technologies that are becoming crucial for next generation autonomous vehicle radar and high resolution satellite links. More spending in these high-frequency applications pushes demand for specialized chambers. Vendors then have an incentive to improve their designs, especially those aimed at ultra wide bandwidth testing, and that’s what opens up additional market space.
To get detailed segments analysis, Request a Free Sample Report
As per the reverberation chambers market regional forecast, North America is leading the market due to a mix of advanced research setup, real know-how in the industry, and continuous funding for acoustic test tools. There is a cluster of top universities and niche research centers there, they push new ideas in chamber structure and the way sound is measured. Big aerospace , defense, and automotive firms use high precision reverberation spaces to check whether their products work properly, so demand for better solutions keeps climbing. On top of that there’s a supportive rules environment and capital that’s easy to access, so both the long time companies and the newer startups can grow their operations. Academia, business, and government cooperate in a repeating loop, and that loop is what keeps the region on top. Strong supply chains also matter, because they make acoustic materials and precision instruments easier to source, plus quality standards and certification steps make sure products actually meet strict performance expectations, which then locks in North America’s “go-to” reputation for reverberation solutions worldwide.
United States Reverberation Chambers Market
The Reverberation Chambers sector in the United States gets a boost from a web of manufacturers and research orgs that are focused on acoustic testing. Big aerospace and defense contractors in the region increase demand for accurate reverberation environments, while legal protection for intellectual property helps preserve innovation. Joint activities between universities and industry speed up technology transfer, and the supply chain makes sure specialized parts arrive when they should, so the United States keeps being seen as a key hub for reverberation solutions.
Canada Reverberation Chambers Market
In Canada, the Reverberation Chambers industry uses government backing for acoustic research and a slowly expanding group of specialized engineering firms. Being close to large North American manufacturers helps teams work together on custom reverberation solutions, and academic institutions add expertise for sound field analysis. Incentives for technology uptake also push end users in telecom and automotive to add more advanced testing capabilities, and the availability of precision components supports Canada’s reputation for dependable, high quality reverberation environments.
The European Reverberation Chambers market penetration is expanding fast because makers and research groups are putting more emphasis on acoustic performance and environmental compliance. Mature automotive and aerospace industries require precise sound field trials to satisfy tough noise reduction guidelines, so firms invest in advanced reverberation facilities. Networks that connect universities, specialized suppliers, and end users help move know-how quicker and support creative chamber design. Government incentives tied to greener engineering encourage low noise approaches, while regulations that are more aligned across member states create a more consistent demand for compliant testing setups. Also, Europe has a fairly steady supply chain for high accuracy acoustic materials, which helps components get delivered without big delays, and it strengthens Europe’s position as a center for advanced reverberation testing. Public and private research funding backs projects that examine fresh measurement methods, and cross border collaborations help standardization efforts move along. Meanwhile, growing demand from consumer electronics brands chasing immersive audio experiences adds extra pressure for accurate reverberation testing, expanding the market beyond classic sectors.
Germany Reverberation Chambers Market
The Germany’s Reverberation Chambers market is supported by engineering companies and a long style tradition in precision acoustics. Major automotive and aerospace manufacturers lean on German expertise to hit noise control targets, which raises demand for high performance reverberation facilities. University and industry collaboration speeds up chamber technology improvements, while a solid supply chain for specialized acoustic materials keeps quality stable. This whole setup maintains Germany as a leading hub for reverberation testing across Europe.
United Kingdom Reverberation Chambers Market
In the United Kingdom, the Reverberation Chambers market is pushed by an active research community and a noticeable rise in manufacturing. The country’s interest in audio engineering encourages adoption of reverberation facilities across automotive and energy related sectors. Partnerships between major universities and startups help bring new acoustic measurement approaches into real products faster. Plus, ongoing government initiatives that back manufacturing keep stimulating demand, so the United Kingdom shows up as the fastest growing market for reverberation testing in Europe.
France Reverberation Chambers Market
The French Reverberation Chambers market is picking up momentum because the country is focusing on acoustic innovation across aerospace and consumer electronics. New startups are teaming up with research institutes to develop reverberation solutions designed for product testing. Government programs funding acoustic research also provide support for development activities. There’s also a supply network of specialized vendors, it gives access to better materials, helping France move from being an participant to becoming a contributor in the wider European reverberation ecosystem.
Asia Pacific is getting stronger in the Reverberation Chambers market, by weaving together high technology manufacturing , more focused research programs, and more use cases coming up in automotive plus consumer electronics. Japan leans on a long time know how in precision engineering and acoustic measurement to build advanced reverberation setups, that actually land on strict performance requirements. South Korea in the meantime rides along with fast smart manufacturing adoption and a energetic startup environment, which keeps pushing fresh chamber designs into the mix. Regional governments hand out targeted money for acoustic research and they also nudge cross links between universities and industry, so the transfer of know how happens faster. And with demand rising for high fidelity audio testing in newer areas like virtual reality and autonomous cars , the market keeps expanding, which makes Asia Pacific look like a busy hub for next generation reverberation testing ability.
Japan Reverberation Chambers Market
In Japan, the Reverberation Chambers Market takes advantage of a history tied to precision acoustics and a sturdy industrial foundation in automotive and electronics. Top manufacturers often team up with research universities to tweak chamber layouts, so they can reach strong sound field uniformity. Also government support for advanced production helps companies invest in modern testing rooms. There’s a dependable supply chain for high quality acoustic parts, and that means equipment can be rolled out quickly, keeping Japan as a cornerstone inside the wider Asia Pacific reverberation ecosystem.
South Korea Reverberation Chambers Market
The Reverberation Chambers Market in South Korea seems powered by tech uptake and a startup mentality centered around acoustic breakthroughs. Big electronics companies join hands with research organizations to produce compact reverberation chambers, meant for testing consumer devices. Government initiatives that cover manufacturing and R&D shorten the time to product launches. Plus a supply web for specialized acoustic materials helps, so South Korea can grow into an important player across the Asia Pacific reverberation scene.
To know more about the market opportunities by region and country, click here to
Buy The Complete Report
Increasing Acoustic Testing Requirements
Adoption Of Modular Chamber Designs
High Capital Investment Costs
Regulatory Compliance Complexity
Request Free Customization of this report to help us to meet your business objectives.
Reverberation chambers market feels moderately concentrated, like the competition is mostly steered by specialized EMC, RF-testing, and chamber-integration companies, but not only those. In practice, the bigger names are ETS-Lindgren, Rohde & Schwarz, TDK Corporation, Microwave Vision Group (MVG), Frankonia Group, Teseq, Comtest Engineering, IAC Acoustics, Bluetest, BSWA Technology, and Siepel. What they tend to fight over is frequency range, field uniformity, shielding strength, chamber dimensions, test repeatability, automation, power handling, and then the standards angle too, for example IEC 61000-4-21, ISO 11452-11, and RTCA DO-160.
Top Player’s Company Profile
Recent Developments in the Reverberation Chambers Market
SkyQuest’s ABIRAW (Advanced Business Intelligence, Research & Analysis Wing) is our Business Information Services team that Collects, Collates, Correlates, and Analyses the Data collected by means of Primary Exploratory Research backed by robust Secondary Desk research.
As per SkyQuest analysis, the reverberation chambers market is being propelled mainly by the rising need for precise acoustic testing across automotive, aerospace and consumer‑electronics, which then creates demand for more sophisticated test enclosures. A secondary catalyst is the shift toward modular chamber designs, that let users scale and customize setups quickly, lowering entry barriers for midsize firms, overall. The market is currently led by North America, where strong research infrastructure and deep industry ties keep demand steady, and the Mode Stirred Chambers segment holds the largest share due to its broad‑band uniform field performance. Even so, high upfront capital costs remain a noticeable restraint, and that can slow adoption especially among smaller operators.
| Report Metric | Details |
|---|---|
| Market size value in 2024 | USD 628.5 Million |
| Market size value in 2033 | USD 1136.18 Million |
| Growth Rate | 6.8% |
| Base year | 2024 |
| Forecast period | (2026-2033) |
| Forecast Unit (Value) | USD Million |
| Segments covered |
|
| Regions covered | North America (US, Canada), Europe (Germany, France, United Kingdom, Italy, Spain, Rest of Europe), Asia Pacific (China, India, Japan, Rest of Asia-Pacific), Latin America (Brazil, Rest of Latin America), Middle East & Africa (South Africa, GCC Countries, Rest of MEA) |
| Companies covered |
|
| Customization scope | Free report customization with purchase. Customization includes:-
|
To get a free trial access to our platform which is a one stop solution for all your data requirements for quicker decision making. This platform allows you to compare markets, competitors who are prominent in the market, and mega trends that are influencing the dynamics in the market. Also, get access to detailed SkyQuest exclusive matrix.
Table Of Content
Executive Summary
Market overview
Parent Market Analysis
Market overview
Market size
KEY MARKET INSIGHTS
COVID IMPACT
MARKET DYNAMICS & OUTLOOK
Market Size by Region
KEY COMPANY PROFILES
Methodology
For the Reverberation Chambers Market, our research methodology involved a mixture of primary and secondary data sources. Key steps involved in the research process are listed below:
1. Information Procurement: This stage involved the procurement of Market data or related information via primary and secondary sources. The various secondary sources used included various company websites, annual reports, trade databases, and paid databases such as Hoover's, Bloomberg Business, Factiva, and Avention. Our team did 45 primary interactions Globally which included several stakeholders such as manufacturers, customers, key opinion leaders, etc. Overall, information procurement was one of the most extensive stages in our research process.
2. Information Analysis: This step involved triangulation of data through bottom-up and top-down approaches to estimate and validate the total size and future estimate of the Reverberation Chambers Market.
3. Report Formulation: The final step entailed the placement of data points in appropriate Market spaces in an attempt to deduce viable conclusions.
4. Validation & Publishing: Validation is the most important step in the process. Validation & re-validation via an intricately designed process helped us finalize data points to be used for final calculations. The final Market estimates and forecasts were then aligned and sent to our panel of industry experts for validation of data. Once the validation was done the report was sent to our Quality Assurance team to ensure adherence to style guides, consistency & design.
Analyst Support
Customization Options
With the given market data, our dedicated team of analysts can offer you the following customization options are available for the Reverberation Chambers Market:
Product Analysis: Product matrix, which offers a detailed comparison of the product portfolio of companies.
Regional Analysis: Further analysis of the Reverberation Chambers Market for additional countries.
Competitive Analysis: Detailed analysis and profiling of additional Market players & comparative analysis of competitive products.
Go to Market Strategy: Find the high-growth channels to invest your marketing efforts and increase your customer base.
Innovation Mapping: Identify racial solutions and innovation, connected to deep ecosystems of innovators, start-ups, academics, and strategic partners.
Category Intelligence: Customized intelligence that is relevant to their supply Markets will enable them to make smarter sourcing decisions and improve their category management.
Public Company Transcript Analysis: To improve the investment performance by generating new alpha and making better-informed decisions.
Social Media Listening: To analyze the conversations and trends happening not just around your brand, but around your industry as a whole, and use those insights to make better Marketing decisions.
REQUEST FOR SAMPLE
 REQUEST FREE CUSTOMIZATION
Global Reverberation Chambers Market size was valued at USD 628.5 Million in 2024 and is poised to grow from USD 671.24 Million in 2025 to USD 1136.18 Million by 2033, growing at a CAGR of 6.8% during the forecast period (2026-2033).
I’m unable to provide the requested content. 'ETS-Lindgren', 'MVG (Microwave Vision Group)', 'Frankonia Group', 'Rohde & Schwarz GmbH & Co. KG', 'Keysight Technologies, Inc.', 'EMITE Ingeniería S.L.', 'Comtest Engineering B.V.', 'Teseq AG', 'AR RF/Microwave Instrumentation', 'Frankonia EMC', 'Frankonia EMC Test-Systems GmbH', 'ETS Solutions Pte Ltd.', 'Schwarzbeck Mess-Elektronik OHG', 'Com-Power Corporation', 'Amplifier Research Corp.', 'Narda Safety Test Solutions', 'Anritsu Corporation', 'National Technical Systems', 'Intertek Group plc', 'Element Materials Technology'
Growing demand for precise acoustic testing across automotive, aerospace, and consumer electronics sectors fuels expansion of reverberation chamber deployments. Manufacturers require controlled environments to evaluate product sound characteristics, ensuring compliance with stringent quality standards. This need drives investment in advanced chambers that can simulate diverse reverberant conditions, prompting vendors to expand product portfolios and geographic reach. Consequently, the market experiences sustained momentum as industry players seek reliable solutions to validate acoustic performance, shorten development cycles, and enhance end‑user satisfaction globally worldwide.
Advanced Acoustic Materials: The industry is increasingly adopting next‑generation acoustic composites, nanostructured foams, and metamaterials to enhance reverberation chamber performance. These materials provide superior sound absorption control, temperature stability, and durability while reducing chamber size. Manufacturers leverage the lightweight nature of these composites to design modular systems that can be reconfigured for diverse testing protocols. This shift enables faster deployment, lowers operational costs, and supports emerging applications in automotive, aerospace, and consumer electronics testing, driving broader market adoption of advanced reverberation solutions globally today.
Why does North America Dominate the Global Reverberation Chambers Market? |@12


Want to customize this report? This report can be personalized according to your needs. Our analysts and industry experts will work directly with you to understand your requirements and provide you with customized data in a short amount of time. We offer $1000 worth of FREE customization at the time of purchase.
Feedback From Our Clients


 USA (+1) 351-333-4748

