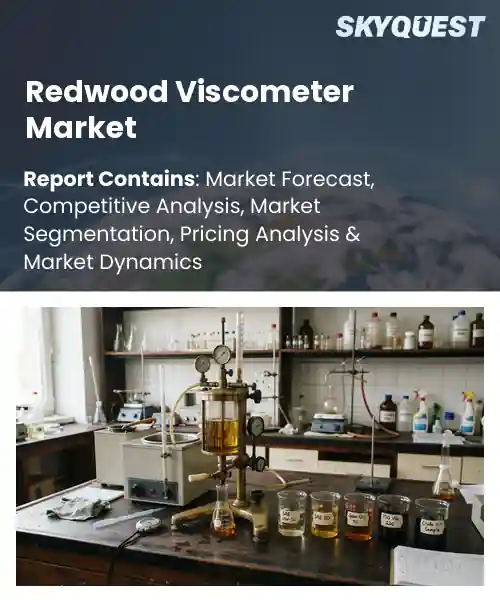
Redwood Viscometer Market
Report ID: SQMIG45J2850
Report ID: SQMIG45J2850
[email protected]
USA +1 351-333-4748
Report ID:
SQMIG45J2850 |
Region:
Global |
Published Date: August, 2026
Pages:
157
|Tables:
117
|Figures:
77


Global Redwood Viscometer Market size was valued at USD 96.0 Million in 2024 and is poised to grow from USD 100.7 Million in 2025 to USD 147.66 Million by 2033, growing at a CAGR of 4.9% during the forecast period (2026-2033).
At the core of the Redwood viscometer market lies the escalating need for precise viscosity measurement in lubricants. This market comprises manufacturers of Redwood‑branded rotary and capillary viscometers, distributors, and end‑users ranging from automotive OEMs to petrochemical refineries. Accurate viscosity data directly influences engine efficiency, product quality, and regulatory compliance, making the technology indispensable across sectors. Historically, the market evolved from manual glass‑tube instruments in the 1970s to sophisticated digital units that integrate temperature control and data logging. A notable milestone occurred in 2015 when Redwood launched its IoT‑enabled rotary viscometer, prompting rapid adoption by refineries seeking real‑time process optimization. Building on this foundation, the main growth catalyst for the global Redwood viscometer market is the rising demand for real‑time analytics in petrochemical and renewable‑energy operations. Refineries and bio‑fuel plants aim to cut waste and meet tighter emissions rules, so they depend on viscosity monitoring to adjust reaction conditions. This dependence pushes manufacturers to embed advanced sensors and cloud analytics in Redwood units, creating a feedback loop that lifts yield while lowering costs. A European bio‑diesel plant saw a 12 % boost in conversion efficiency after adding Redwood’s IoT viscometer to its transesterification line, highlighting the market’s potential for performance‑driven upgrades.
How is AI-driven automation influencing the Redwood viscometer market?
AI-driven automation is reshaping the Redwood viscometer market by embedding intelligent data capture, real‑time analysis, and predictive maintenance into traditional measurement workflows. Sensors now feed raw viscosity readings into machine‑learning models that instantly flag anomalies, reducing manual interpretation and speeding up quality‑control cycles. Manufacturers are integrating these capabilities into both new and retrofitted instruments, allowing labs to run longer unattended tests while maintaining accuracy. The automation layer also streamlines calibration schedules, as algorithms predict optimal timing, cutting downtime and operational costs. Together, these advances are making Redwood viscometers more adaptable to high‑throughput environments and expanding their appeal across polymer, food, and pharmaceutical sectors.In July 2025 a leading instrument maker announced an AI‑enhanced Redwood viscometer line, highlighting faster sample turnaround and reduced operator intervention, which underscores how automation is driving efficiency and market growth.
Market snapshot - (2026-2033)
Global Market Size
USD 96.0 Million
Largest Segment
Redwood No. 1 Viscometer
Fastest Growth
Redwood No. 2 Viscometer
Growth Rate
4.9% CAGR
To get more insights on this market click here to Request a Free Sample Report
Global redwood viscometer market is segmented by product type, operation, application, end user and region. Based on product type, the market is segmented into Redwood No. 1 Viscometer and Redwood No. 2 Viscometer. Based on operation, the market is segmented into Manual and Digital. Based on application, the market is segmented into Petroleum Products Testing, Lubricants Testing, Bitumen & Heavy Oils Testing and Industrial Fluids Testing. Based on end user, the market is segmented into Oil & Gas Companies, Testing Laboratories, Research & Academic Institutions and Industrial Manufacturing Facilities. Based on region, the market is segmented into North America, Europe, Asia Pacific, Latin America and Middle East & Africa.
Redwood No. 1 Viscometer segment dominates because it offers unparalleled precision and durability that align with stringent quality standards in oil and gas testing. Its long‑standing reputation for reliable performance under harsh conditions builds confidence among testing laboratories and industrial facilities. This trust drives repeat purchases and entrenches the model as the go‑to solution for critical viscosity measurements across diverse applications and supports compliance with evolving industry regulations.
However, Redwood No. 2 Viscometer segment is witnessing the strongest growth momentum as users seek cost‑effective alternatives with comparable accuracy. Innovations in sensor technology and simplified calibration reduce operational complexity, attracting emerging testing labs and research institutions. This expanding adoption fuels market expansion and opens new opportunities for ancillary services and upgrades.
Digital operation segment leads because it delivers real‑time data capture, remote monitoring, and seamless integration with laboratory information management systems. These capabilities address efficiency pressures and data integrity demands across testing laboratories and industrial facilities. By minimizing human error and enabling rapid decision‑making, digital viscometers enhance productivity and align with Industry 4.0 initiatives, reinforcing their appeal as the preferred technological choice. Additionally, the ease of software updates ensures continuous feature enhancements without hardware replacement.
Meanwhile, manual operation segment emerges as the key high‑growth area as cost‑sensitive users in emerging testing labs prioritize affordability and straightforward maintenance. The simplicity of analog readouts reduces training requirements, making these devices attractive for educational institutions and small‑scale manufacturers. This broadened user base accelerates market penetration and creates demand for supporting accessories and service contracts.
To get detailed segments analysis, Request a Free Sample Report
North America maintains a leading position through a combination of deep industrial expertise, extensive research and development capabilities, and a culture that prioritizes precision engineering. The region benefits from a mature supply chain that seamlessly integrates component manufacturers with end‑user industries such as chemicals, polymers, and advanced manufacturing. Strong collaboration between academic institutions and technology firms fuels continuous innovation, while regulatory frameworks encourage rigorous quality control practices. Additionally, a highly skilled workforce and widespread adoption of automation reinforce the market’s resilience and capacity for sustained leadership.
United States Redwood Viscometer Market
Redwood Viscometer Market in the United States thrives on a robust ecosystem of high‑tech manufacturers and a demand for exacting measurement standards across diverse sectors. The presence of leading research universities and industry consortia drives ongoing product refinement, while customer expectations for reliability and performance shape adoption trends. Integration with digital data platforms further enhances operational efficiency, positioning the market as a cornerstone of quality assurance in the nation’s manufacturing landscape.
Canada Redwood Viscometer Market
Redwood Viscometer Market in Canada is supported by a strong emphasis on sustainable industrial practices and a collaborative network of research institutions. The market benefits from close ties between equipment suppliers and sectors such as petrochemicals, food processing, and specialty polymers, where precise viscosity control is essential. Government initiatives that promote technological advancement and workforce development reinforce the market’s growth, fostering a climate of innovation and high‑quality standards.
Europe’s rapid expansion is propelled by stringent environmental and safety regulations that demand precise fluid characterization across multiple industries. The region’s deep pool of engineering talent and world‑class research facilities accelerate the development of advanced viscometer technologies. Strong cross‑border collaboration among manufacturers, academic partners, and standards bodies ensures harmonized product specifications, facilitating market penetration. Moreover, a growing focus on high‑value sectors such as pharmaceuticals, specialty chemicals, and automotive engineering fuels demand for reliable viscosity measurement solutions, reinforcing Europe’s position as a dynamic growth hub.
Germany Redwood Viscometer Market
Redwood Viscometer Market in Germany is anchored by a tradition of engineering excellence and a dense concentration of high‑precision manufacturing firms. The market enjoys close cooperation with leading chemical and automotive companies that require exact viscosity control for product performance. Continuous investment in research and a culture of quality assurance drive the adoption of sophisticated measurement tools, reinforcing Germany’s status as a dominant force within the European landscape.
United Kingdom Redwood Viscometer Market
Redwood Viscometer Market in the United Kingdom is experiencing accelerated adoption driven by a vibrant life‑science sector and expanding specialty chemicals industry. Collaborative initiatives between universities and industrial partners foster rapid innovation cycles, while regulatory expectations for product consistency heighten demand for accurate viscometry. The market’s agility in integrating digital analytics further enhances its appeal, positioning the United Kingdom as a fast‑growing contributor to regional expansion.
France Redwood Viscometer Market
Redwood Viscometer Market in France is emerging as a notable player through focused investment in research collaborations and a growing emphasis on high‑performance materials. The market benefits from strong ties to the cosmetics and food processing sectors, where precise viscosity measurement underpins product quality. Emerging startups and established equipment providers alike are advancing sensor technologies, contributing to a dynamic environment that supports market maturation.
Asia Pacific is strengthening its position by leveraging rapid industrialization and a strategic focus on high‑technology manufacturing. The region’s commitment to modernizing production processes drives demand for sophisticated viscosity measurement tools that ensure product consistency and efficiency. Collaborative ecosystems linking equipment manufacturers with automotive, electronics, and polymer industries foster continuous innovation. Government policies that encourage research and development, coupled with a growing pool of skilled engineers, create a fertile environment for the adoption of advanced viscometry solutions, enhancing the region’s competitive edge.
Japan Redwood Viscometer Market
Redwood Viscometer Market in Japan benefits from a legacy of precision engineering and a strong emphasis on quality control across automotive and high‑tech sectors. Close partnerships between instrument makers and end‑user industries promote the development of highly reliable measurement solutions. The market’s focus on integrating advanced analytics with traditional viscometry supports continuous improvement, reinforcing Japan’s reputation for meticulous manufacturing standards.
South Korea Redwood Viscometer Market
Redwood Viscometer Market in South Korea is propelled by a dynamic electronics and petrochemical landscape that demands exact fluid characterization. The market thrives on close collaboration between technology firms and research institutions, fostering rapid adoption of cutting‑edge viscometer designs. Emphasis on digital integration and smart manufacturing further enhances the market’s appeal, positioning South Korea as a key contributor to regional advancement.
To know more about the market opportunities by region and country, click here to
Buy The Complete Report
Rising Demand for Accurate Viscosity
Manufacturers are adopting more precise redwood viscometer designs, which enable consistent measurement across a broader range of fluids. This enhances confidence among users in sectors such as pharmaceuticals and petrochemicals, encouraging replacement of legacy equipment. The improved reliability reduces repeat testing, saving time and resources, and fosters compliance with stringent quality standards. Consequently, organizations are more inclined to invest in upgraded instrumentation, propelling market expansion as demand for high‑performance viscosity analysis tools grows across global production facilities and research laboratories.
Advancements in Sensor Technology
Recent developments in optical and acoustic sensor technology are being integrated into redwood viscometers, delivering faster response times and higher sensitivity. These improvements allow operators to detect subtle viscosity changes in real‑time, which is critical for process optimization and quality control. By simplifying calibration procedures and extending instrument lifespan, manufacturers reduce total cost of ownership. This technological edge motivates end‑users to upgrade their measurement systems, thereby stimulating market growth as the benefits of advanced sensors become widely recognized in the industry.
High Initial Equipment Cost
The purchase price of redwood viscometers remains relatively high compared with conventional viscosity measurement devices, which deters small and medium‑sized enterprises from immediate adoption. Budget constraints force these organizations to prioritize core operational expenses over capital investment in advanced instrumentation. Consequently, many firms continue to rely on existing, less precise equipment, limiting the overall market penetration of newer technology. This financial barrier slows the rate at which the redwood viscometer market expands, particularly in cost‑sensitive regions and hamper broader industry adoption.
Limited Awareness of Benefits
Potential users often lack comprehensive understanding of the performance advantages offered by redwood viscometers, leading to hesitation in replacing familiar measurement tools. This knowledge gap results from insufficient marketing outreach and limited exposure to case studies demonstrating tangible improvements. Without clear evidence of added value, decision‑makers may opt for established alternatives, slowing demand for newer instruments. Enhancing education and showcasing success stories are therefore essential to overcome this restraint and accelerate market uptake among a broader range of industrial applications worldwide.
Request Free Customization of this report to help us to meet your business objectives.
Redwood viscometer manufacturers are intensifying competition through targeted acquisitions of niche sensor firms, joint development agreements with polymer producers, and the integration of AI‑driven viscosity analytics into legacy hardware, accelerating product differentiation and market share gains.
Top Player’s Company Profile
Recent Developments
SkyQuest’s ABIRAW (Advanced Business Intelligence, Research & Analysis Wing) is our Business Information Services team that Collects, Collates, Correlates, and Analyses the Data collected by means of Primary Exploratory Research backed by robust Secondary Desk research. As per SkyQuest analysis the global Redwood viscometer market is propelled primarily by the rising demand for accurate viscosity measurements which boost confidence in sectors such as pharmaceuticals and petrochemicals, while a second important catalyst is the infusion of AI‑driven automation that delivers real‑time analytics and predictive maintenance, enhancing productivity across laboratories. The market is led by North America, where deep industrial expertise and robust supply chains sustain growth, and the Redwood No 1 Viscometer remains the dominant segment thanks to its unmatched precision and durability. However, high initial equipment cost restrains adoption among small and medium enterprises, slowing broader market penetration.
| Report Metric | Details |
|---|---|
| Market size value in 2024 | USD 96.0 Million |
| Market size value in 2033 | USD 147.66 Million |
| Growth Rate | 4.9% |
| Base year | 2024 |
| Forecast period | (2026-2033) |
| Forecast Unit (Value) | USD Million |
| Segments covered |
|
| Regions covered | North America (US, Canada), Europe (Germany, France, United Kingdom, Italy, Spain, Rest of Europe), Asia Pacific (China, India, Japan, Rest of Asia-Pacific), Latin America (Brazil, Rest of Latin America), Middle East & Africa (South Africa, GCC Countries, Rest of MEA) |
| Companies covered |
|
| Customization scope | Free report customization with purchase. Customization includes:-
|
To get a free trial access to our platform which is a one stop solution for all your data requirements for quicker decision making. This platform allows you to compare markets, competitors who are prominent in the market, and mega trends that are influencing the dynamics in the market. Also, get access to detailed SkyQuest exclusive matrix.
Table Of Content
Executive Summary
Market overview
Parent Market Analysis
Market overview
Market size
KEY MARKET INSIGHTS
COVID IMPACT
MARKET DYNAMICS & OUTLOOK
Market Size by Region
KEY COMPANY PROFILES
Methodology
For the Redwood Viscometer Market, our research methodology involved a mixture of primary and secondary data sources. Key steps involved in the research process are listed below:
1. Information Procurement: This stage involved the procurement of Market data or related information via primary and secondary sources. The various secondary sources used included various company websites, annual reports, trade databases, and paid databases such as Hoover's, Bloomberg Business, Factiva, and Avention. Our team did 45 primary interactions Globally which included several stakeholders such as manufacturers, customers, key opinion leaders, etc. Overall, information procurement was one of the most extensive stages in our research process.
2. Information Analysis: This step involved triangulation of data through bottom-up and top-down approaches to estimate and validate the total size and future estimate of the Redwood Viscometer Market.
3. Report Formulation: The final step entailed the placement of data points in appropriate Market spaces in an attempt to deduce viable conclusions.
4. Validation & Publishing: Validation is the most important step in the process. Validation & re-validation via an intricately designed process helped us finalize data points to be used for final calculations. The final Market estimates and forecasts were then aligned and sent to our panel of industry experts for validation of data. Once the validation was done the report was sent to our Quality Assurance team to ensure adherence to style guides, consistency & design.
Analyst Support
Customization Options
With the given market data, our dedicated team of analysts can offer you the following customization options are available for the Redwood Viscometer Market:
Product Analysis: Product matrix, which offers a detailed comparison of the product portfolio of companies.
Regional Analysis: Further analysis of the Redwood Viscometer Market for additional countries.
Competitive Analysis: Detailed analysis and profiling of additional Market players & comparative analysis of competitive products.
Go to Market Strategy: Find the high-growth channels to invest your marketing efforts and increase your customer base.
Innovation Mapping: Identify racial solutions and innovation, connected to deep ecosystems of innovators, start-ups, academics, and strategic partners.
Category Intelligence: Customized intelligence that is relevant to their supply Markets will enable them to make smarter sourcing decisions and improve their category management.
Public Company Transcript Analysis: To improve the investment performance by generating new alpha and making better-informed decisions.
Social Media Listening: To analyze the conversations and trends happening not just around your brand, but around your industry as a whole, and use those insights to make better Marketing decisions.
REQUEST FOR SAMPLE
 REQUEST FREE CUSTOMIZATION


Want to customize this report? This report can be personalized according to your needs. Our analysts and industry experts will work directly with you to understand your requirements and provide you with customized data in a short amount of time. We offer $1000 worth of FREE customization at the time of purchase.
Feedback From Our Clients


 USA (+1) 351-333-4748

