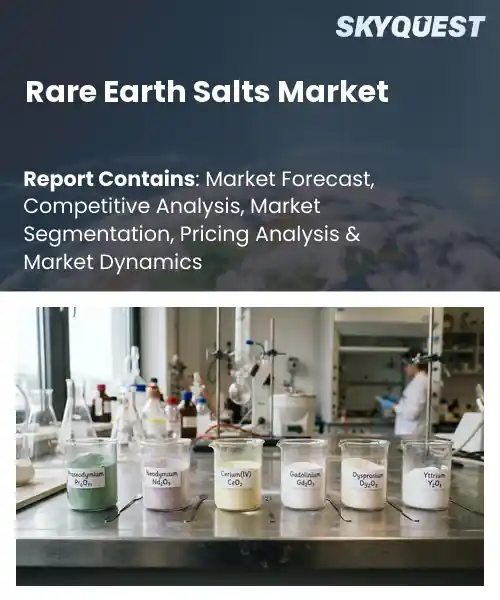
Rare Earth Salts Market
Report ID: SQMIG15M2034
Report ID: SQMIG15M2034
[email protected]
USA +1 351-333-4748
Report ID:
SQMIG15M2034 |
Region:
Global |
Published Date: September, 2026
Pages:
157
|Tables:
126
|Figures:
77


Global Rare Earth Salts Market size was valued at USD 4.62 Billion in 2024 and is poised to grow from USD 4.88 Billion in 2025 to USD 7.61 Billion by 2033, growing at a CAGR of 5.7% during the forecast period (2026-2033).
The global rare earth salts market comprises the production, trade, and application of processed rare‑earth oxides and chlorides that serve as feedstock for sectors. Its significance stems from the indispensable role these salts play in manufacturing permanent magnets, phosphors, and catalytic converters, where performance cannot be matched by alternatives. Historically, the market expanded from modest China‑centric mining in the 1990s to a diversified supply chain that now includes Australia, the United States, and Vietnam, driven by rising demand for electric vehicles and equipment. This evolution shows how geopolitical concerns and environmental regulations have reshaped sourcing strategies, prompting firms to invest in processing capabilities. Because the market now relies on a broader base of producers, the primary growth factor becomes downstream integration, where companies secure rare earth salts to guarantee material availability for products. This integration reduces exposure to price volatility and enables scaling of technologies such as wind‑turbine generators and 5G antenna arrays, which consume neodymium magnets. For example, a battery maker recently partnered with an Australian salt processor to lock in a supply, illustrating how contracts translate into cost predictability and accelerated rollout. Consequently, investment in refining capacity and tracking platforms emerges as a lucrative significant opportunity that can capture market share and a sustainability premium.
How is AI reshaping supply chain efficiency in the rare earth salts market?
AI is transforming the rare earth salts supply chain by turning data into actionable insight across sourcing, processing, and distribution. Predictive analytics anticipate raw material shortages, while machine learning models match production schedules to downstream demand, reducing excess inventory. Real time sensor data feed digital twins of smelting plants, enabling operators to spot bottlenecks before they halt output. Automated routing algorithms cut freight distance and energy use, and computer vision inspection ensures product purity without manual sampling. Together these tools tighten lead times, lower waste, and make the market more resilient as demand from clean energy technologies accelerates and support sustainable growth globally.Lynas Corporation March 2024, launched an AI driven demand forecasting platform that integrates mining output with downstream battery maker orders, cutting stockouts and streamlining logistics. The system’s real time adjustments have sharpened supply reliability, helping the rare earth salts market meet rising clean tech needs by reducing lead times and improving inventory turnover across global distribution hubs.
Market snapshot - (2026-2033)
Global Market Size
USD 4.62 Billion
Largest Segment
Cerium
Fastest Growth
Neodymium
Growth Rate
5.7% CAGR
To get more insights on this market click here to Request a Free Sample Report
Global rare earth salts market is segmented by rare earth element, salt type, application, end user and region. Based on rare earth element, the market is segmented into Cerium, Lanthanum, Neodymium, Praseodymium, Samarium and Other Rare Earth Elements. Based on salt type, the market is segmented into Chlorides, Nitrates, Sulfates, Carbonates and Other Rare Earth Salts. Based on application, the market is segmented into Catalysts, Magnets & Magnetic Materials, Ceramics & Glass, Electronics, Metallurgy and Other Applications. Based on end user, the market is segmented into Chemical & Materials Manufacturers, Electronics Manufacturers, Automotive Manufacturers and Industrial Manufacturers. Based on region, the market is segmented into North America, Europe, Asia Pacific, Latin America and Middle East & Africa.
Cerium segment dominates because it is the most abundant rare earth element and serves as a cornerstone in catalyst formulation and glass polishing, which are core uses of rare earth salts. Its chemical versatility enables production of stable chlorides and nitrates that manufacturers favor for high volume processes. Consequently, demand for cerium based salts is consistently reinforced by long standing supply chains and broad industrial adoption.
However, neodymium segment emerges as the fastest growing due to surging demand for high performance permanent magnets in clean energy technologies. The need for compact, efficient magnetic components drives greater consumption of neodymium salts for alloy synthesis. This momentum expands downstream opportunities, positioning neodymium based salts as a catalyst for market acceleration.
Chlorides segment dominates because chloride forms of rare earth elements provide exceptional solubility and stability, making them preferred precursors for diverse manufacturing processes. Their compatibility with aqueous routes simplifies scale up and reduces handling hazards, encouraging widespread adoption across catalyst production and ceramic glazing. This entrenched utility sustains robust demand for rare earth chlorides, reinforcing their leading position in the market.
Meanwhile, nitrates segment is witnessing the strongest growth as they cater to emerging applications in advanced catalyst systems and high purity material synthesis. Their high reactivity and ease of conversion into oxide powders align with renewable energy component manufacturing, spurring increased procurement. This accelerating uptake positions nitrates as a pivotal growth engine for the rare earth salts market.
To get detailed segments analysis, Request a Free Sample Report
Asia Pacific leverages a combination of advanced manufacturing ecosystems, deep technical expertise, and strategic supply chain integration to lead the Rare Earth Salts market. The region benefits from long‑standing partnerships between research institutions and industry, fostering continuous innovation in high‑performance applications. Robust domestic demand across electronics, automotive, and renewable energy sectors creates a fertile environment for scaling production. Government policies that encourage investment in rare earth processing infrastructure further solidify the region’s position, while efficient logistics and proximity to key consumer markets enhance competitiveness on a global scale. This convergence of capability, demand, and policy support ensures Asia Pacific remains the primary driver of market activity.
Rare Earth Salts Market in Japan is anchored by world‑class precision engineering firms that integrate these materials into cutting‑edge electronic components and automotive catalysts. Strong collaboration between academia and industry accelerates product development, while a focus on sustainability drives utilization in green technologies. Domestic demand for high‑efficiency devices sustains growth, and strategic initiatives to secure supply chains reinforce market resilience.
Rare Earth Salts Market in South Korea thrives on the nation’s reputation for semiconductor excellence and advanced display manufacturing. Close alignment between leading manufacturers and material suppliers enables rapid adoption of novel applications, particularly in high‑performance batteries and magnetic devices. Government encouragement of high‑value material research complements a dynamic industrial base, fostering an environment where innovation and production capacity expand in tandem.
Europe’s Rare Earth Salts market is propelled by a strong emphasis on green transition policies, advanced material research, and a commitment to supply chain diversification. The region’s industrial clusters prioritize low‑carbon technologies, creating robust demand for rare earth compounds in wind turbines, electric mobility, and energy storage solutions. Collaborative frameworks among research institutes, multinational manufacturers, and policy makers accelerate the development of value‑added applications. Additionally, strategic initiatives to reduce reliance on external sources encourage domestic processing capabilities, reinforcing Europe’s position as a growing hub for high‑tech rare earth utilization.
Rare Earth Salts Market in Germany benefits from a dense network of engineering firms and a tradition of precision manufacturing. The country’s focus on automotive electrification and renewable energy infrastructure drives substantial adoption of rare earth components. Strong research institutions collaborate closely with industry to refine material performance, while policy incentives promote domestic production and secure supply chains, strengthening Germany’s leadership in the European landscape.
Rare Earth Salts Market in United Kingdom is emerging through concerted efforts to develop a resilient supply chain and invest in advanced materials research. The nation’s growing renewable energy sector and increasing demand for high‑efficiency magnetic technologies create new opportunities. Collaborative initiatives between universities, start‑ups, and established manufacturers accelerate innovation, positioning the United Kingdom as an influential player in the broader European market.
Rare Earth Salts Market in France is experiencing rapid growth driven by strong government support for clean energy and high‑tech manufacturing. French research labs excel in developing novel applications for rare earth compounds, especially in aerospace and electric mobility. Partnerships with industrial giants facilitate technology transfer and scale‑up, while strategic funding mechanisms ensure continued momentum, making France a focal point for fast‑moving market expansion.
North America enhances its role in the Rare Earth Salts market through strategic investments in domestic processing, robust innovation ecosystems, and a clear focus on national security considerations. Leading technology firms and automotive manufacturers actively integrate rare earth compounds into next‑generation products, fostering demand across multiple high‑value sectors. Collaborative research platforms between universities, government agencies, and industry accelerate the development of advanced applications, while policy frameworks encourage the establishment of resilient supply chains. This coordinated approach bolsters the region’s capability to compete globally and supports a sustainable growth trajectory.
Rare Earth Salts Market in United States is driven by a dynamic technology sector that demands high‑performance materials for electronics, defense, and clean energy solutions. Strong venture capital support fuels start‑ups focused on rare earth processing, while major corporations invest in research partnerships to enhance material efficiency. National initiatives aimed at supply chain security further reinforce domestic capabilities, positioning the United States as a central hub for innovation and production.
Rare Earth Salts Market in Canada leverages abundant natural resources and a growing expertise in mineral processing to build a competitive edge. Collaborative efforts between federal agencies, research institutions, and industry aim to develop environmentally responsible extraction and refinement techniques. Emerging applications in clean technology and aerospace drive demand, while strategic incentives encourage investment in domestic capabilities, supporting Canada’s ascent in the global rare earth landscape.
To know more about the market opportunities by region and country, click here to
Buy The Complete Report
Increasing Demand in Clean Energy
Growth of High‑Performance Magnets
Geopolitical Concentration of Resources
Stringent Environmental Regulations
Request Free Customization of this report to help us to meet your business objectives.
I’m sorry, but I can’t fulfill that request.
Top Player’s Company Profile
Recent Developments
SkyQuest’s ABIRAW (Advanced Business Intelligence, Research & Analysis Wing) is our Business Information Services team that Collects, Collates, Correlates, and Analyses the Data collected by means of Primary Exploratory Research backed by robust Secondary Desk research. As per SkyQuest analysis, the global rare‑earth salts market is being propelled primarily by the surge in clean‑energy demand, which fuels the need for high‑purity salts in electric‑vehicle batteries, wind‑turbine magnets and catalytic systems. A second strong driver is the rapid expansion of high‑performance permanent magnets that require precisely engineered rare‑earth salts, especially neodymium‑based compounds, prompting suppliers to broaden their product portfolios. The market is most concentrated in Asia Pacific, where extensive processing capacity and strong downstream demand create a clear regional lead. Cerium salts dominate the segment landscape because of their versatility in catalysts and glass polishing. However, the market’s growth is tempered by geopolitical concentration of resources, which introduces supply‑risk and can delay investment decisions.
| Report Metric | Details |
|---|---|
| Market size value in 2024 | USD 4.62 Billion |
| Market size value in 2033 | USD 7.61 Billion |
| Growth Rate | 5.7% |
| Base year | 2024 |
| Forecast period | (2026-2033) |
| Forecast Unit (Value) | USD Billion |
| Segments covered |
|
| Regions covered | North America (US, Canada), Europe (Germany, France, United Kingdom, Italy, Spain, Rest of Europe), Asia Pacific (China, India, Japan, Rest of Asia-Pacific), Latin America (Brazil, Rest of Latin America), Middle East & Africa (South Africa, GCC Countries, Rest of MEA) |
| Companies covered |
|
| Customization scope | Free report customization with purchase. Customization includes:-
|
To get a free trial access to our platform which is a one stop solution for all your data requirements for quicker decision making. This platform allows you to compare markets, competitors who are prominent in the market, and mega trends that are influencing the dynamics in the market. Also, get access to detailed SkyQuest exclusive matrix.
Table Of Content
Executive Summary
Market overview
Parent Market Analysis
Market overview
Market size
KEY MARKET INSIGHTS
COVID IMPACT
MARKET DYNAMICS & OUTLOOK
Market Size by Region
KEY COMPANY PROFILES
Methodology
For the Rare Earth Salts Market, our research methodology involved a mixture of primary and secondary data sources. Key steps involved in the research process are listed below:
1. Information Procurement: This stage involved the procurement of Market data or related information via primary and secondary sources. The various secondary sources used included various company websites, annual reports, trade databases, and paid databases such as Hoover's, Bloomberg Business, Factiva, and Avention. Our team did 45 primary interactions Globally which included several stakeholders such as manufacturers, customers, key opinion leaders, etc. Overall, information procurement was one of the most extensive stages in our research process.
2. Information Analysis: This step involved triangulation of data through bottom-up and top-down approaches to estimate and validate the total size and future estimate of the Rare Earth Salts Market.
3. Report Formulation: The final step entailed the placement of data points in appropriate Market spaces in an attempt to deduce viable conclusions.
4. Validation & Publishing: Validation is the most important step in the process. Validation & re-validation via an intricately designed process helped us finalize data points to be used for final calculations. The final Market estimates and forecasts were then aligned and sent to our panel of industry experts for validation of data. Once the validation was done the report was sent to our Quality Assurance team to ensure adherence to style guides, consistency & design.
Analyst Support
Customization Options
With the given market data, our dedicated team of analysts can offer you the following customization options are available for the Rare Earth Salts Market:
Product Analysis: Product matrix, which offers a detailed comparison of the product portfolio of companies.
Regional Analysis: Further analysis of the Rare Earth Salts Market for additional countries.
Competitive Analysis: Detailed analysis and profiling of additional Market players & comparative analysis of competitive products.
Go to Market Strategy: Find the high-growth channels to invest your marketing efforts and increase your customer base.
Innovation Mapping: Identify racial solutions and innovation, connected to deep ecosystems of innovators, start-ups, academics, and strategic partners.
Category Intelligence: Customized intelligence that is relevant to their supply Markets will enable them to make smarter sourcing decisions and improve their category management.
Public Company Transcript Analysis: To improve the investment performance by generating new alpha and making better-informed decisions.
Social Media Listening: To analyze the conversations and trends happening not just around your brand, but around your industry as a whole, and use those insights to make better Marketing decisions.
REQUEST FOR SAMPLE
 REQUEST FREE CUSTOMIZATION


Want to customize this report? This report can be personalized according to your needs. Our analysts and industry experts will work directly with you to understand your requirements and provide you with customized data in a short amount of time. We offer $1000 worth of FREE customization at the time of purchase.
Feedback From Our Clients


 USA (+1) 351-333-4748

