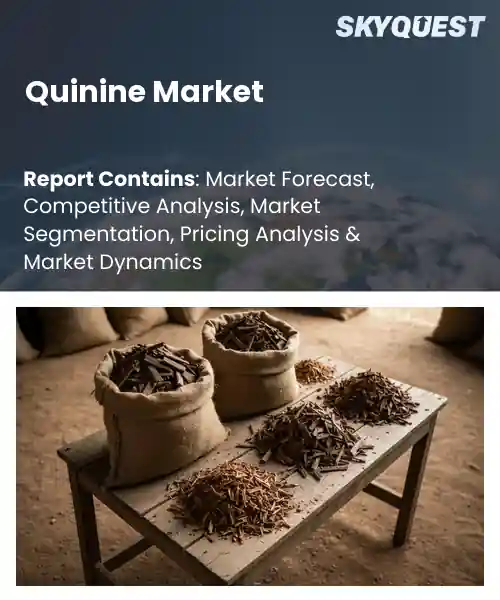
Quinine Market
Report ID: SQMIG35I2587
Report ID: SQMIG35I2587
[email protected]
USA +1 351-333-4748
Report ID:
SQMIG35I2587 |
Region:
Global |
Published Date: March, 2026
Pages:
157
|Tables:
172
|Figures:
79


Global Quinine Market size was valued at USD 2.1 Billion in 2024 and is poised to grow from USD 2.22 Billion in 2025 to USD 3.49 Billion by 2033, growing at a CAGR of 5.8% during the forecast period (2026-2033).
The quinine market is dominated by the demand for therapeutic uses as an antimalarial and a precursor for pharmaceutical products, which affect purchasing habits, pricing and capital investments. The industry includes the cinchona bark, quinine salt extracts and niche beverage flavorings that contain quinine. It is important to note that any disruption in the supply of quinine due to a shortage of raw materials or price shocks will negatively impact the ability to access treatment in areas that are endemic for malaria and the production of beverages that utilize quinine. From the colonial days of sourcing cinchona bark through the establishment of large industrial extraction in the 19th century to today's market where quinine has become increasingly important as a result of resistance to first line therapies, particularly chloroquine and, more recently, artemisinin.
Increased demand for quinine due to antimalarial resistance and the continuing emergence of non-therapeutic uses will drive the continued quinine market growth worldwide and influence the way that capital is allocated in the quinine industry. Ministries of health respond to increasing drug resistance by increasing their procurement of quinine salt products for use in hospitals. This results in increasing demand, increasing prices and providing an incentive for producers to increase extraction capacity or make investments in cinchona plantations. At the same time the growing consumer interest in quality cocktails and artisan tonics creates an increasing demand for food and beverage grade quinine, which motivates beverage manufacturers to find quinine sources and develop product differentiation.
How is AI Improving Supply Chain Efficiency in the Quinine Market?
AI enhances the efficiency of the pharmaceutical industry's supply chain by improving forecasting quality control sourcing and logistics within the quinine market. For example, machine learning models can analyze factors such as past sales data, the weather, and the quantity of cichona bark that has been harvested during a given period to smooth the demand variability driven by fluctuations in cichona bark supplies. Furthermore, by using computer vision to help with grading bark and determining if any of the bark is contaminated, processors will be able to receive feedstock that is more uniform and reliable. When supply managers are able to track crop yields via remote sensing they can determine if and where they need to source alternate supplies prior to having a supply chain disruption or shortage. AI also improves routing efficiency and staging of the finished product, which enables formulators to receive their orders much more quickly. In addition to reducing waste and allowing for quicker responses to shortages, these capabilities create the necessary accountability needed to meet regulatory traceability requirements and encourage collaboration with suppliers across the highly complex botanical supply chains used to manufacture finished quinine products.
Market snapshot - (2026-2033)
Global Market Size
USD 2.1 Billion
Largest Segment
Quinine Sulfate
Fastest Growth
Quinine Hydrochloride
Growth Rate
5.8% CAGR
To get more insights on this market click here to Request a Free Sample Report
Global quinine market is segmented into product type, application, form, source, end user, distribution channel and region. Based on product type, the market is segmented into quinine sulfate, quinine hydrochloride, quinine dihydrochloride and others. Based on application, the market is segmented into pharmaceuticals, food & beverages and others. Based on form, the market is segmented into powder, liquid and tablets / capsules. Based on by source, the market is segmented into natural and synthetic / semi-synthetic. Based on end user, the market is segmented into hospitals & clinics, pharmaceutical companies, food & beverage manufacturers, research institutes and others. Based on distribution channel, the market is segmented into online sales and offline sales. Based on region, the market is segmented into North America, Europe, Asia Pacific, Latin America and Middle East & Africa.
As per quinine market outlook, quinine sulfate has become the predominant active component used within most accepted therapeutic and preparation practices throughout the quinine industry. Therefore, it represents the one segment of the quinine marketplace with stable, predictable performance histories that require little to no additional risk when procuringconservative manufacturers and formulators. The established relationship of trust between manufacturers and formulators facilitates a shorter cycle end to product development, streamlined compliance through regulatory compliance on the speed of finalizing the necessary filing, and longer-lasting sales commitments that support continued leadership within the industry.
As per quinine market forecast, quinine hydrochloride is the most vibrant product types currently emerging due to increased solubility and flexibility in preparation to meet the needs of newer dosage forms. Increased interest in both injectable liquid preparations as well as reformulations from ‘legacy’ products, coupled with manufacturing efficiency increases have spurred this product type’s uptake and opened multiple new therapeutic and commercial channels on which to add to overall quinine market growth.
The natural segment is leading the industry with large quinine market share because suppliers of quinine who produce naturally have built long-term relationships, have a good reputation for being compatible with the two most sensitive industries. Manufacturers favor natural-sourced feedstock, leading to premium price positioning and consistent purchase volumes. The resulting supplier and purchaser consistency will create a reduction in regulatory interference in the finished product and continue to encourage the investment of sustainable sourcing practices.
As per quinine market analysis, synthetic or semi-synthetic products are exhibiting the greatest rate of growth due to the introduction of innovative production techniques that allow for larger quantities and more reliable quality. Increased ability to control the impurity profile and have predictable batch-to-batch reproducibility produces a more cost-efficient product and encourages rapid production for new product forms and uses, which opens new markets and encourages future investments.
To get detailed segments analysis, Request a Free Sample Report
As per quinine market regional outlook, the Asia-Pacific region has a mixture of manufacturing power, integrated supply chain systems and pharmaceutical expertise to create a dominant position in the quinine market. The region's manufacturing capabilities provide established clusters that can produce quinine at a high volume and through high-quality processes. The current regulatory framework in the Asia-Pacific is sophisticated and provides a reliable and efficient process for obtaining marketing approval and marketing access for quinine products. The close cooperation of manufacturers, research institutions, and contract manufacturing companies has accelerated the development of formulations to meet clinical needs. The logistics hubs in the region and the development of strategic trading relationships provide increased responsiveness for the distribution of product to the adjacent markets.
Japan quinine market is anchored by its advanced pharmaceutical manufacturing capabilities, strong quality and regulatory standards. The ability of Japanese companies to perform their own research and development to provide specialized formulations and evaluate them clinically is supported by a strong regulatory process allowing for the marketing of refined products. The relationship between Japanese manufacturers and their international suppliers and local contract manufacturers allows for the customized supply of product to meet the demands of individual customers.
South Korea's quinine market is built on a strong chemical and biotechnological manufacturing base with a strong ability to produce at scale and through contract manufacturing. The industry is focused on implementing new technologies and optimizing its production processes to improve manufacturing efficiency and quality control. South Korea's strong export orientation and its strong integration with the global supply chain allow it to successfully access international markets. The collaboration among South Korean manufacturers and academic institutions increases the quantity and frequency of innovative formulations.
As per global quinine market regional forecast, the fast growth of Europe highlights that there is a focus on having rules and laws in place that help with research and healthcare services to create new medicines for people who need medical help. Having rules and laws in place that follow the same standards allows for manufacturers to sell their products in many different countries. The fast pace of changing medicines requires that there are many different places to do research and create new medicines. It also takes less time to make changes to medicines in Europe because there are so many research institutions and businesses working together to create new forms of quinine. Other parts of Europe provide significant public and private money to purchase and use quinine and allow for companies to meet the demand for products in a short amount of time. Manufacturers are also creating large amounts of product within the same country where customers can purchase their products and begin making sure that they are following the strict rules for quality control and tracking.
The Germany quinine market is currently expanding and growing quickly due to a strong pharmaceutical industry and a focus on quality. The German pharmacy industry and hospital purchases are entirely focused on purchasing supplies that can be traced and meet specifications. Manufacturers and research organizations work together to develop and manufacture new forms of quinine that meet strict requirements for traceability and quality control.
The quinine market in the UK has a well-developed regulatory framework and well-established distribution channels enabling smooth entry into the market. The use of centralized purchasing arrangements along with specialized clinics results in stable demand for high-quality active substances and quality finished formulations. Contract research organizations (CRO) assist in creating a cooperative environment for developing new products. Partnerships between CROs, clinical researchers, and procurement agencies provide a strong foundation for the UK to be a top regional source of quinine.
The quinine market in France is characterized by an increase in interest from clinical researchers, public health programs supporting greater use of finished formulations. Investments being made to improve the quality of locally manufactured quinine as well as expand current national production have highlighted the importance of having reliable and traceable sources of supply. Pharmacological companies, in cooperative arrangements with university-based medical researchers, are working together to develop new finished formulations of quinine. France is in the process of addressing regulatory issues, and changes to purchasing practices are helping establish the country as a significant regional provider and user of quinine.
As per global quinine market regional outlook, North America has solidified its stance through the establishment of initiatives that emphasize the importance of security of supply through localized manufacturing capabilities, and through a regulatory regime that prioritizes alignment between regulatory pathways and the relevant industry best practices. Investment in contract manufacturing and technology adoption will provide for efficient scaling of quinine production, while establishment of sound quality operations will provide assurance. Collaboration of strategic partnerships between manufacturers, research institutions and procurement agencies to create unique formulations and to support access to clinical applications at an accelerated pace.
Through US quinine, strong manufacturing capability driven by investments and regulatory environment focused on quality and traceability will influence the US quinine market. Manufacturers and pharmaceutical contract manufacturers collaborate on the development and scaling of formulations to address clinical needs. Devise strategic approaches to procurement in conjunction with foreign sourcing partners to enhance secure sourcing; and advanced logistics allow broad distribution of products. Ongoing dialogue between industry and regulatory stakeholders facilitates consistent access to the market, and consistent levels of quality.
As per global quinine industry analysis, Canada market is focused on securing supply resilience, ensuring quality assurance, and creating consistency between the regulatory systems of Canada and the United States to facilitate market entry and cross-border distribution. Domestic and contracted manufacturers focus on compliance and traceability, while partnerships with foreign suppliers create flexibility in sourcing options. Local clinical research facilities and provincial procurement offices are both factors that contribute to the demand for high-quality formulations.
To know more about the market opportunities by region and country, click here to
Buy The Complete Report
Increased Demand for Antimalarials
Reduced reliance on traditional antimalarial products such as chloroquine (the basis for current treatments), has given way to increased reliance as a definitive choice of therapy on proven antimalarial therapies such as quinine, due to both the persistent proliferation of malaria in endemic regions and the renewed emphasis on achieving effective therapeutic outcomes created by the availability of antimalarial therapies. This emphasis has resulted in the prioritization by national health care systems and providers, on maintaining a reliable supply chain and utilizing established dosing schedules when administrating antimalarial therapy. This emphasis has also created an ongoing predictable demand for quinine and prompted manufacturers to make production commitments and invest in quality control systems. By doing so, manufacturing/suppliers will have an increased assurance of stable market conditions and, therefore, will be able to support sustained availability of quinine in clinical and hospital settings.
Innovation in Formulation and Delivery
Improvements in formulation research and delivery technology have created greater tolerability of quinine as well as ease of administering quinine, enhancing clinical utility and acceptability among clinicians providing treatment for patients with malaria. Improvements in the development of dosage forms characterized as patient-friendly and being more inherently stable have facilitated the ability to include these dosage forms in established treatment guidelines thereby reducing barriers to the use of quinine for the treatment of patients with malaria in a variety of healthcare settings. As a result of these improvements, manufacturers are motivated to expand production and develop more efficient methods of supplying their products to this market, thereby enhancing the idea of responsiveness to market needs. The cumulative effect of the above is expanded acceptance of quinine as a therapeutic alternative to traditional antimalarial agents resulting in a gradual expansion of the overall market and evidence of improved adherence to therapy by patients and improved confidence in the ability of healthcare providers to provide treatment to patients with malaria.
Side Effect Profile and Tolerability
The potential for adverse effects associated with quinine will often prevent it from being preferred in the clinic. For locations where a safer or better tolerated therapeutic option may exist, physicians will frequently look to alternative therapies and will be less likely to use quinine. Providers of healthcare programs that engage in public procurement may be hesitant to use quinine due to the risk of an adverse event occurring from its use. This uncertainty about potential risks will generally lead to reducing the number of times quinine will be prescribed. The focus on safety will hinder the demand for quinine in markets where there is a high sensitivity toward issues of safety; therefore, manufacturers and distributors will experience downward pressure on volume and penetration in these markets. Thus, the reluctance to use quinine because of safety concerns limits the potential for wider therapeutic use should therapeutic effectiveness exist.
Challenges in Sourcing Raw Materials
Quinine's reliance upon very specific plants for its source of raw material and on complicated methods to extract the raw material from the source creates challenges that put quinine at risk of not being available in sufficient quantities. As a result, there could be disruptions in continuous production of quinine, creating disincentives for investment in the production and distribution of quinine. Variations in harvest, processing ability, or procurement will put into question the reliability of supply, while creating an environment of caution for supply and demand parties in making a long-term commitment. In addition, if purchasers are unsure there will be a supply available, they may look to alternative sources or substitute products for quinine, resulting in a reduced concentration of demand for quinine. These supply vulnerabilities could limit the growth of this market segment due to increased perceptions of operational risk, resulting in reluctance of key stakeholders to grow production or develop stockpiling strategies.
Request Free Customization of this report to help us to meet your business objectives.
The competitive landscape for the sourcing and production of sustainable cinchona (the source of quinine) used in tonic water (the beverage) is dominated by both vertically integrated businesses and specialty ingredient manufacturers, each competing on sourcing, processing scale and beverage partnerships. The recent consolidation global quinine market trend resulting from significant mergers and acquisitions and strategic investment deals (e.g., Alphatalents Africa acquiring PHARMAKINA; Mirova Funding Aqre Group) continues this trend toward consolidation and scale. Companies are also using partnerships with smallholder networks, expanding agroforestry systems, upgrading processing capacity to secure the supply of quality quinine and differentiate themselves through sustainability and quality.
Formulation Innovation and Specialty Use: Novel formulations for niche therapeutic indications and changing product portfolios are creating pressure on manufacturers to develop various options for effective and economical product delivery, targeting specific therapeutic indications through combinations of medicines in single delivery systems (i.e.combination therapies) or developing alternatives to traditional dosing formats. Partnerships between manufacturers and investigators/ pharmacists will accelerate the development of alternative products, as well as supporting the creation of higher value segments in established markets. Government incentives and pathways to market access will support differentiated products that meet existing clinical need, while marketing efforts shift from demonstrating clinician value/clinical data towards demonstrating real-world utility through clinician participation in product development. In addition, these efforts will support research, development, and brand recognition through premium access to product channels and brand extensions.
Manufacturing and Regional Diversification: A focus on local manufacturing and modernization by manufacturers and governments is in direct response to the need for improved supply chain resiliency, compliance with local regulations, and responsiveness to the specific regional needs of patient populations. Investment in facility upgrades, technical exchange agreements, and contract manufacturing relationships facilitate rapid entry into new regions with customized product specifications, further enhancing regulatory compliance and coordination among stakeholders, and supporting public health objectives. Through pursuing distributed production capacity models, market participants will be able to realise stronger supply chain continuity, more efficient regulatory interactions, and enhanced customer confidence, developing the basis for competitive advantages in both established and emerging regional markets.
SkyQuest’s ABIRAW (Advanced Business Intelligence, Research & Analysis Wing) is our Business Information Services team that Collects, Collates, Correlates, and Analyses the Data collected by means of Primary Exploratory Research backed by robust Secondary Desk research.
As per SkyQuest analysis, the global quinine industry is driven primarily by rising therapeutic demand as an antimalarial amid growing resistance to first-line drugs, while a second driver is expanding non-therapeutic demand from premium beverages and formulation innovation. A key driver is therefore antimalarial procurement in endemic regions that stabilizes volumes and investment. A restraint is persistent raw material sourcing challenges tied to cinchona supply variability and climate risks that threaten consistent extraction. The dominating region is Asia Pacific due to integrated manufacturing and supply chains, and the dominating segment is Quinine Sulfate, favored for stability and established therapeutic formulations.
| Report Metric | Details |
|---|---|
| Market size value in 2024 | USD 2.1 Billion |
| Market size value in 2033 | USD 3.49 Billion |
| Growth Rate | 5.8% |
| Base year | 2024 |
| Forecast period | (2026-2033) |
| Forecast Unit (Value) | USD Billion |
| Segments covered |
|
| Regions covered | North America (US, Canada), Europe (Germany, France, United Kingdom, Italy, Spain, Rest of Europe), Asia Pacific (China, India, Japan, Rest of Asia-Pacific), Latin America (Brazil, Rest of Latin America), Middle East & Africa (South Africa, GCC Countries, Rest of MEA) |
| Companies covered |
|
| Customization scope | Free report customization with purchase. Customization includes:-
|
To get a free trial access to our platform which is a one stop solution for all your data requirements for quicker decision making. This platform allows you to compare markets, competitors who are prominent in the market, and mega trends that are influencing the dynamics in the market. Also, get access to detailed SkyQuest exclusive matrix.
Table Of Content
Executive Summary
Market overview
Parent Market Analysis
Market overview
Market size
KEY MARKET INSIGHTS
COVID IMPACT
MARKET DYNAMICS & OUTLOOK
Market Size by Region
KEY COMPANY PROFILES
Methodology
For the Quinine Market, our research methodology involved a mixture of primary and secondary data sources. Key steps involved in the research process are listed below:
1. Information Procurement: This stage involved the procurement of Market data or related information via primary and secondary sources. The various secondary sources used included various company websites, annual reports, trade databases, and paid databases such as Hoover's, Bloomberg Business, Factiva, and Avention. Our team did 45 primary interactions Globally which included several stakeholders such as manufacturers, customers, key opinion leaders, etc. Overall, information procurement was one of the most extensive stages in our research process.
2. Information Analysis: This step involved triangulation of data through bottom-up and top-down approaches to estimate and validate the total size and future estimate of the Quinine Market.
3. Report Formulation: The final step entailed the placement of data points in appropriate Market spaces in an attempt to deduce viable conclusions.
4. Validation & Publishing: Validation is the most important step in the process. Validation & re-validation via an intricately designed process helped us finalize data points to be used for final calculations. The final Market estimates and forecasts were then aligned and sent to our panel of industry experts for validation of data. Once the validation was done the report was sent to our Quality Assurance team to ensure adherence to style guides, consistency & design.
Analyst Support
Customization Options
With the given market data, our dedicated team of analysts can offer you the following customization options are available for the Quinine Market:
Product Analysis: Product matrix, which offers a detailed comparison of the product portfolio of companies.
Regional Analysis: Further analysis of the Quinine Market for additional countries.
Competitive Analysis: Detailed analysis and profiling of additional Market players & comparative analysis of competitive products.
Go to Market Strategy: Find the high-growth channels to invest your marketing efforts and increase your customer base.
Innovation Mapping: Identify racial solutions and innovation, connected to deep ecosystems of innovators, start-ups, academics, and strategic partners.
Category Intelligence: Customized intelligence that is relevant to their supply Markets will enable them to make smarter sourcing decisions and improve their category management.
Public Company Transcript Analysis: To improve the investment performance by generating new alpha and making better-informed decisions.
Social Media Listening: To analyze the conversations and trends happening not just around your brand, but around your industry as a whole, and use those insights to make better Marketing decisions.
REQUEST FOR SAMPLE
 REQUEST FREE CUSTOMIZATION
Global Quinine Market size was valued at USD 2.1 Billion in 2024 and is poised to grow from USD 2.22 Billion in 2025 to USD 3.49 Billion by 2033, growing at a CAGR of 5.8% during the forecast period (2026-2033).
Competitive landscape is shaped by vertical integrators and ingredient specialists competing on sustainable cinchona sourcing, processing scale and beverage partnerships. Recent M&A and strategic investments, for example Alphatalents Africa’s acquisition of PHARMAKINA and Mirova’s funding to Aqre Group, drive consolidation. Firms deploy partnerships with smallholder networks, agroforestry expansion and processing capacity upgrades to secure quinine supply and differentiate through quality and sustainability. 'Bristol-Myers Squibb', 'Bayer AG', 'Sanofi', 'Teva Pharmaceutical Industries Ltd.', 'Mylan N.V.', 'Hikma Pharmaceuticals PLC', 'AstraZeneca', 'GlaxoSmithKline', 'Novartis AG', 'Merck & Co., Inc.', 'Johnson & Johnson', 'Pfizer Inc.', 'Eli Lilly and Company', 'Amgen Inc.', 'Gilead Sciences, Inc.', 'Takeda Pharmaceutical Company Limited', 'UCB S.A.', 'Astellas Pharma Inc.', 'Sumitomo Dainippon Pharma Co., Ltd.', 'Daiichi Sankyo Company, Limited'
In many endemic regions, persistent incidence of malaria and renewed public health emphasis on effective treatment have increased reliance on proven antimalarials, directly supporting demand for quinine as a critical therapeutic option. Healthcare providers and national programs prioritize reliable supply chains and established dosing regimens, which encourages sustained procurement and manufacturing commitments. This predictable need prompts pharmaceutical suppliers to maintain production capacity and invest in quality control, reinforcing market stability and enabling continued availability of quinine across clinical and hospital settings.
Formulation Innovation And Specialty Use: Demand for novel formulations and niche therapeutic applications is reshaping product portfolios, prompting manufacturers to develop targeted delivery systems, combination therapies and dosing formats. Strategic alliances with clinical researchers and pharmacies accelerate repositioning efforts and create higher-value segments within established markets. Regulatory incentives and market access pathways favor differentiated products that address unmet clinical needs, while marketing emphasis shifts toward demonstrating real-world utility and clinician engagement. This trend supports research, development and branding to capture premium channels and extend lifecycles.
Why does Asia Pacific Dominate the Global Quinine Market? |@12


Want to customize this report? This report can be personalized according to your needs. Our analysts and industry experts will work directly with you to understand your requirements and provide you with customized data in a short amount of time. We offer $1000 worth of FREE customization at the time of purchase.
Feedback From Our Clients


 USA (+1) 351-333-4748

