Product Analytics Market Size, Share, Growth Analysis, By Component (Solution and Services), By Deployment (Cloud and On-Premises), By Application (Design & Manufacturing, Sales & Marketing, and Consumer Engagement), By Region - Industry Forecast 2024-2031


Report ID: SQMIG45A2362 | Region: Global | Published Date: November, 2024
Pages: 168 |Tables: 0 |Figures: 0

Product Analytics Market Insights

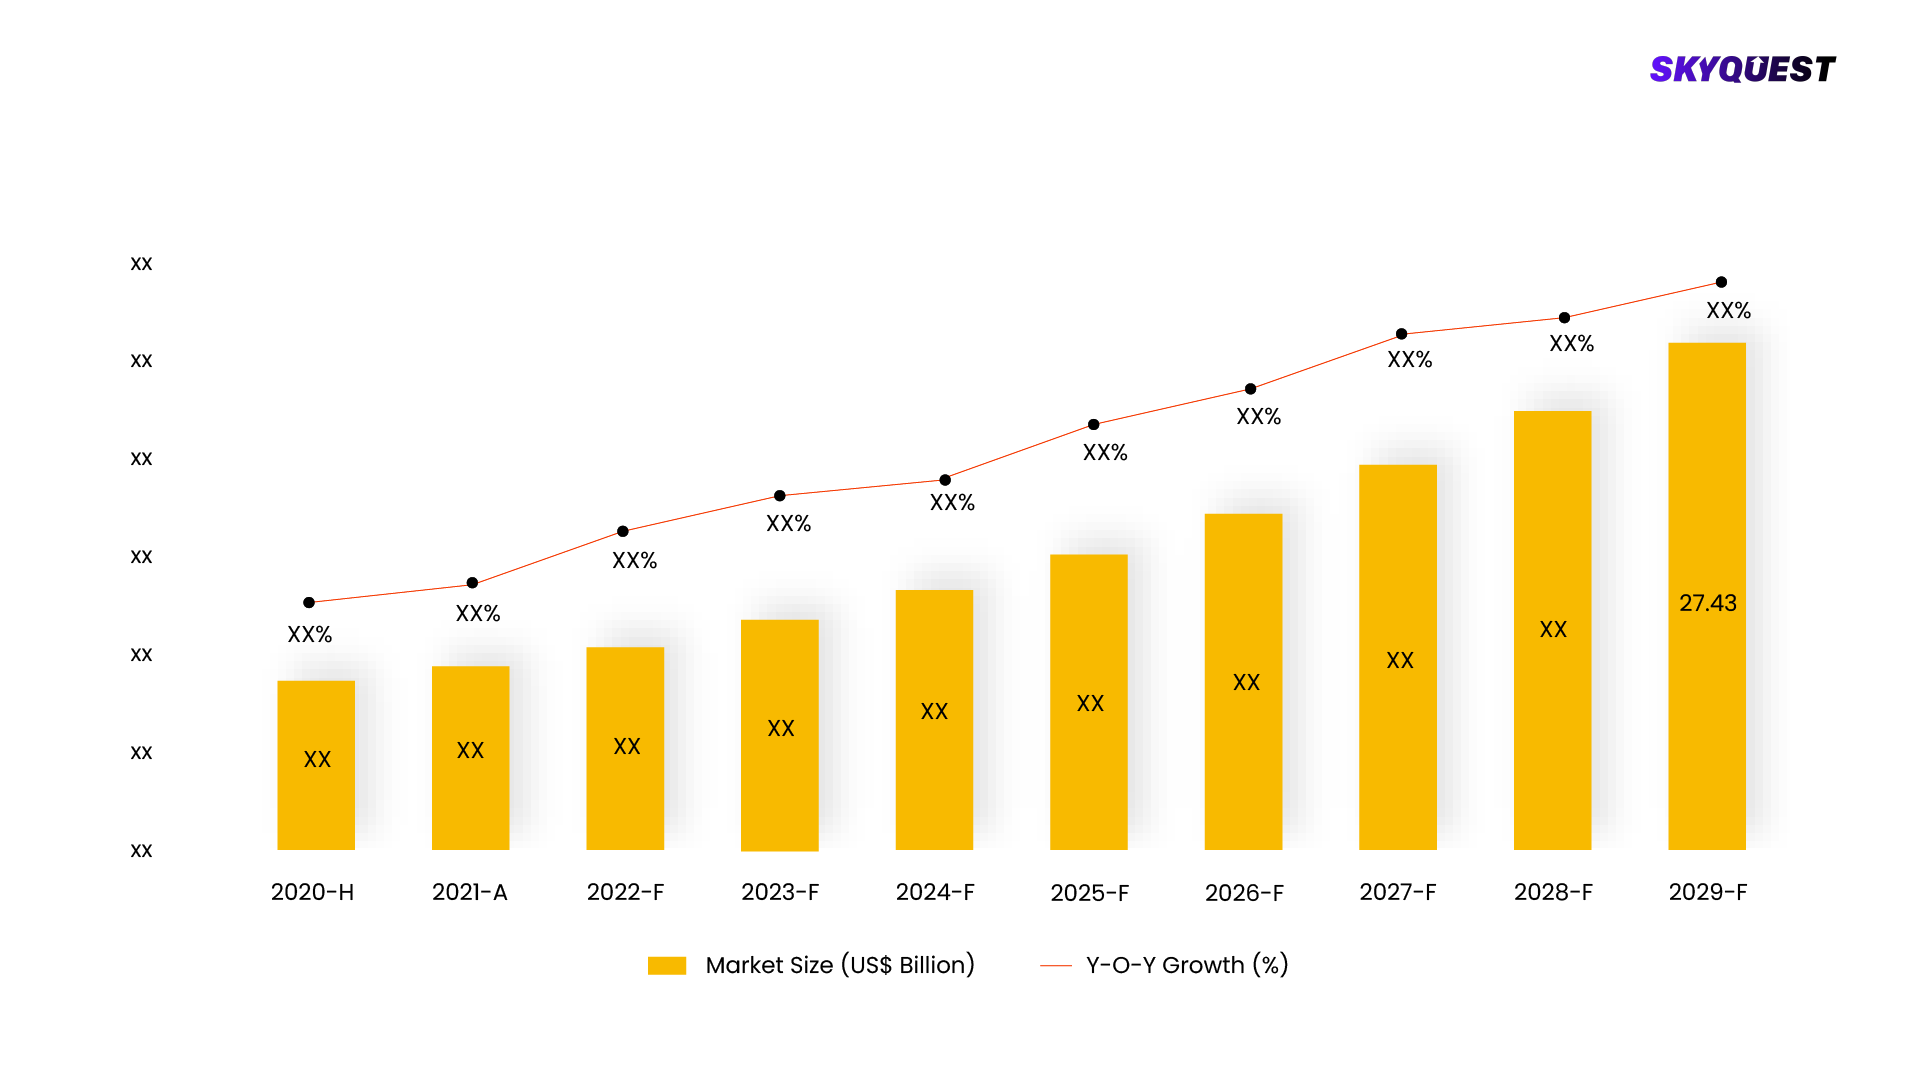
Global Product Analytics Market size was valued at USD 7.97 Billion in 2022 and is poised to grow from USD 9.23 Billion in 2023 to USD 25.94 Billion by 2031, growing at a CAGR of 15.9% in the forecast period (2024-2031).

Businesses are putting more and more effort into understanding customers’ buying behavior. Product analytic tools allow companies to follow user customer journeys, understand pain points which users face, and offer personalized experiences to users, which increases the satisfaction of customers and retention rate. First of all, user experience is the largest part of today’s digital environment. Therefore, product analytics will help to understand how users interact with the product, and which part of it can be improved. By improving customer journeys, businesses will result in higher user engagement and user satisfaction leading to higher conversion rates.

Additionally, simple data collection is not enough for companies today. One of the current trends is to be provided with advanced analytics solutions to learn more about one’s clients. Product analytics is a promising field today. With big data technologies, businesses have access to vast amounts of data. Product analytics platforms are able to process and adapt complex data, providing companies with valuable insights that could not have been obtained through traditional methods. Those solutions use machine learning and AI techniques to identify hidden patterns and trends and help companies in product development and marketing. In this way, the combination of big data with AI and machine learning affects the development of the product analytics market.

Market Snapshot - (2024-2031)

Global Market Size

Largest Segment

Fastest Growth

Growth Rate

CAGR

Global Product Analytics Market ($ Bn)
Country Share for North America Region (%)

To get more reports on the above market click here to Buy The Report

Product Analytics Market Segmental Analysis

Global Product Analytics Market is segmented into Component, Deployment, Application, and Region. Based on Component, the market is segmented into Solution and Services. Based on Deployment, the market is segmented into Cloud and On-Premises. Based on Application, the market is segmented into Design & Manufacturing, Sales & Marketing, and Consumer Engagement. Based on Region, the market is segmented into North America, Europe, Asia-Pacific, Latin America, and Middle East & Africa.

Analysis by Component

The solution segment is dominating the market in 2023, generating more than three fourths of the global revenue. Interactive dashboards and data visualization tools have gained importance. It helps the users in understanding complex data visualizations and identifies curial data. Presentation of data in a clear and visually appealing format is one of the major characteristics of product analytics solutions. The providers of product analytics solutions are increasingly adopting user adaptation to the solutions, by offering simple interfaces, easy-to-use features and comprehensive training programs. This ensures that customers will be able to exploit the full capabilities of the product analytics solution.

During the forecast period, the services segment is anticipated to have the highest growth in demand. Businesses make investments in product analytics to receive some valuable insights that could potentially increase their profits. That is why service providers could work with companies to define success metrics and to offer tracking ROI. Additionally, no one knows what will happen next in the product analytics field in terms of new technologies and best practices. Service providers train businesses to be aware of all new trends and ensure they have a future-proof data and analytics strategy.

Analysis by Deployment

The market revenue share of the cloud segment was the largest in 2023. The cloud-based solution does not require expensive on-premises hardware and software. Businesses only pay for the resources that they use, which provides a cost-effective solution for companies of any size but mostly for startups and small and medium-sized enterprises. At the same time, the solution may be accessed remotely from any place where an Internet connection is available. It allows teams to collaborate on the administration of data from various locations, thus fostering communication and faster decision making.

The on-premises segment is expected to witness a substantial CAGR over the forecast period. On-premises solutions provide businesses with a higher level of control over where data is stored and how it can be accessed. For businesses that handle sensitive customer information, this is essential. At the same time, some regulations stipulate that data must be stored within a certain local area. On-premises solutions enable businesses to retain their data either on their company’s premises or in a proprietary cloud in that local area.

To get detailed analysis on other segments, Request For Free Sample Report

Product Analytics Market Regional Insights

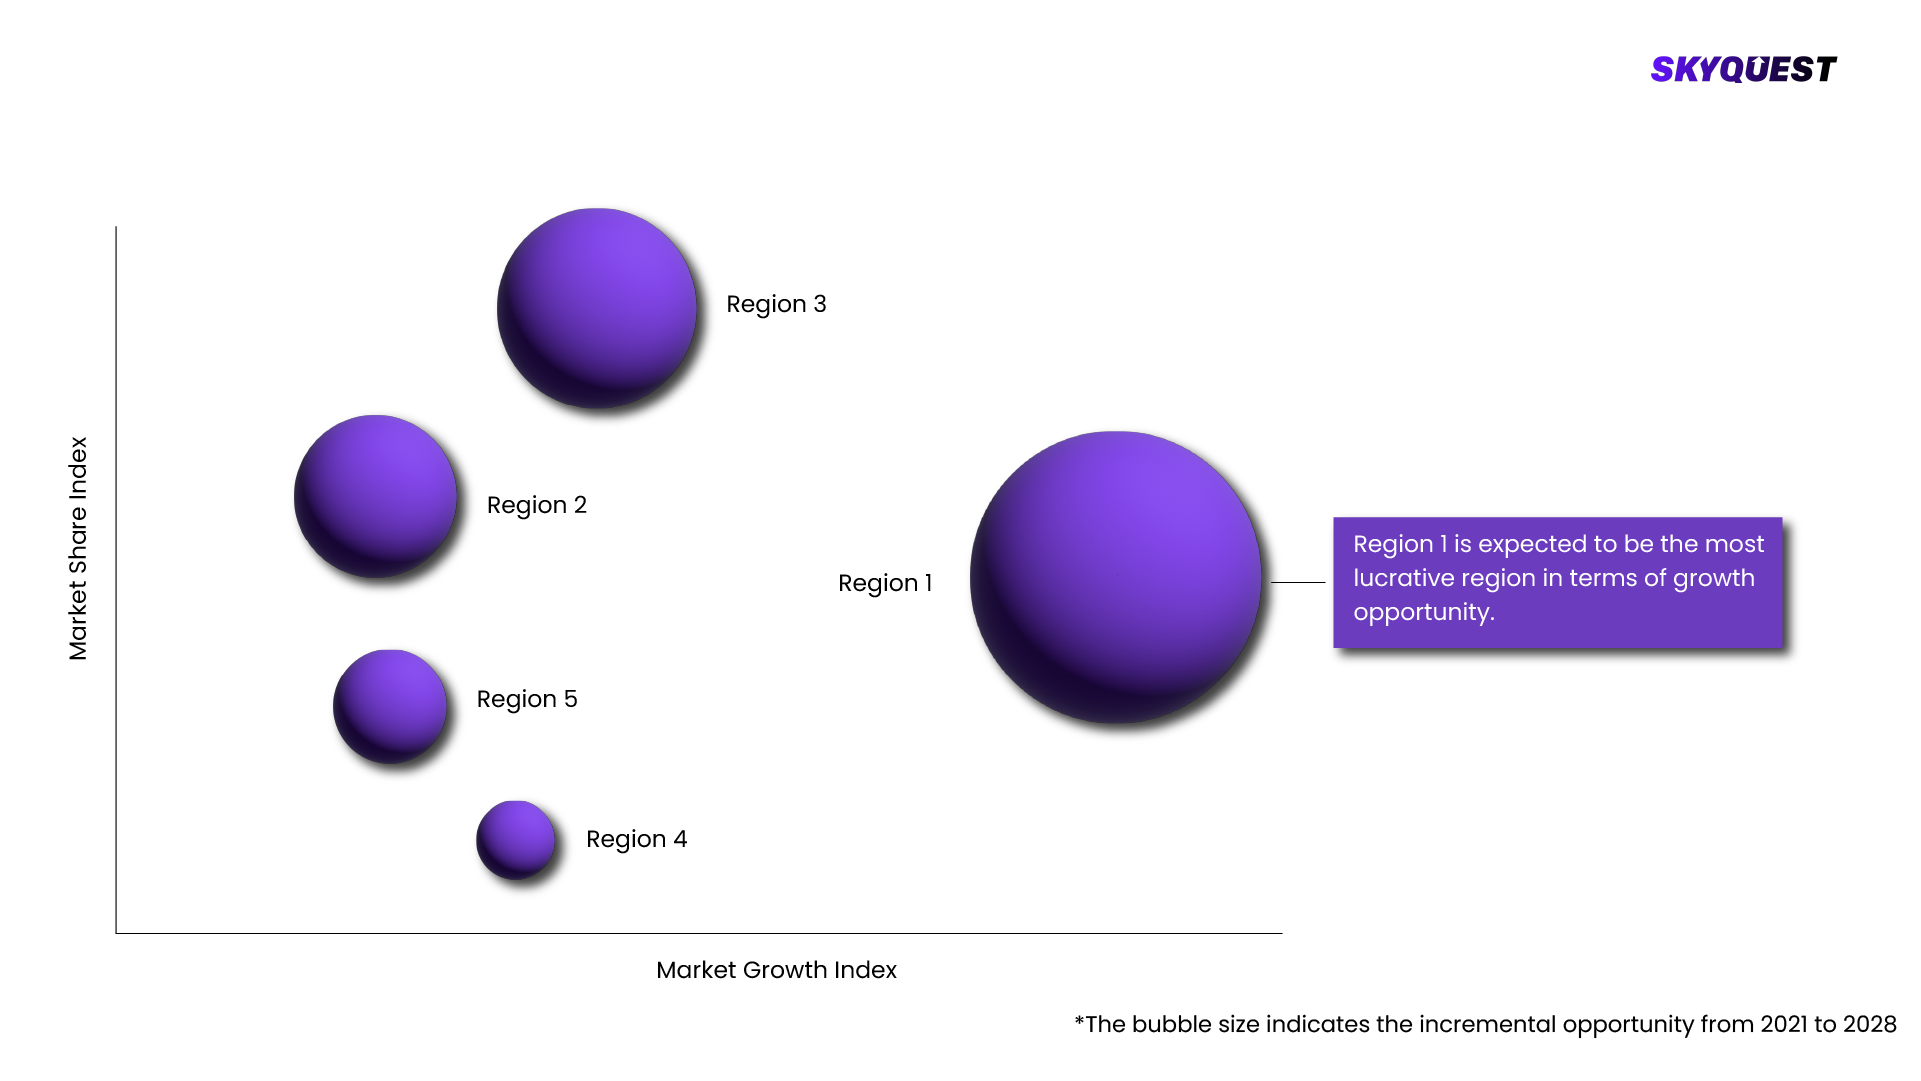
North America has dominated the market revenue share in 2023. High internet penetration and the burgeoning e-commerce sector in North America are heavily dependent on product analytics to study and understand customer behavior, personalize the shopping experience, as well as optimize marketing strategies. The financial services sector in North America seems to be leveraging product analytics to enhance fraud detection, enabling the personalization of financial products, and enhancing customer services experience. The US is home to a highly advanced technology infrastructure, including widespread internet access, smartphone usage, and increasing connectivity across devices. Moreover, this infrastructure generates massive volumes of data, thereby driving the demand for product analytics solutions.

The product analytics market in Asia Pacific is projected to grow at the highest CAGR over the forecast period. The APAC region is currently undergoing a digital revolution as internet penetration rates grow and more people adopt smartphones. The use of these devices results in the production of vast amounts of data, driving the demand for solutions such as product analytics. In addition, it should be noted that the e-commerce sector in APAC is currently booming, with China and India, among other countries, leading the way. Product analytics offers e-commerce companies in APAC an opportunity to personalize the shopping experience and optimize marketing campaigns, as well as increase conversion rates.

Global Product Analytics Market By Geography
  • Largest
  • Fastest

To know more about the market opportunities by region and country, click here to
Buy The Complete Report

Product Analytics Market Dynamics

Drivers

Growing Demand for Customer Behavior Management

  • The use and demand for product recommendation engines, which offer personalized service to the end-users, are growing day by day. Through recommendations, these tools help organizations to optimize customer behavior and service resulting in the maximum potential of marketing efforts. The end-user’s interest expressed by their history and their behavior enables the product recommendation tool to automatically pair that behavior with the right recommendation. Hence product analytics plays a key role in analyzing customer behavior.

Increasing Demand for Cloud-Based Solutions

  • Cloud-based analytics is beneficial for enterprises in working with the data by extracting a huge amount of data and displaying it throughout the available web browser. The value of product innovation facilitation offered by product analytics providers has a positive influence on the enterprise business value. Moreover, this is particularly true for market leaders. Moreover, cloud analytics platforms are agile enough for customization to the peculiarities of the enterprise.

Restraints

Data Security and Privacy Concerns

  • Artificial intelligence and machine learning have high exposure to malicious attacks. Nevertheless, cyber hackers are adopting AI and ML at a higher rate than security leaders. Therefore, attackers’ use of the tools in businesses to affect the data and asset of a business would act as a restraining factor to the market. Companies that use this service would be insecure as the data would be leaking out on the internet as unauthorized users could easily go into business’ systems.

Request Free Customization of this report to help us to meet your business objectives.

Product Analytics Market Competitive Landscape

Competition in product analytics is driven by the endeavors of companies playing in the space to widen their customer base and surpass their competitors. As a result, many companies adopt a range of strategic moves such as partnerships, mergers & acquisitions, product/ technology development, and collaborations. It is not feasible for companies to continue to dominate the product analytics market for an extended period by relying only on a singular product. This case is obvious as a consequence of the rapid evolution of technology and the shift in customer expectations. In the process of rapidly shifting business environment to succeed, several industrial and retail companies now implement different business processes such as the convergence of technology.

Top Player’s Company Profile 

  • Amplitude Inc. (U.S.)
  • Heap, Inc. (Contentsquare) (U.S.)
  • Mixpanel (U.S.)
  • Pendo.io (U.S.)
  • Gainsight (U.S.)
  • Hevo Data, Inc. (U.S.)
  • Fullstory, Inc. (U.S.)
  • Looker Data Science, Inc. (U.S.)
  • Indicative Inc. (U.S.)
  • PostHog, Inc. (U.S.)

Recent Developments

  • In March 2024, Accenture announced the completion of the acquisition of GemSeek, which is a provider of customer experience analytics and helps understand the customers of global enterprises through insights, analytics, and AI-powered predictive models. The goal of the acquisition is to improve the customer experience and enhance the performance of the product.
  • In March 2024, Oracle launched Oracle Analytics Server. The update delivers more than a hundred new features that help every user to have a better analytics experience. The new capability allows customers to derive deeper insights from the data and make better decisions that can drive better business results.
  • In February 2024, Medallia Inc., announced the launch of four new solutions that help to personalize customer and employee experience. The solutions are Ask Athena, Intelligent Summaries, Smart Response, and Themes. Each of the four solutions are complimentary to the Medallia customers and will be available via the Medallia Experience Cloud.

Product Analytics Key Market Trends

  • Integration of AI and Advanced Analytics with Product Analytics: Product analytics software powered by artificial intelligence and advanced analytics helps organizations whose product teams analyze, visualize, and track customer behavior and engagement data. It also allows these organizations’ product managers and teams to assess and identify the impact of the digital experiences they create. The data is also critical in calibrating experiences for exceptional performance, diagnosing problems, and correlating customer behavior with long-term value.
  • Growing Demand for Product Analytics Software: The increasing demand for product analytics software from end-users, including e-commerce, customer technology and media will further augment the market growth. The increasing adoption of product analytics on digital platforms allows the use of insights into client experience, which are a few major factors that are further increasing market potential.

Product Analytics Market SkyQuest Analysis

SkyQuest’s ABIRAW (Advanced Business Intelligence, Research & Analysis Wing) is our Business Information Services team that Collects, Collates, Correlates, and Analyses the Data collected by means of Primary Exploratory Research backed by robust Secondary Desk research.

As per SkyQuest analysis, the market is undergoing an immense shift as customer demand and expectations are changing with the rapid digitalization. Companies are now forced to adapt the change of emerging technologies in their operational environment. Cloud services have emerged to be the superior technology in the room of change of technology processes. There will be an increase in the adoption of cloud-based services, with an exponentially high growth rate. Business leaders will need to make a shift towards a digital first approach to sustain their competencies to capture and hold consumers. Product analytics helps to make the right digital experience without taking any guess. It will give both customers and businesses a way to have a clear insight to properly optimize conversions, grow retention and maximize revenue.

Report Metric Details
Market size value in 2022 USD 7.97 Billion
Market size value in 2031 USD 25.94 Billion
Growth Rate 15.9%
Base year 2023
Forecast period (2024-2031)
Forecast Unit (Value) USD Billion
Segments covered
  • Component
    • Solution and Services
  • Deployment
    • Cloud and On-Premises
  • Application
    • Design & Manufacturing, Sales & Marketing, and Consumer Engagement
Regions covered North America (US, Canada), Europe (Germany, France, United Kingdom, Italy, Spain, Rest of Europe), Asia Pacific (China, India, Japan, Rest of Asia-Pacific), Latin America (Brazil, Rest of Latin America), Middle East & Africa (South Africa, GCC Countries, Rest of MEA)
Companies covered
  • Amplitude Inc. (U.S.)
  • Heap, Inc. (Contentsquare) (U.S.)
  • Mixpanel (U.S.)
  • Pendo.io (U.S.)
  • Gainsight (U.S.)
  • Hevo Data, Inc. (U.S.)
  • Fullstory, Inc. (U.S.)
  • Looker Data Science, Inc. (U.S.)
  • Indicative Inc. (U.S.)
  • PostHog, Inc. (U.S.)
Customization scope

Free report customization with purchase. Customization includes:-

  • Segments by type, application, etc
  • Company profile
  • Market dynamics & outlook
  • Region

To get a free trial access to our platform which is a one stop solution for all your data requirements for quicker decision making. This platform allows you to compare markets, competitors who are prominent in the market, and mega trends that are influencing the dynamics in the market. Also, get access to detailed SkyQuest exclusive matrix.

Buy The Complete Report to read the analyzed strategies adopted by the top vendors either to retain or gain market share

Table Of Content

Executive Summary

Market overview

  • Exhibit: Executive Summary – Chart on Market Overview
  • Exhibit: Executive Summary – Data Table on Market Overview
  • Exhibit: Executive Summary – Chart on Product Analytics Market Characteristics
  • Exhibit: Executive Summary – Chart on Market by Geography
  • Exhibit: Executive Summary – Chart on Market Segmentation
  • Exhibit: Executive Summary – Chart on Incremental Growth
  • Exhibit: Executive Summary – Data Table on Incremental Growth
  • Exhibit: Executive Summary – Chart on Vendor Market Positioning

Parent Market Analysis

Market overview

Market size

  • Market Dynamics
    • Exhibit: Impact analysis of DROC, 2021
      • Drivers
      • Opportunities
      • Restraints
      • Challenges
  • SWOT Analysis

KEY MARKET INSIGHTS

  • Technology Analysis
    • (Exhibit: Data Table: Name of technology and details)
  • Pricing Analysis
    • (Exhibit: Data Table: Name of technology and pricing details)
  • Supply Chain Analysis
    • (Exhibit: Detailed Supply Chain Presentation)
  • Value Chain Analysis
    • (Exhibit: Detailed Value Chain Presentation)
  • Ecosystem Of the Market
    • Exhibit: Parent Market Ecosystem Market Analysis
    • Exhibit: Market Characteristics of Parent Market
  • IP Analysis
    • (Exhibit: Data Table: Name of product/technology, patents filed, inventor/company name, acquiring firm)
  • Trade Analysis
    • (Exhibit: Data Table: Import and Export data details)
  • Startup Analysis
    • (Exhibit: Data Table: Emerging startups details)
  • Raw Material Analysis
    • (Exhibit: Data Table: Mapping of key raw materials)
  • Innovation Matrix
    • (Exhibit: Positioning Matrix: Mapping of new and existing technologies)
  • Pipeline product Analysis
    • (Exhibit: Data Table: Name of companies and pipeline products, regional mapping)
  • Macroeconomic Indicators

COVID IMPACT

  • Introduction
  • Impact On Economy—scenario Assessment
    • Exhibit: Data on GDP - Year-over-year growth 2016-2022 (%)
  • Revised Market Size
    • Exhibit: Data Table on Product Analytics Market size and forecast 2021-2027 ($ million)
  • Impact Of COVID On Key Segments
    • Exhibit: Data Table on Segment Market size and forecast 2021-2027 ($ million)
  • COVID Strategies By Company
    • Exhibit: Analysis on key strategies adopted by companies

MARKET DYNAMICS & OUTLOOK

  • Market Dynamics
    • Exhibit: Impact analysis of DROC, 2021
      • Drivers
      • Opportunities
      • Restraints
      • Challenges
  • Regulatory Landscape
    • Exhibit: Data Table on regulation from different region
  • SWOT Analysis
  • Porters Analysis
    • Competitive rivalry
      • Exhibit: Competitive rivalry Impact of key factors, 2021
    • Threat of substitute products
      • Exhibit: Threat of Substitute Products Impact of key factors, 2021
    • Bargaining power of buyers
      • Exhibit: buyers bargaining power Impact of key factors, 2021
    • Threat of new entrants
      • Exhibit: Threat of new entrants Impact of key factors, 2021
    • Bargaining power of suppliers
      • Exhibit: Threat of suppliers bargaining power Impact of key factors, 2021
  • Skyquest special insights on future disruptions
    • Political Impact
    • Economic impact
    • Social Impact
    • Technical Impact
    • Environmental Impact
    • Legal Impact

Market Size by Region

  • Chart on Market share by geography 2021-2027 (%)
  • Data Table on Market share by geography 2021-2027(%)
  • North America
    • Chart on Market share by country 2021-2027 (%)
    • Data Table on Market share by country 2021-2027(%)
    • USA
      • Exhibit: Chart on Market share 2021-2027 (%)
      • Exhibit: Market size and forecast 2021-2027 ($ million)
    • Canada
      • Exhibit: Chart on Market share 2021-2027 (%)
      • Exhibit: Market size and forecast 2021-2027 ($ million)
  • Europe
    • Chart on Market share by country 2021-2027 (%)
    • Data Table on Market share by country 2021-2027(%)
    • Germany
      • Exhibit: Chart on Market share 2021-2027 (%)
      • Exhibit: Market size and forecast 2021-2027 ($ million)
    • Spain
      • Exhibit: Chart on Market share 2021-2027 (%)
      • Exhibit: Market size and forecast 2021-2027 ($ million)
    • France
      • Exhibit: Chart on Market share 2021-2027 (%)
      • Exhibit: Market size and forecast 2021-2027 ($ million)
    • UK
      • Exhibit: Chart on Market share 2021-2027 (%)
      • Exhibit: Market size and forecast 2021-2027 ($ million)
    • Rest of Europe
      • Exhibit: Chart on Market share 2021-2027 (%)
      • Exhibit: Market size and forecast 2021-2027 ($ million)
  • Asia Pacific
    • Chart on Market share by country 2021-2027 (%)
    • Data Table on Market share by country 2021-2027(%)
    • China
      • Exhibit: Chart on Market share 2021-2027 (%)
      • Exhibit: Market size and forecast 2021-2027 ($ million)
    • India
      • Exhibit: Chart on Market share 2021-2027 (%)
      • Exhibit: Market size and forecast 2021-2027 ($ million)
    • Japan
      • Exhibit: Chart on Market share 2021-2027 (%)
      • Exhibit: Market size and forecast 2021-2027 ($ million)
    • South Korea
      • Exhibit: Chart on Market share 2021-2027 (%)
      • Exhibit: Market size and forecast 2021-2027 ($ million)
    • Rest of Asia Pacific
      • Exhibit: Chart on Market share 2021-2027 (%)
      • Exhibit: Market size and forecast 2021-2027 ($ million)
  • Latin America
    • Chart on Market share by country 2021-2027 (%)
    • Data Table on Market share by country 2021-2027(%)
    • Brazil
      • Exhibit: Chart on Market share 2021-2027 (%)
      • Exhibit: Market size and forecast 2021-2027 ($ million)
    • Rest of South America
      • Exhibit: Chart on Market share 2021-2027 (%)
      • Exhibit: Market size and forecast 2021-2027 ($ million)
  • Middle East & Africa (MEA)
    • Chart on Market share by country 2021-2027 (%)
    • Data Table on Market share by country 2021-2027(%)
    • GCC Countries
      • Exhibit: Chart on Market share 2021-2027 (%)
      • Exhibit: Market size and forecast 2021-2027 ($ million)
    • South Africa
      • Exhibit: Chart on Market share 2021-2027 (%)
      • Exhibit: Market size and forecast 2021-2027 ($ million)
    • Rest of MEA
      • Exhibit: Chart on Market share 2021-2027 (%)
      • Exhibit: Market size and forecast 2021-2027 ($ million)

KEY COMPANY PROFILES

  • Competitive Landscape
    • Total number of companies covered
      • Exhibit: companies covered in the report, 2021
    • Top companies market positioning
      • Exhibit: company positioning matrix, 2021
    • Top companies market Share
      • Exhibit: Pie chart analysis on company market share, 2021(%)

Methodology

For the Product Analytics Market, our research methodology involved a mixture of primary and secondary data sources. Key steps involved in the research process are listed below:

1. Information Procurement: This stage involved the procurement of Market data or related information via primary and secondary sources. The various secondary sources used included various company websites, annual reports, trade databases, and paid databases such as Hoover's, Bloomberg Business, Factiva, and Avention. Our team did 45 primary interactions Globally which included several stakeholders such as manufacturers, customers, key opinion leaders, etc. Overall, information procurement was one of the most extensive stages in our research process.

2. Information Analysis: This step involved triangulation of data through bottom-up and top-down approaches to estimate and validate the total size and future estimate of the Product Analytics Market.

3. Report Formulation: The final step entailed the placement of data points in appropriate Market spaces in an attempt to deduce viable conclusions.

4. Validation & Publishing: Validation is the most important step in the process. Validation & re-validation via an intricately designed process helped us finalize data points to be used for final calculations. The final Market estimates and forecasts were then aligned and sent to our panel of industry experts for validation of data. Once the validation was done the report was sent to our Quality Assurance team to ensure adherence to style guides, consistency & design.

Analyst Support

Customization Options

With the given market data, our dedicated team of analysts can offer you the following customization options are available for the Product Analytics Market:

Product Analysis: Product matrix, which offers a detailed comparison of the product portfolio of companies.

Regional Analysis: Further analysis of the Product Analytics Market for additional countries.

Competitive Analysis: Detailed analysis and profiling of additional Market players & comparative analysis of competitive products.

Go to Market Strategy: Find the high-growth channels to invest your marketing efforts and increase your customer base.

Innovation Mapping: Identify racial solutions and innovation, connected to deep ecosystems of innovators, start-ups, academics, and strategic partners.

Category Intelligence: Customized intelligence that is relevant to their supply Markets will enable them to make smarter sourcing decisions and improve their category management.

Public Company Transcript Analysis: To improve the investment performance by generating new alpha and making better-informed decisions.

Social Media Listening: To analyze the conversations and trends happening not just around your brand, but around your industry as a whole, and use those insights to make better Marketing decisions.

$5,300
BUY NOW

REQUEST FOR SAMPLE

Want to customize this report?
REQUEST FREE CUSTOMIZATION

FAQs

Global Product Analytics Market size was valued at USD 7.97 Billion in 2022 and is poised to grow from USD 9.23 Billion in 2023 to USD 25.94 Billion by 2031, growing at a CAGR of 15.9% in the forecast period (2024-2031).

Competition in product analytics is driven by the endeavors of companies playing in the space to widen their customer base and surpass their competitors. As a result, many companies adopt a range of strategic moves such as partnerships, mergers & acquisitions, product/ technology development, and collaborations. It is not feasible for companies to continue to dominate the product analytics market for an extended period by relying only on a singular product. This case is obvious as a consequence of the rapid evolution of technology and the shift in customer expectations. In the process of rapidly shifting business environment to succeed, several industrial and retail companies now implement different business processes such as the convergence of technology. 'Amplitude Inc. (U.S.)', 'Heap, Inc. (Contentsquare) (U.S.)', 'Mixpanel (U.S.)', 'Pendo.io (U.S.)', 'Gainsight (U.S.)', 'Hevo Data, Inc. (U.S.)', 'Fullstory, Inc. (U.S.)', 'Looker Data Science, Inc. (U.S.)', 'Indicative Inc. (U.S.)', 'PostHog, Inc. (U.S.) '

The use and demand for product recommendation engines, which offer personalized service to the end-users, are growing day by day. Through recommendations, these tools help organizations to optimize customer behavior and service resulting in the maximum potential of marketing efforts. The end-user’s interest expressed by their history and their behavior enables the product recommendation tool to automatically pair that behavior with the right recommendation. Hence product analytics plays a key role in analyzing customer behavior.

Integration of AI and Advanced Analytics with Product Analytics: Product analytics software powered by artificial intelligence and advanced analytics helps organizations whose product teams analyze, visualize, and track customer behavior and engagement data. It also allows these organizations’ product managers and teams to assess and identify the impact of the digital experiences they create. The data is also critical in calibrating experiences for exceptional performance, diagnosing problems, and correlating customer behavior with long-term value.

North America has dominated the market revenue share in 2023. High internet penetration and the burgeoning e-commerce sector in North America are heavily dependent on product analytics to study and understand customer behavior, personalize the shopping experience, as well as optimize marketing strategies. The financial services sector in North America seems to be leveraging product analytics to enhance fraud detection, enabling the personalization of financial products, and enhancing customer services experience. The US is home to a highly advanced technology infrastructure, including widespread internet access, smartphone usage, and increasing connectivity across devices. Moreover, this infrastructure generates massive volumes of data, thereby driving the demand for product analytics solutions.

Request Free Customization

Want to customize this report? This report can be personalized according to your needs. Our analysts and industry experts will work directly with you to understand your requirements and provide you with customized data in a short amount of time. We offer $1000 worth of FREE customization at the time of purchase.

logo-images

Feedback From Our Clients

Product Analytics Market

Report ID: SQMIG45A2362

sales@skyquestt.com
USA +1 351-333-4748

BUY NOW GET FREE SAMPLE