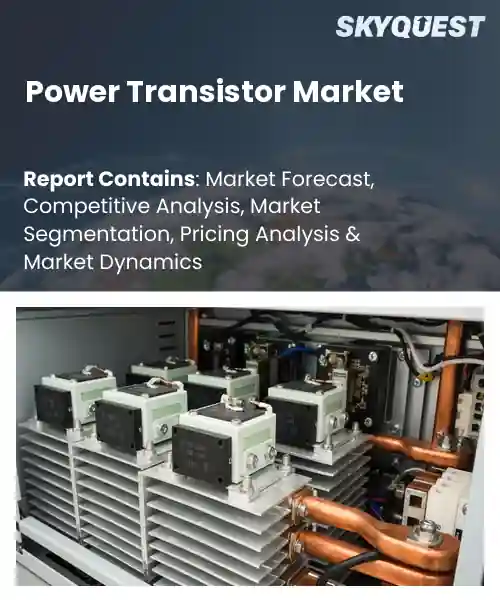
Power Transistor Market
Report ID: SQMIG45O2172
Report ID: SQMIG45O2172
[email protected]
USA +1 351-333-4748
Report ID:
SQMIG45O2172 |
Region:
Global |
Published Date: July, 2026
Pages:
157
|Tables:
226
|Figures:
80


Global Power Transistor Market size was valued at USD 22.63 Billion in 2024 and is poised to grow from USD 23.96 Billion in 2025 to USD 37.78 Billion by 2033, growing at a CAGR of 5.9% during the forecast period (2026-2033).
The power transistor market trends includes semiconductor devices like MOSFETs, IGBTs and wide-bandgap devices that switch and amplify electrical power in applications from consumer electronics to industrial drives. This is important, because these devices are responsible for the efficient conversion of energy, which directly influences the carbon footprint of modern systems. The market has been driven for the past 20 years by the electrification of transportation, the growth of renewable-energy installations and the explosion of data-center workloads. For example, silicon-carbide IGBTs for electric-vehicle inverters have reduced losses by up to 30%. The industry has transitioned from bulk silicon to more sophisticated materials, with IGBTs and MOSFETs taking over smartphone chargers.
Adoption of wide-bandgap semiconductors is driving power transistor market growth, catalyzed by tighter efficiency standards and power density requirements from electric-vehicle drivetrains, solar inverters and 5G base stations. Manufacturers are replacing silicon IGBTs with silicon-carbide or gallium-nitride devices that can handle higher temperatures, driven by regulators forcing lower losses. That shrinks cooling hardware, and reduces costs. This is seen in the move to SiC modules by Tesla, which cut cooling costs by 20%, and in utility-scale solar farms, where GaN converters boost energy yield by 5%. The surge provides opportunities for Asia-Pacific foundries to expand capacity and OEMs to grab share with lighter and more efficient products.
How is AI-driven Design Automation Impacting the Power Transistor Market?
Automation and artificial intelligence are designing power transistor market share differently. By using machine learning to predict electrical behavior, thermal flow and reliability, engineers can study many topologies in hours, not weeks. The tools suggest layouts that compromise between performance and manufacturability, reducing the time for iteration. This speed will help the adoption of wide bandgap materials such as silicon carbide and gallium nitride, key to electric vehicles and data centers. This translates into shorter product cycles and more efficient devices to meet increasing demand, further enhancing overall momentum in the market.
January 2026 ON Semiconductor introduced high efficiency gallium nitride power transistors for data centers and industrial automation. The company showed how artificial intelligence-driven design tools sped up the device architecture and shortened validation time to support market growth, improving efficiency and enabling quicker time to market for next generation solutions.
Market snapshot - (2026-2033)
Global Market Size
USD 22.63 Billion
Largest Segment
Low-Voltage field-effect transistors
Fastest Growth
Wide-Bandgap Power Transistors
Growth Rate
5.86% CAGR
To get more insights on this market click here to Request a Free Sample Report
Global power transistor market is segmented by product type, material type, channel configuration, packaging configuration, power rating, application area, end-use industry and region. Based on product type, the market is segmented into low-voltage field-effect transistors, high-voltage field-effect transistors, discrete insulated-gate bipolar transistors, insulated-gate bipolar transistor modules, super-junction metal-oxide-semiconductor field-effect transistors, radio frequency transistors, microwave transistors and wide-bandgap power transistors. Based on material type, the market is segmented into silicon, silicon carbide, gallium nitride, gallium arsenide and others. Based on channel configuration, the market is segmented into bipolar junction transistor, field-effect transistor and heterojunction bipolar transistor. Based on packaging configuration, the market is segmented into discrete devices, power modules, power integrated circuits and integrated power stages. Based on power rating, the market is segmented into low power, medium power and high power. Based on application area, the market is segmented into inverters, converters, motor control, motor drives, power supplies, adapters, battery charging systems, battery management systems, radio frequency power amplifiers, lighting drivers and display drivers. Based on end-use industry, the market is segmented into automotive vehicles, electric vehicles, hybrid electric vehicles, consumer electronics, mobile devices, industrial automation, motor systems, energy infrastructure, power grids, data centers, high performance computing, telecommunications, 5G infrastructure, aerospace engineering and defense equipment. Based on region, the market is segmented into North America, Europe, Asia Pacific, Latin America and Middle East & Africa.
Wide-bandgap power transistors are leading the segment, combining high voltage blocking capability and low conduction loss to enable compact designs and higher efficiency in demanding power conversion applications. They can operate at higher temperatures , reducing the need for cooling ( vital for tightly packed systems ) . This technology advantage fits well with the need for lighter, more energy dense solutions in automotive, renewable energy and data center power infrastructure, resulting in strong market preference.
However, the fastest growth is seen in the super junction MOSFET segment where manufacturers are exploiting their ultra low on resistance to meet the increasing demand for high frequency conversion in electric vehicle chargers and server power supplies. Continuous innovations in cell architecture are leading to new levels of efficiency, driving broader adoption and wider market opportunities.
Silicon carbide segment leads because of its better electric field tolerance and thermal conductivity, which allows power devices to be operated at higher voltages and temperatures with significantly lower losses. These features ease the system design by eliminating the requirement for large heat sinks and facilitate higher power density. Its durable material meets stringent reliability requirements for a wide range of industrial automation applications and is the material of choice for next generation power supplies.
Meanwhile, gallium nitride segment is emerging as the fastest growing segment owing to its switching speed and low gate charge that are ideal for high frequency power conversion in compact consumer electronics and emerging 5G infrastructure. Continuous improvement in epitaxial growth is reducing the production cost, enabling wider adoption and creating new application spaces that drive the market growth.
To get detailed segments analysis, Request a Free Sample Report
Asia Pacific is the leading region backed by a highly integrated supply chain, world-class fabrication capabilities and strong policy incentives to prioritize semiconductor growth. A dense network of design houses, component makers and original equipment manufacturers enables fast iteration and cost-efficient scaling. Strong research cooperation between universities and industry accelerates material innovations and device miniaturization. The rising demand for electric mobility, renewable energy conversion and industrial automation aligns regional expertise to maintain a virtuous cycle of investments, technology advancement and leadership in the market and keeps Asia Pacific leading power transistor development worldwide.
Power transistor market outlook in Japan thrives on a legacy of precision engineering and close ties between semiconductor manufacturers and automotive OEMs. Strong collaborations with research institutes foster advanced material research, while government programs encourage domestic production capacity. The focus on high‑efficiency devices aligns with Japan’s leadership in electric mobility and renewable power conversion, reinforcing its role as a key supplier of innovative power transistor solutions.
Power transistor market forecast in South Korea benefits from aggressive industrial policies that nurture both large‑scale fabs and boutique design firms. A vibrant ecosystem of electronics conglomerates and specialized startups drives continuous improvement in switching performance and thermal management. Close integration with smart‑grid initiatives and rapid adoption of electric vehicles fuels demand for efficient power conversion, while strong intellectual property frameworks support the commercialization of cutting‑edge transistor architectures. This environment positions South Korea as a pivotal contributor to the region’s overall market dominance.
A combination of high growth demand for data center infrastructure, widespread electrification of transportation and a strong ecosystem of technology innovators is fueling North American expansion. The venture capital scene is hot for startups playing in silicon carbide and gallium nitride devices, while established manufacturers are using advanced packaging to boost performance and reliability. Research laboratories, auto manufacturers, and utility companies working together through strategic alliances speed up the deployment of energy-efficient solutions. Moreover, the availability of policy frameworks that promote the adoption of clean energy and improve resilience in power grids creates a favorable environment, allowing the market to expand rapidly across different application segments.
Power transistor market regional outlook in the United States is characterized by a deep pool of engineering talent and a culture of entrepreneurial innovation that drives groundbreaking device designs. Close partnerships between leading universities, federal research labs, and industry players enable rapid prototyping and scale‑up of high‑performance transistors. Significant emphasis on renewable energy integration and electric vehicle rollout fuels demand for efficient power conversion, while a mature supply chain supports domestic manufacturing and reduces dependency on external sources. This dynamic ecosystem sustains a vigorous growth trajectory for power transistors across multiple sectors.
Power transistor market regional forecast in Canada leverages its strengths in clean‑energy research and a collaborative industrial landscape to advance power conversion technologies. Strong ties between academic institutions and emerging tech firms foster the development of robust, high‑efficiency transistors suited for winter‑resilient grid applications and growing renewable projects. Government incentives aimed at sustainable infrastructure encourage adoption of advanced power devices, while the presence of specialized manufacturing clusters supports localized production. These factors combine to position Canada as a progressive contributor to North American power transistor expansion.
Europe is strengthening its position with a strategic focus on sustainability, high-value manufacturing and standards-driven innovation. Throughout the European Union, joint actions are supporting research on wide-bandgap materials and integration of power transistors in smart-grid solutions, which contribute to the overall energy efficiency. Strong automotive engineering capabilities develop high-performance devices for electric mobility, and a focus on circular economy principles promote recyclable and long-lasting component designs. Europe’s position as a leader in the provision of reliable, environmentally aware power transistor technologies is further established by robust regulations and a skilled workforce.
Power transistor market analysis in Germany benefits from a tradition of precision manufacturing and a powerful automotive sector that demands high‑efficiency power conversion. Close cooperation between engineering institutes and industry accelerates the adoption of advanced semiconductor materials, while federal programs support scaling of domestic production. The emphasis on renewable energy integration and industrial automation creates a steady demand for robust, reliable transistors, reinforcing Germany’s reputation as a key European hub for cutting‑edge power device solutions.
Power transistor market penetration in the United Kingdom is driven by a vibrant research ecosystem and strong emphasis on low‑carbon technologies. Collaborative clusters linking universities, startups, and established manufacturers foster rapid innovation in silicon carbide and gallium nitride transistors. Initiatives focused on electric transportation and smart‑grid deployment generate market pull, while a regulatory environment that promotes energy efficiency accelerates adoption. This combination of academic excellence and industry commitment positions the United Kingdom as an influential player in Europe’s power transistor landscape.
Power transistor industry in France leverages its aerospace and renewable energy expertise to push the boundaries of high‑performance device design. Government‑backed research programs encourage the development of next‑generation wide‑bandgap technologies, while close ties with automotive and industrial sectors ensure practical application pathways. Emphasis on sustainable manufacturing practices and circular design principles aligns with broader European climate goals, fostering a market that values efficiency, durability, and environmental responsibility. This strategic focus solidifies France’s contribution to Europe’s advancing power transistor ecosystem.
To know more about the market opportunities by region and country, click here to
Buy The Complete Report
Increasing Demand For Efficient Power
Growth Of Renewable Energy Systems
High Cost Of Advanced Materials
Complexity In Manufacturing Processes
Request Free Customization of this report to help us to meet your business objectives.
The global power transistor market is experiencing intense competition as established semiconductor manufacturers accelerate innovation in silicon (Si), silicon carbide (SiC), and gallium nitride (GaN) technologies to address the growing demand for high-efficiency power electronics across electric vehicles, renewable energy systems, industrial automation, and AI infrastructure. Leading companies are expanding production capacity, introducing next-generation wide-bandgap devices, and strengthening partnerships with automotive OEMs and industrial equipment manufacturers to improve power density, thermal performance, and energy efficiency. At the same time, emerging semiconductor innovators such as Finwave Semiconductor are attracting investment to commercialize advanced GaN transistor technologies, intensifying competition and accelerating the transition toward higher-performance power conversion solutions.
Top Player’s Company Profile
Recent Developments in the Power Transistor Market
SkyQuest’s ABIRAW (Advanced Business Intelligence, Research & Analysis Wing) is our Business Information Services team that Collects, Collates, Correlates, and Analyses the Data collected by means of Primary Exploratory Research backed by robust Secondary Desk research. As per SkyQuest analysis, that the global power transistor market is primarily driven by the increasing demand for highly-efficient power conversion in automotive, consumer, and industrial devices, however, the high cost of advanced silicon-carbide and gallium-nitride materials restricts the adoption in price-sensitive segments. Asia Pacific continues to dominate the market with its integrated supply chain and strong policy support. The wide-bandgap power transistor segment continues to be the leader as designers are seeking for lower losses and higher temperature tolerance. Another important driver is the rapid expansion of renewable energy installations, creating demand for robust inverters and grid-tie converters and driving further growth.
| Report Metric | Details |
|---|---|
| Market size value in 2024 | USD 22.63 Billion |
| Market size value in 2033 | USD 37.78 Billion |
| Growth Rate | 5.86% |
| Base year | 2024 |
| Forecast period | (2026-2033) |
| Forecast Unit (Value) | USD Billion |
| Segments covered |
|
| Regions covered | North America (US, Canada), Europe (Germany, France, United Kingdom, Italy, Spain, Rest of Europe), Asia Pacific (China, India, Japan, Rest of Asia-Pacific), Latin America (Brazil, Rest of Latin America), Middle East & Africa (South Africa, GCC Countries, Rest of MEA) |
| Companies covered |
|
| Customization scope | Free report customization with purchase. Customization includes:-
|
To get a free trial access to our platform which is a one stop solution for all your data requirements for quicker decision making. This platform allows you to compare markets, competitors who are prominent in the market, and mega trends that are influencing the dynamics in the market. Also, get access to detailed SkyQuest exclusive matrix.
Table Of Content
Executive Summary
Market overview
Parent Market Analysis
Market overview
Market size
KEY MARKET INSIGHTS
COVID IMPACT
MARKET DYNAMICS & OUTLOOK
Market Size by Region
KEY COMPANY PROFILES
Methodology
For the Power Transistor Market, our research methodology involved a mixture of primary and secondary data sources. Key steps involved in the research process are listed below:
1. Information Procurement: This stage involved the procurement of Market data or related information via primary and secondary sources. The various secondary sources used included various company websites, annual reports, trade databases, and paid databases such as Hoover's, Bloomberg Business, Factiva, and Avention. Our team did 45 primary interactions Globally which included several stakeholders such as manufacturers, customers, key opinion leaders, etc. Overall, information procurement was one of the most extensive stages in our research process.
2. Information Analysis: This step involved triangulation of data through bottom-up and top-down approaches to estimate and validate the total size and future estimate of the Power Transistor Market.
3. Report Formulation: The final step entailed the placement of data points in appropriate Market spaces in an attempt to deduce viable conclusions.
4. Validation & Publishing: Validation is the most important step in the process. Validation & re-validation via an intricately designed process helped us finalize data points to be used for final calculations. The final Market estimates and forecasts were then aligned and sent to our panel of industry experts for validation of data. Once the validation was done the report was sent to our Quality Assurance team to ensure adherence to style guides, consistency & design.
Analyst Support
Customization Options
With the given market data, our dedicated team of analysts can offer you the following customization options are available for the Power Transistor Market:
Product Analysis: Product matrix, which offers a detailed comparison of the product portfolio of companies.
Regional Analysis: Further analysis of the Power Transistor Market for additional countries.
Competitive Analysis: Detailed analysis and profiling of additional Market players & comparative analysis of competitive products.
Go to Market Strategy: Find the high-growth channels to invest your marketing efforts and increase your customer base.
Innovation Mapping: Identify racial solutions and innovation, connected to deep ecosystems of innovators, start-ups, academics, and strategic partners.
Category Intelligence: Customized intelligence that is relevant to their supply Markets will enable them to make smarter sourcing decisions and improve their category management.
Public Company Transcript Analysis: To improve the investment performance by generating new alpha and making better-informed decisions.
Social Media Listening: To analyze the conversations and trends happening not just around your brand, but around your industry as a whole, and use those insights to make better Marketing decisions.
REQUEST FOR SAMPLE
 REQUEST FREE CUSTOMIZATION
Global Power Transistor Market size was valued at USD 22.63 Billion in 2024 and is poised to grow from USD 23.96 Billion in 2025 to USD 37.78 Billion by 2033, growing at a CAGR of 5.86% during the forecast period (2026-2033).
The global power transistor market is shaped by fierce competition between legacy silicon specialists such as Infineon, Texas Instruments and emerging wide‑bandgap players. Companies are defending market share through advanced SiC and GaN product rollouts, strategic partnerships with OEMs, and targeted venture‑backed acquisitions. Recent examples include Finwave’s $12.2 million Series A with Fine Structure Ventures and Claros’s $30 million seed round led by General Catalyst, underscoring the race for efficiency‑driven applications. 'Infineon Technologies AG', 'onsemi', 'STMicroelectronics N.V.', 'Texas Instruments Incorporated', 'Renesas Electronics Corporation', 'NXP Semiconductors N.V.', 'Toshiba Corporation', 'Mitsubishi Electric Corporation', 'Rohm Co. Ltd.', 'Fuji Electric Co. Ltd.', 'Vishay Intertechnology Inc.', 'Alpha and Omega Semiconductor Limited', 'Diodes Incorporated', 'Microchip Technology Inc.', 'Nexperia B.V.', 'Littelfuse Inc.', 'Semikron Danfoss', 'SanRex', 'Shindengen Electric Manufacturing Co. Ltd.', 'Qualcomm Incorporated'
The shift toward higher energy efficiency in consumer electronics, automotive and industrial equipment drives adoption of power transistors that minimize losses and improve thermal performance. Manufacturers respond by integrating advanced semiconductor technologies that deliver lower on‑resistance and faster switching. This enables device designers to meet stringent regulatory standards and extend battery life, which in turn fuels demand for more capable transistors across multiple sectors, reinforcing a cycle of innovation and market expansion. Through improved system reliability and reduced cooling requirements, overall product performance benefits are amplified.
Rapid Adoption Of Wide‑Bandgap Devices: Manufacturers are increasingly integrating silicon‑carbide and gallium‑nitride transistors into power conversion modules, driven by their superior efficiency, thermal performance, and voltage handling. This shift enables lighter, smaller systems across renewable energy inverters, data‑center power supplies, and electric‑vehicle drivetrains. As design cycles shorten and supply chains mature, engineers favor these materials for their ability to reduce losses and support higher switching frequencies, accelerating product differentiation and fostering new application niches that demand compact, high‑performance power solutions for industrial automation and aerospace.
Why does Asia Pacific Dominate the Global Power Transistor Market? |@12


Want to customize this report? This report can be personalized according to your needs. Our analysts and industry experts will work directly with you to understand your requirements and provide you with customized data in a short amount of time. We offer $1000 worth of FREE customization at the time of purchase.
Feedback From Our Clients


 USA (+1) 351-333-4748

