Power Quality Equipment Market Size, Share, and Growth Analysis

Null

Power Quality Equipment Market By Equipment (Power Quality Meters, Surge Protection Devices), By Phase (Single Phase, Three Phase), By End-User (Residential, Commercial), By Region - Industry Forecast 2025-2032


Report ID: SQMIG20E2109 | Region: Global | Published Date: February, 2025
Pages: 198 |Tables: 87 |Figures: 69

Format - word format excel data power point presentation

Power Quality Equipment Market Insights

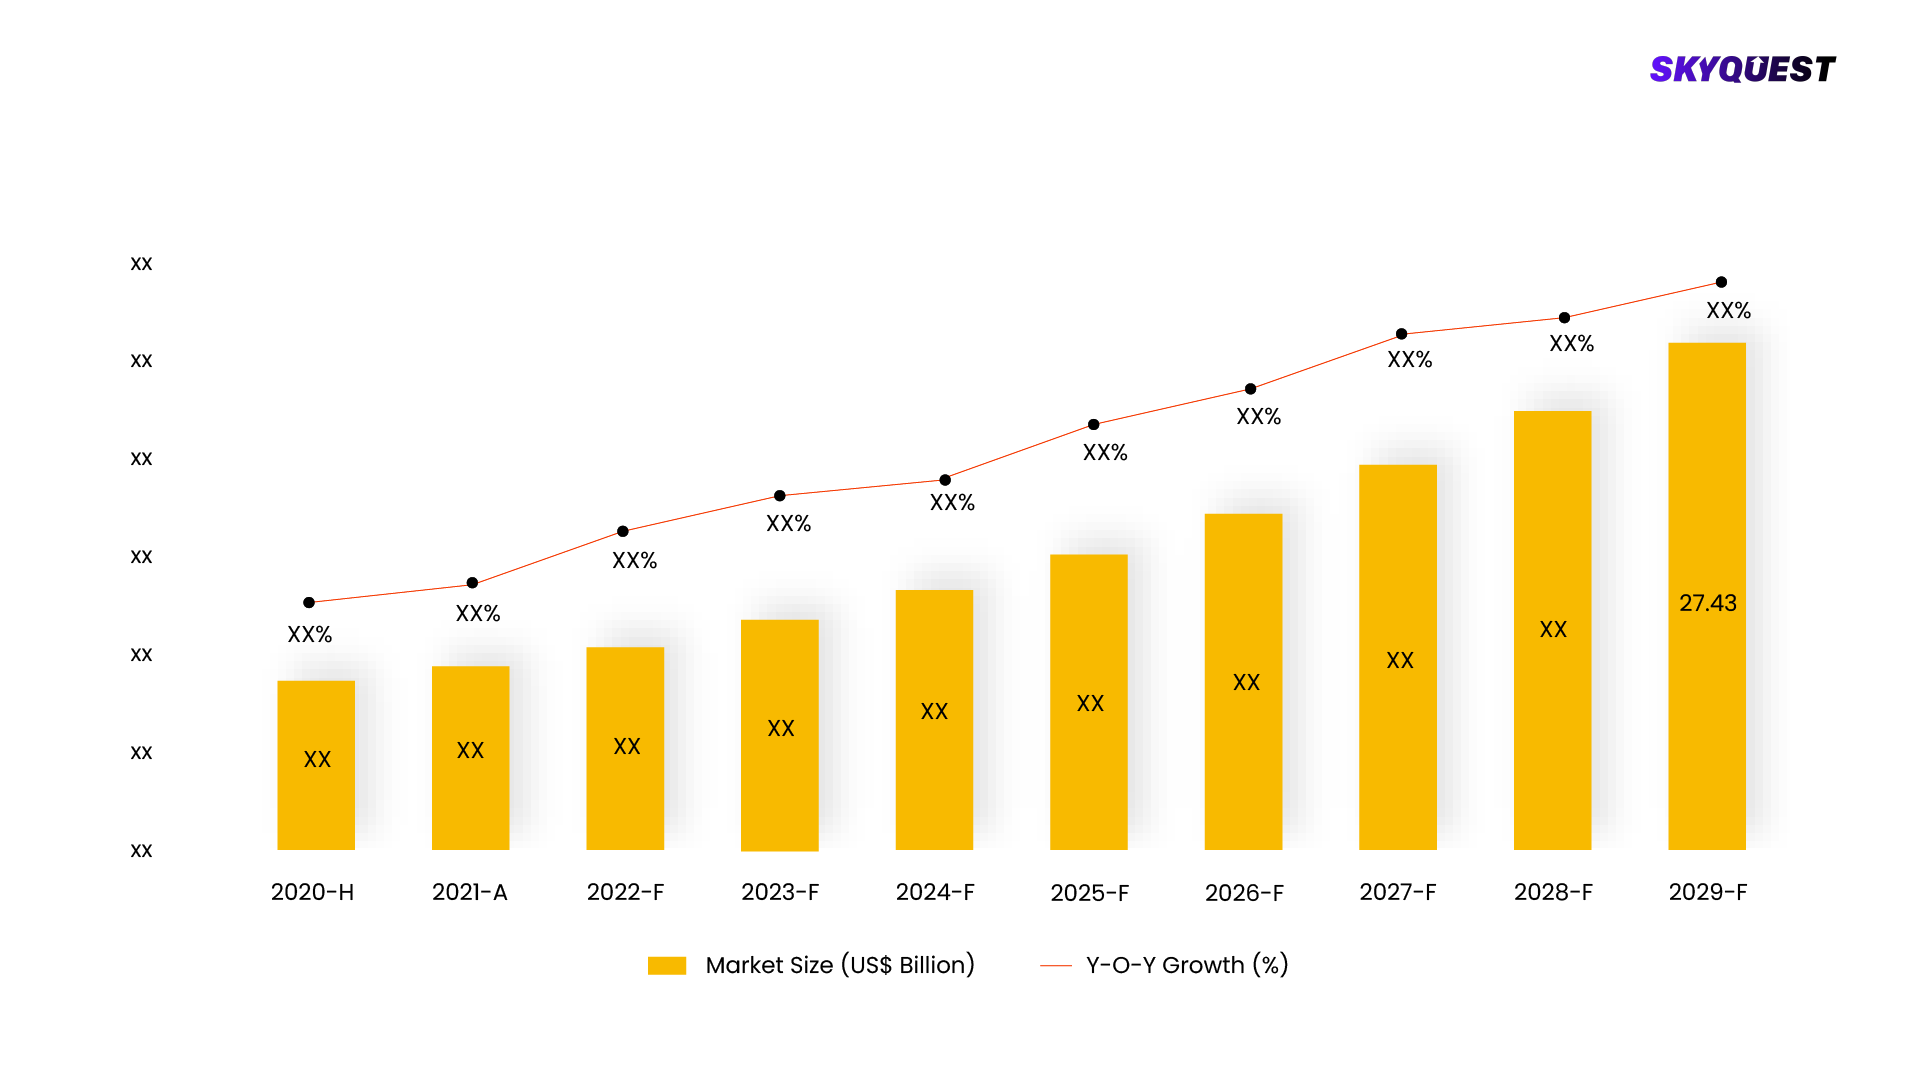
Global Power Quality Equipment Market size was valued at USD 33.4 billion in 2023 and is poised to grow from USD 35.57 billion in 2024 to USD 58.87 billion by 2032, growing at a CAGR of 6.5% during the forecast period (2025-2032). 

The demand for power quality measurement equipment is experiencing significant growth due to increasing reliance on complex electrical systems and the need for reliable, uninterrupted power supplies across various industries. In the past few decades, the telecommunications sector has experienced significant growth and expansion. In addition to voice communication systems, concepts like IoT have increased the need for data transmission in the telecom sector. The emergence of data centers and their huge consumption of power has paved the way for the power quality equipment market to serve the rising needs of the sector. To ensure the efficient functioning of the data centers, the companies are making extensive use of power quality equipment and systems increasing their demand significantly. For instance, on July 6, 2023, Center3, a company managing data centers in the Kingdom of Saudi Arabia announced the expansion of Khurais Riyadh data center to drive the growth of innovation in the region. Such, expansions in data centers would increase the demand for power quality equipment and lead to the growth of global power quality equipment market during the forecast period.

The growth in the market is also governed by the rise in the number of technological advancements for power quality equipment in the last few years. In addition, the market is expected to be further driven by strict smart government regulations on reactive power and penalties implied on end-users coupled with energy efficiency policies in different nations around the globe.

Market snapshot - 2025-2032

Global Market Size

USD 33.4 billion

Largest Segment

Three-phase

Fastest Growth

Single-phase

Growth Rate

6.5% CAGR

Global Power Quality Equipment Market ($ Bn)
Country Share for North America Region (%)

To get more reports on the above market click here to Buy The Report

Power Quality Equipment Market Segments Analysis

Global Power Quality Equipment Market is segmented by Equipment, Phase, End-User and region. Based on Equipment, the market is segmented into Power Quality Meters, Surge Protection Devices, Harmonic Filters, Voltage Regulators, Uninterruptable Power Supply (UPS) and Others. Based on Phase, the market is segmented into Single Phase and Three Phase. Based on End-User, the market is segmented into Residential, Commercial, Industrial & Manufacturing, Utilities and Transportation. Based on region, the market is segmented into North America, Europe, Asia Pacific, Latin America and Middle East & Africa.  

Analysis by Application

As per global power quality equipment market outlook, the industrial & manufacturing segment dominated the market and accounted for 32.1% of the revenue share in 2024. In the industrial and manufacturing segment, the demand for power quality measurement equipment is significant due to the critical need for reliable and stable electrical systems to support complex machinery and processes. Industrial operations often involve large, sophisticated equipment that requires precise power quality monitoring to prevent disruptions, reduce downtime, and ensure optimal performance. The increasing use of automation, advanced manufacturing techniques, and integration of renewable energy sources in industrial settings further drive the need for advanced power quality measurement tools to effectively manage voltage imbalances, harmonics, and other power quality issues.

As per global power quality equipment market analysis, transportation segment is the fastest growing in the market. The demand for power quality measurement equipment is rising in the transportation segment as the industry modernizes and integrates more sophisticated electrical and electronic systems. With the growth of electric and hybrid vehicles and the increasing reliance on advanced signalling, communication, and control systems in rail and road networks, there is a heightened need for precise monitoring of power quality. Ensuring stable and high-quality power is essential for the reliable operation of these systems, minimizing disruptions and maintaining safety and efficiency across transportation infrastructure.

Analysis by Type

As per global power quality equipment market forecast, the three-phase type segment dominated the market and accounted for 58.5% of the global market revenue share in 2024. The demand for three-phase power quality measurement equipment is robust, driven by its crucial role in monitoring and managing the performance of complex industrial and commercial electrical systems. As three-phase systems are widely used in large-scale operations and critical infrastructure, precise measurement tools to detect imbalances, harmonics, and other disturbances are essential for maintaining system efficiency and reliability. The increasing complexity of industrial machinery and the integration of renewable energy sources amplify the demand for advanced three-phase measurement solutions to ensure optimal operation and prevent costly downtimes.

Single-phase segment is the fastest growing in the market due to wider availability and infrastructure. The demand for single-phase power quality measurement equipment is growing as more residential and smaller commercial settings seek to protect sensitive electronic devices and optimize energy consumption. With the proliferation of household appliances, electronic devices, and small-scale business operations that rely on single-phase power, measurement tools that can monitor voltage fluctuations, harmonics, and other power quality issues are needed. This growing focus on improving energy efficiency and safeguarding equipment performance in these settings drives the increasing adoption of single-phase power quality measurement solutions.

Global Power Quality Equipment Market By Type (%)

To get detailed analysis on other segments, Request For Free Sample Report

Power Quality Equipment Market Regional Insights

North America dominated the power quality equipment market due to ongoing investments in infrastructure modernization, the expansion of renewable energy, and increasing regulatory requirements. The region's focus on enhancing energy efficiency, integrating advanced technologies into power grids, and maintaining high standards of power quality drives the adoption of sophisticated measurement tools. The need to manage complex electrical systems, prevent disruptions, and comply with stringent standards across industrial, commercial, and residential sectors supports North America's robust demand for power quality measurement solutions. The U.S. and Canada are heavily investing in upgrading aging power grids to improve reliability and efficiency.

The power quality equipment market in Asia Pacific witnesses a robust demand fuelled by rapid industrialization, urban expansion, and increasing technological advancements. Countries like China, Japan, and South Korea invest heavily in modernizing their power infrastructure and integrating renewable energy sources, creating a significant need for advanced power quality monitoring tools. In addition, the rise of smart cities and advanced manufacturing processes across the region enhances the demand for precise and reliable measurement solutions to manage complex electrical systems and ensure operational efficiency. Countries like China, India, Japan, and South Korea are witnessing massive industrial growth, increasing the demand for stable and high-quality power supply.

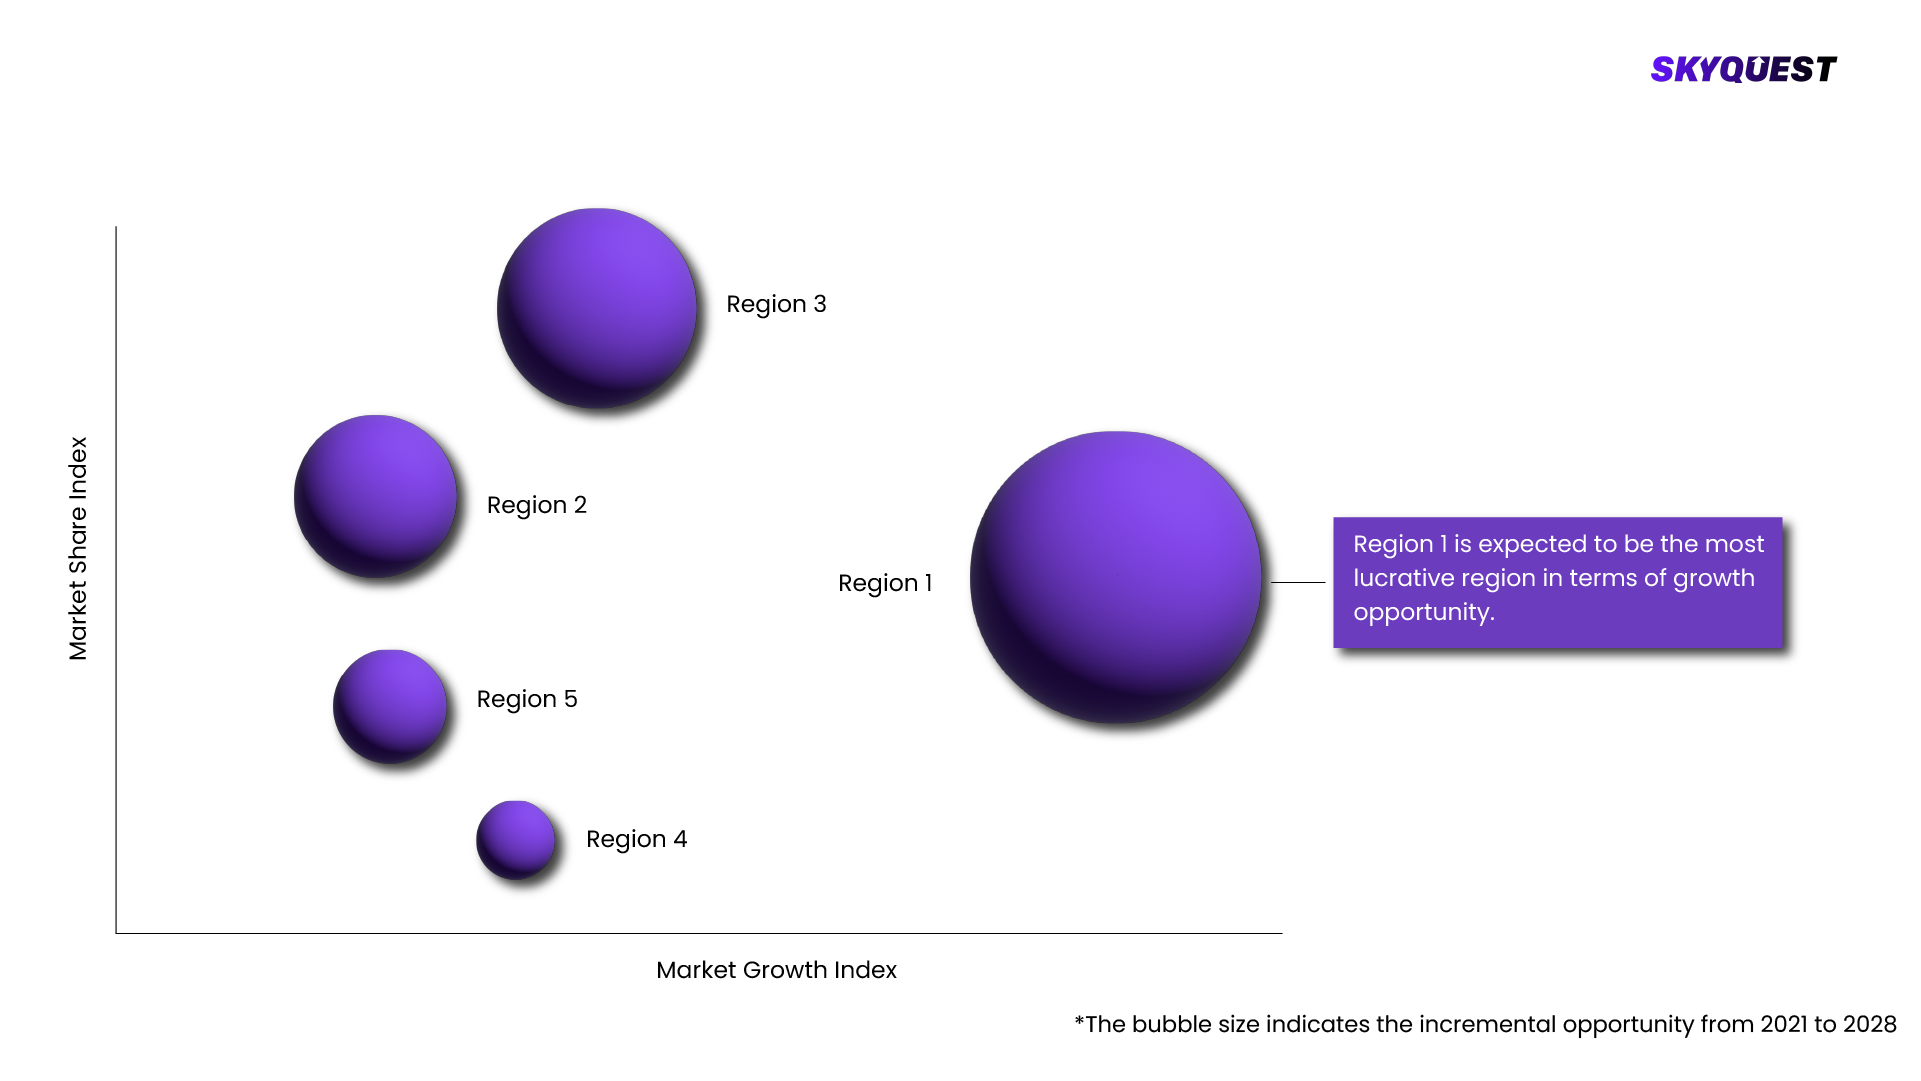
Global Power Quality Equipment Market By Geography
  • Largest
  • Fastest

To know more about the market opportunities by region and country, click here to
Buy The Complete Report

Power Quality Equipment Market Dynamics

Drivers

Increasing Demand for Uninterrupted Power Supply

  • The modern industrial and commercial landscape is relying heavily on continuous and reliable power to maintain productivity and operational efficiency, which is driving the global power quality equipment market growth. Manufacturing, healthcare, information technology (IT), and telecommunications industries all have strict requirements for uninterrupted power supplies. Furthermore, healthcare institutions rely on consistent power to keep life-saving equipment operational and vital systems such as patient monitoring devices and diagnostic gear running.

Rising Industrial Automation

  • Modern industries are increasingly adopting automation technologies to enhance productivity, precision, and efficiency. Robotic arms, computer numerical control (CNC) machines, and automated assembly lines all require reliable power to function effectively. Power disturbances such as voltage fluctuations, harmonics, and transient interruptions can all have a substantial impact on the performance and longevity of this sophisticated equipment.

Restraints

Cost Associated with Equipment

  • The primary objective of power quality (PQ) equipment is to reduce the number of devices utilized by a system. Additionally, it provides databases where data may be collected, analyzed, and saved instantly and measure and analyze data needed for a short duration. Businesses are impacted by power quality in a variety of short, mid, and long-term ways. An insufficient level of electricity frequently causes financial losses, adverse societal effects, and inappropriate use of resources. Various functions, including disturbance detection and location. As a result, this equipment is pricey and requires costly installation. The overall expansion of the power quality equipment market share is anticipated to be constrained by the high costs of high-end equipment.

Complex Regulatory Landscape and High Initial Investment

  • One of the significant challenges in the Power Quality Equipment market is navigating the complex regulatory landscape. Power quality standards and regulations vary widely across regions and countries, making it difficult for manufacturers to develop products that comply with all requirements. For instance, discussions during the Thirty-First Meeting of the Forum of Regulators highlighted the need for greater regulatory intervention to ensure quality power supply, emphasizing that compliance with power quality standards is essential for maintaining operational efficiency and avoiding penalties.

Request Free Customization of this report to help us to meet your business objectives.

Power Quality Equipment Market Competitive Landscape

The global power quality equipment industry is characterized by the presence of several key players striving for innovation and market leadership. Prominent companies in this sector include ABB Ltd., Eaton Corporation PLC, Siemens AG, Schneider Electric SE, and General Electric Company. These industry leaders are focusing on developing advanced solutions to enhance power quality and reliability across various applications.

Top Player’s Company Profiles

  • ABB (Switzerland) 
  • Schneider Electric (France) 
  • Eaton Corporation (Ireland) 
  • Siemens Energy (Germany) 
  • Legrand (France) 
  • Mersen (France) 
  • Schurter (Switzerland) 
  • Ametek (USA) 
  • General Electric (USA) 
  • Emerson Electric (USA) 
  • Honeywell International (USA) 
  • Mitsubishi Electric (Japan) 
  • Fuji Electric (Japan) 
  • Toshiba Corporation (Japan) 
  • Hitachi (Japan) 
  • Rockwell Automation (USA) 
  • Yokogawa Electric (Japan) 
  • Littelfuse (USA) 
  • Vertiv (USA) 
  • Socomec (France)

Recent Developments

  • In January 2024: CyberPower announced that it is expanding its Smart App Sinewave UPS Series to include Lithium-Iron models. These next-generation systems will offer all the advantages of Smart App Sinewave UPS systems but with less maintenance and a longer product lifecycle.
  • In May 2024: Eaton acquired Exertherm, a UK-based privately owned company that provided thermal monitoring solutions for electrical equipment.
  • In April 2022: ABB India officially opened its expanded factory for Digital Substation Products and Digital Systems in Gujarat. Situated within ABB India’s largest manufacturing campus, this new facility addresses the increasing demand for a variety of digital substation products, serving not only India but also over 50 other countries.

Power Quality Equipment Key Market Trends

Power Quality Equipment Market SkyQuest Analysis

SkyQuest’s ABIRAW (Advanced Business Intelligence, Research & Analysis Wing) is our Business Information Services team that Collects, Collates, Co-relates, and Analyses the Data collected by means of Primary Exploratory Research backed by the robust Secondary Desk research.

According to SkyQuest analysis, power quality equipment is usually used in power grids for ensuring continuous and stable power supply. Different kind of power equipment include power quality analyzers, voltage regulators, uninterrupted power supply (UPS), harmonic filters, etc. The industrial and manufacturing sectors require a continuous and stable supply of power to carry the daily operations. Hence, the demand for power quality equipment to ensure an efficient power supply is high in these sectors which can provide the necessary boost for the global power quality equipment market to grow. Moreover, the expansion of grid infrastructure in various parts of the world is driving the demand for power quality equipment devices and systems fueling the growth of the global power quality equipment market.

Report Metric Details
Market size value in 2023 USD 33.4 billion
Market size value in 2032 USD 58.87 billion
Growth Rate 6.5%
Base year 2024
Forecast period 2025-2032
Forecast Unit (Value) USD Billion
Segments covered
  • Equipment
    • Power Quality Meters
    • Surge Protection Devices
    • Harmonic Filters
    • Voltage Regulators
    • Uninterruptable Power Supply (UPS)
    • Others
  • Phase
    • Single Phase
    • Three Phase
  • End-User
    • Residential
    • Commercial
    • Industrial & Manufacturing
    • Utilities
    • Transportation
Regions covered North America (US, Canada), Europe (Germany, France, United Kingdom, Italy, Spain, Rest of Europe), Asia Pacific (China, India, Japan, Rest of Asia-Pacific), Latin America (Brazil, Rest of Latin America), Middle East & Africa (South Africa, GCC Countries, Rest of MEA)
Companies covered
  • ABB (Switzerland) 
  • Schneider Electric (France) 
  • Eaton Corporation (Ireland) 
  • Siemens Energy (Germany) 
  • Legrand (France) 
  • Mersen (France) 
  • Schurter (Switzerland) 
  • Ametek (USA) 
  • General Electric (USA) 
  • Emerson Electric (USA) 
  • Honeywell International (USA) 
  • Mitsubishi Electric (Japan) 
  • Fuji Electric (Japan) 
  • Toshiba Corporation (Japan) 
  • Hitachi (Japan) 
  • Rockwell Automation (USA) 
  • Yokogawa Electric (Japan) 
  • Littelfuse (USA) 
  • Vertiv (USA) 
  • Socomec (France)
Customization scope

Free report customization with purchase. Customization includes:-

  • Segments by type, application, etc
  • Company profile
  • Market dynamics & outlook
  • Region

To get a free trial access to our platform which is a one stop solution for all your data requirements for quicker decision making. This platform allows you to compare markets, competitors who are prominent in the market, and mega trends that are influencing the dynamics in the market. Also, get access to detailed SkyQuest exclusive matrix.

Buy The Complete Report to read the analyzed strategies adopted by the top vendors either to retain or gain market share

Table Of Content

Executive Summary

Market overview

  • Exhibit: Executive Summary – Chart on Market Overview
  • Exhibit: Executive Summary – Data Table on Market Overview
  • Exhibit: Executive Summary – Chart on Power Quality Equipment Market Characteristics
  • Exhibit: Executive Summary – Chart on Market by Geography
  • Exhibit: Executive Summary – Chart on Market Segmentation
  • Exhibit: Executive Summary – Chart on Incremental Growth
  • Exhibit: Executive Summary – Data Table on Incremental Growth
  • Exhibit: Executive Summary – Chart on Vendor Market Positioning

Parent Market Analysis

Market overview

Market size

  • Market Dynamics
    • Exhibit: Impact analysis of DROC, 2021
      • Drivers
      • Opportunities
      • Restraints
      • Challenges
  • SWOT Analysis

KEY MARKET INSIGHTS

  • Technology Analysis
    • (Exhibit: Data Table: Name of technology and details)
  • Pricing Analysis
    • (Exhibit: Data Table: Name of technology and pricing details)
  • Supply Chain Analysis
    • (Exhibit: Detailed Supply Chain Presentation)
  • Value Chain Analysis
    • (Exhibit: Detailed Value Chain Presentation)
  • Ecosystem Of the Market
    • Exhibit: Parent Market Ecosystem Market Analysis
    • Exhibit: Market Characteristics of Parent Market
  • IP Analysis
    • (Exhibit: Data Table: Name of product/technology, patents filed, inventor/company name, acquiring firm)
  • Trade Analysis
    • (Exhibit: Data Table: Import and Export data details)
  • Startup Analysis
    • (Exhibit: Data Table: Emerging startups details)
  • Raw Material Analysis
    • (Exhibit: Data Table: Mapping of key raw materials)
  • Innovation Matrix
    • (Exhibit: Positioning Matrix: Mapping of new and existing technologies)
  • Pipeline product Analysis
    • (Exhibit: Data Table: Name of companies and pipeline products, regional mapping)
  • Macroeconomic Indicators

COVID IMPACT

  • Introduction
  • Impact On Economy—scenario Assessment
    • Exhibit: Data on GDP - Year-over-year growth 2016-2022 (%)
  • Revised Market Size
    • Exhibit: Data Table on Power Quality Equipment Market size and forecast 2021-2027 ($ million)
  • Impact Of COVID On Key Segments
    • Exhibit: Data Table on Segment Market size and forecast 2021-2027 ($ million)
  • COVID Strategies By Company
    • Exhibit: Analysis on key strategies adopted by companies

MARKET DYNAMICS & OUTLOOK

  • Market Dynamics
    • Exhibit: Impact analysis of DROC, 2021
      • Drivers
      • Opportunities
      • Restraints
      • Challenges
  • Regulatory Landscape
    • Exhibit: Data Table on regulation from different region
  • SWOT Analysis
  • Porters Analysis
    • Competitive rivalry
      • Exhibit: Competitive rivalry Impact of key factors, 2021
    • Threat of substitute products
      • Exhibit: Threat of Substitute Products Impact of key factors, 2021
    • Bargaining power of buyers
      • Exhibit: buyers bargaining power Impact of key factors, 2021
    • Threat of new entrants
      • Exhibit: Threat of new entrants Impact of key factors, 2021
    • Bargaining power of suppliers
      • Exhibit: Threat of suppliers bargaining power Impact of key factors, 2021
  • Skyquest special insights on future disruptions
    • Political Impact
    • Economic impact
    • Social Impact
    • Technical Impact
    • Environmental Impact
    • Legal Impact

Market Size by Region

  • Chart on Market share by geography 2021-2027 (%)
  • Data Table on Market share by geography 2021-2027(%)
  • North America
    • Chart on Market share by country 2021-2027 (%)
    • Data Table on Market share by country 2021-2027(%)
    • USA
      • Exhibit: Chart on Market share 2021-2027 (%)
      • Exhibit: Market size and forecast 2021-2027 ($ million)
    • Canada
      • Exhibit: Chart on Market share 2021-2027 (%)
      • Exhibit: Market size and forecast 2021-2027 ($ million)
  • Europe
    • Chart on Market share by country 2021-2027 (%)
    • Data Table on Market share by country 2021-2027(%)
    • Germany
      • Exhibit: Chart on Market share 2021-2027 (%)
      • Exhibit: Market size and forecast 2021-2027 ($ million)
    • Spain
      • Exhibit: Chart on Market share 2021-2027 (%)
      • Exhibit: Market size and forecast 2021-2027 ($ million)
    • France
      • Exhibit: Chart on Market share 2021-2027 (%)
      • Exhibit: Market size and forecast 2021-2027 ($ million)
    • UK
      • Exhibit: Chart on Market share 2021-2027 (%)
      • Exhibit: Market size and forecast 2021-2027 ($ million)
    • Rest of Europe
      • Exhibit: Chart on Market share 2021-2027 (%)
      • Exhibit: Market size and forecast 2021-2027 ($ million)
  • Asia Pacific
    • Chart on Market share by country 2021-2027 (%)
    • Data Table on Market share by country 2021-2027(%)
    • China
      • Exhibit: Chart on Market share 2021-2027 (%)
      • Exhibit: Market size and forecast 2021-2027 ($ million)
    • India
      • Exhibit: Chart on Market share 2021-2027 (%)
      • Exhibit: Market size and forecast 2021-2027 ($ million)
    • Japan
      • Exhibit: Chart on Market share 2021-2027 (%)
      • Exhibit: Market size and forecast 2021-2027 ($ million)
    • South Korea
      • Exhibit: Chart on Market share 2021-2027 (%)
      • Exhibit: Market size and forecast 2021-2027 ($ million)
    • Rest of Asia Pacific
      • Exhibit: Chart on Market share 2021-2027 (%)
      • Exhibit: Market size and forecast 2021-2027 ($ million)
  • Latin America
    • Chart on Market share by country 2021-2027 (%)
    • Data Table on Market share by country 2021-2027(%)
    • Brazil
      • Exhibit: Chart on Market share 2021-2027 (%)
      • Exhibit: Market size and forecast 2021-2027 ($ million)
    • Rest of South America
      • Exhibit: Chart on Market share 2021-2027 (%)
      • Exhibit: Market size and forecast 2021-2027 ($ million)
  • Middle East & Africa (MEA)
    • Chart on Market share by country 2021-2027 (%)
    • Data Table on Market share by country 2021-2027(%)
    • GCC Countries
      • Exhibit: Chart on Market share 2021-2027 (%)
      • Exhibit: Market size and forecast 2021-2027 ($ million)
    • South Africa
      • Exhibit: Chart on Market share 2021-2027 (%)
      • Exhibit: Market size and forecast 2021-2027 ($ million)
    • Rest of MEA
      • Exhibit: Chart on Market share 2021-2027 (%)
      • Exhibit: Market size and forecast 2021-2027 ($ million)

KEY COMPANY PROFILES

  • Competitive Landscape
    • Total number of companies covered
      • Exhibit: companies covered in the report, 2021
    • Top companies market positioning
      • Exhibit: company positioning matrix, 2021
    • Top companies market Share
      • Exhibit: Pie chart analysis on company market share, 2021(%)

Methodology

For the Power Quality Equipment Market, our research methodology involved a mixture of primary and secondary data sources. Key steps involved in the research process are listed below:

1. Information Procurement: This stage involved the procurement of Market data or related information via primary and secondary sources. The various secondary sources used included various company websites, annual reports, trade databases, and paid databases such as Hoover's, Bloomberg Business, Factiva, and Avention. Our team did 45 primary interactions Globally which included several stakeholders such as manufacturers, customers, key opinion leaders, etc. Overall, information procurement was one of the most extensive stages in our research process.

2. Information Analysis: This step involved triangulation of data through bottom-up and top-down approaches to estimate and validate the total size and future estimate of the Power Quality Equipment Market.

3. Report Formulation: The final step entailed the placement of data points in appropriate Market spaces in an attempt to deduce viable conclusions.

4. Validation & Publishing: Validation is the most important step in the process. Validation & re-validation via an intricately designed process helped us finalize data points to be used for final calculations. The final Market estimates and forecasts were then aligned and sent to our panel of industry experts for validation of data. Once the validation was done the report was sent to our Quality Assurance team to ensure adherence to style guides, consistency & design.

Analyst Support

Customization Options

With the given market data, our dedicated team of analysts can offer you the following customization options are available for the Power Quality Equipment Market:

Product Analysis: Product matrix, which offers a detailed comparison of the product portfolio of companies.

Regional Analysis: Further analysis of the Power Quality Equipment Market for additional countries.

Competitive Analysis: Detailed analysis and profiling of additional Market players & comparative analysis of competitive products.

Go to Market Strategy: Find the high-growth channels to invest your marketing efforts and increase your customer base.

Innovation Mapping: Identify racial solutions and innovation, connected to deep ecosystems of innovators, start-ups, academics, and strategic partners.

Category Intelligence: Customized intelligence that is relevant to their supply Markets will enable them to make smarter sourcing decisions and improve their category management.

Public Company Transcript Analysis: To improve the investment performance by generating new alpha and making better-informed decisions.

Social Media Listening: To analyze the conversations and trends happening not just around your brand, but around your industry as a whole, and use those insights to make better Marketing decisions.

$5,300

REQUEST FOR SAMPLE

Please verify that you're not a robot to proceed!
Want to customize this report? REQUEST FREE CUSTOMIZATION

FAQs

Global Power Quality Equipment Market size was valued at USD 35.60 billion in 2023 and is poised to grow from USD 36.85 billion in 2024 to USD 48.52 billion by 2032, growing at a CAGR of 3.5% in the forecast period (2025-2032).

The global power quality equipment industry is characterized by the presence of several key players striving for innovation and market leadership. Prominent companies in this sector include ABB Ltd., Eaton Corporation PLC, Siemens AG, Schneider Electric SE, and General Electric Company. These industry leaders are focusing on developing advanced solutions to enhance power quality and reliability across various applications. 'ABB Ltd.', 'General Electric Company', 'Schneider Electric', 'Siemens AG', 'Emerson Electric Company', 'Eaton Corporation Plc', 'Active Power Inc.', 'MTE Corporation', 'Smith’s Group plc.', 'Toshiba Corporation', 'Fluke Corporation', 'A. Eberle GmbH & Co. KG', 'MachineSense'

The modern industrial and commercial landscape is relying heavily on continuous and reliable power to maintain productivity and operational efficiency, which is driving the global power quality equipment market growth. Manufacturing, healthcare, information technology (IT), and telecommunications industries all have strict requirements for uninterrupted power supplies. Furthermore, healthcare institutions rely on consistent power to keep life-saving equipment operational and vital systems such as patient monitoring devices and diagnostic gear running.

Expansion of Renewable Energy Sources: The global shift towards renewable energy sources, such as solar and wind power, is another key factor contributing to the power quality equipment market growth. According to the International Energy Agency (IEA), the world is on course to add more renewable capacity in the next 5 years than all that has been built in the last 100 years. Around 3700 GW of new renewable capacity will come online between 2023 and 2028. Renewable energy integration into the power grid introduces variability and intermittency in power supply, as these sources are inherently dependent on environmental conditions.

North America dominated the power quality equipment market due to ongoing investments in infrastructure modernization, the expansion of renewable energy, and increasing regulatory requirements. The region's focus on enhancing energy efficiency, integrating advanced technologies into power grids, and maintaining high standards of power quality drives the adoption of sophisticated measurement tools. The need to manage complex electrical systems, prevent disruptions, and comply with stringent standards across industrial, commercial, and residential sectors supports North America's robust demand for power quality measurement solutions. The U.S. and Canada are heavily investing in upgrading aging power grids to improve reliability and efficiency.

Want to customize this report? This report can be personalized according to your needs. Our analysts and industry experts will work directly with you to understand your requirements and provide you with customized data in a short amount of time. We offer $1000 worth of FREE customization at the time of purchase.

AGC3x.webp
Aisin3x.webp
ASKA P Co. LTD3x.webp
BD3x.webp
BILL & MELIDA3x.webp
BOSCH3x.webp
CHUNGHWA TELECOM3x.webp
DAIKIN3x.webp
DEPARTMENT OF SCIENCE & TECHNOLOGY3x.webp
ETRI3x.webp
Fiti Testing3x.webp
GERRESHEIMER3x.webp
HENKEL3x.webp
HITACHI3x.webp
HOLISTIC MEDICAL CENTRE3x.webp
Institute for information industry3x.webp
JAXA3x.webp
JTI3x.webp
Khidi3x.webp
METHOD.3x.webp
Missul E&S3x.webp
MITSUBISHI3x.webp
MIZUHO3x.webp
NEC3x.webp
Nippon steel3x.webp
NOVARTIS3x.webp
Nttdata3x.webp
OSSTEM3x.webp
PALL3x.webp
Panasonic3x.webp
RECKITT3x.webp
Rohm3x.webp
RR KABEL3x.webp
SAMSUNG ELECTRONICS3x.webp
SEKISUI3x.webp
Sensata3x.webp
SENSEAIR3x.webp
Soft Bank Group3x.webp
SYSMEX3x.webp
TERUMO3x.webp
TOYOTA3x.webp
UNDP3x.webp
Unilever3x.webp
YAMAHA3x.webp
Yokogawa3x.webp

Feedback From Our Clients

Null
Power Quality Equipment Market

Report ID: SQMIG20E2109

[email protected]
USA +1 351-333-4748

BUY NOW GET FREE SAMPLE