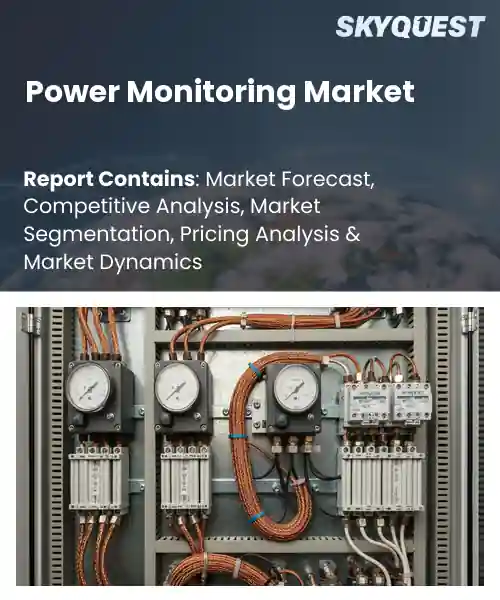
Power Monitoring Market
Report ID: SQMIG20D2622
Report ID: SQMIG20D2622
[email protected]
USA +1 351-333-4748
Report ID:
SQMIG20D2622 |
Region:
Global |
Published Date: May, 2026
Pages:
157
|Tables:
180
|Figures:
79


Global Power Monitoring Market size was valued at USD 5.3 Billion in 2024 and is poised to grow from USD 5.59 Billion in 2025 to USD 8.58 Billion by 2033, growing at a CAGR of 5.5% during the forecast period (2026-2033).
The primary driver of the power monitoring market is the accelerating need for real-time visibility into electrical systems, evolving from basic metering to integrated platforms. Power monitoring covers hardware, software and services that monitor voltage, current, power quality and energy usage, allowing utilities and industrial businesses to increase reliability and reduce costs. The power monitoring market is significant since utility outages and inefficiencies lead to costly financial losses and risk, and regulators require utilities to regularly report this data. This transition is evidenced by the increased number of utilities deploying PMUs to enhance grid stability and by the increase number of factories using submetering to optimize their processes.
Building on that evolution, one key trend driving the global power monitoring sector is the rapid rise of renewable generation and distributed energy resources, which creates variability demands enhanced visibility and control. In response to fluctuations in solar and wind power added to the grid by grid operators, vendors are developing additional edge analytics tools and cloud alerting solutions to assist consumers with onsite monitoring and detection of these two conditions. Consequently utilities invest in PMUs and DERMS to maintain stability, while industrial sites adopt predictive maintenance to prevent downtime. These shifts open opportunities for integrated hardware and software offerings, analytics subscriptions and aftermarket retrofits on legacy substations demonstrated in utility pilot programs.
How is IoT Improving Real-Time Accuracy in the Power Monitoring Market?
Internet of Things improves real time accuracy in power monitoring by linking dense sensor networks, edge processing and cloud analytics to deliver continuous high fidelity measurements. Key aspects are sensor placement, communication reliability and local preprocessing that reduces noise and latency. The market is shifting from periodic reads to continuous monitoring which gives operators better context on transients, harmonics and load imbalance. Vendors and utilities now combine IoT meters, gateways and analytics platforms so alerts are timelier and more actionable, improving outage response and asset management while enabling new service models.
In April 2026, Landis+Gyr joined EPRI’s Open Power AI Consortium to advance AI driven grid applications. That collaboration pairs IoT enabled grid sensors with machine learning to sharpen signal fidelity and speed anomaly detection which raises real time measurement accuracy and supports broader adoption and efficiency gains in the power monitoring market.
Market snapshot - (2026-2033)
Global Market Size
USD 5.3 Billion
Largest Segment
Hardware
Fastest Growth
Software
Growth Rate
5.5% CAGR
To get more insights on this market click here to Request a Free Sample Report
Global power monitoring market is segmented by component, monitoring type, end user, application, deployment mode, device type and region. Based on component, the market is segmented into Hardware, Software and Services. Based on monitoring type, the market is segmented into Energy Monitoring, Power Quality Monitoring, Load Monitoring, Equipment Monitoring and Others. Based on end user, the market is segmented into Industrial, Commercial Buildings, Utilities, Data Centers, Residential and Others. Based on application, the market is segmented into HVAC Systems, Manufacturing Equipment, Renewable Energy Systems, Smart Grids, Building Automation and Others. Based on deployment mode, the market is segmented into On-Premises and Cloud-Based. Based on device type, the market is segmented into Smart Meters, Power Monitoring Devices, Sensors & Transducers, Communication Gateways and Others. Based on region, the market is segmented into North America, Europe, Asia Pacific, Latin America and Middle East & Africa.
How are Hardware Solutions Shaping Power Monitoring Market Reliability?
Based on the global power monitoring market growth, hardware segment dominates because physical measurement devices form the foundation of power monitoring infrastructure, delivering precise sensing, robust connectivity and reliable data acquisition that other layers depend on. Proven device durability, compatibility with legacy systems and established vendor relationships drive widespread deployment, and the capital intensive nature of installations encourages long lifecycles. The hardware suppliers making up the majority of access points for quality input used in analytics and operational decision making are cemented as the primary gatekeepers by doing so.
However, software is emerging as the fastest growing area as analytics, cloud dashboards and predictive algorithms extract actionable insights from device data. Demand for subscription models and enterprise integration is accelerating adoption, enabling recurring revenue streams and investment in intelligent services that extend monitoring into optimization and automated operational response.
What Role do Power Quality Monitoring Systems Play in Power Monitoring Market Resilience?
Power quality monitoring segment leads because its focus on voltage stability, harmonic analysis and transient detection directly protects sensitive equipment and prevents costly interruptions, making it essential for industries with high reliability requirements. Regulatory pressure to provide high quality supplies and customers' desire for constant operations leads to investment in specialized tooling for testing and corrective action, giving rise to a market in which specialists who can both diagnose and correct quality issues are premium adopters.
Conversely, energy monitoring is the fastest growing area as efficiency mandates and sustainability targets drive deployment of consumption tracking tools. Integration with building management and demand response, alongside real time visibility into usage patterns, fuels adoption across applications and spurs investment in systems that link measurement with automated energy optimization.
To get detailed segments analysis, Request a Free Sample Report
How do Mature Electronics Supply Chains Strengthen Market Competitiveness in Asia Pacific?
Based on the global power monitoring market share, Asia Pacific leads due to a confluence of structural and market factors that create sustained demand for advanced monitoring solutions. Rapid growth in industrialization is leading to a significant increase in the amount of power management systems being deployed into heavy industrial facilities, commercial campuses, and data centers. Well-established electronics supply chain networks within Japan and South Korea will support innovation and the exportation of quality multifactor metering/sensor products. The combination of energy efficiency-focused policies and incentives for modernization create an additional stimulus to market activity. Well-established vendor ecosystems, local system integrators, and the increasing investment in smart grid projects all contribute the competitive edge that sustains global leadership in power monitoring.
Japan Power Monitoring Market
Power monitoring market in Japan benefits from advanced manufacturing and a technology oriented services sector that prioritizes precision, reliability, and system integration. Utilities and industries are pursuing modernization of the power grid (and their assets) in- to have a need for advanced metering, analysis, and predictive maintenance tools. There exists a vibrant ethical vendor ecosystem that supports product development through collaboration with research facilities, utility companies, and knowledgeable system integrators.
South Korea Power Monitoring Market
Power monitoring market in South Korea is shaped by strong electronics manufacturing, advanced semiconductor and data center demand, and proactive utility engagement in smart grid initiatives. Compact, high-performance sensors and analytic systems are being developed to support the needs of dense urban and industrial environments. Energy-efficient and resilient operation will create opportunities for their use in industrial parks, commercial/industrial buildings, and critical infrastructure sites. Supporting export-oriented development encourages regional businesses to export their domestic developed technology into global markets.
How does a Competitive Vendor Landscape Strengthen Market Development in North America?
Based on global power monitoring regional forecast, North America experiences rapid market expansion driven by a diverse set of demand sources and a supportive technology ecosystem. Commercial and industrial users of large amounts of electricity focus on keeping operations going 24/7 and using the least amount of energy possible. For these reasons, many large facilities are adopting smart meters/monitoring systems (e.g., advanced measurement infrastructure) to help manage their electricity use. As a result, utilities and service providers are responding to regulations requiring them to implement more reliable electricity delivery, improve the security of their electrical systems, and provide incentives to upgrade or install new metering and analytical capabilities. Integrating these systems with building management systems and the use of cloud-based analytical applications provide the ability to manage energy across multiple facilities on a large scale.
United States Power Monitoring Market
Power monitoring market in United States is propelled by an industrial base, data center activity, and utility modernization programs focused on resilience and cybersecurity. The integration of distributed energy resources and demand-response schemes is adding further complexities and increasing the need for interoperability between platforms. There is an existing ecosystem of vendors & integrators that have developed, supported and installed solutions across a range of verticals.
Canada Power Monitoring Market
Power monitoring market in Canada is shaped by emphasis on grid reliability across urban centers and remote regions and by integration of renewable resources and microgrid projects. Strategies that support the development of flexible platforms and analytics will require emphasis on interoperability and partnerships among vendors. Modernizing public infrastructure, getting vendors and end-users to work together, and using technology together enable the deployment of new technologies and the creation of new capabilities.
How do Modular Software Driven Platforms Improve Energy Management in Europe?
As per global power monitoring regional outlook, Europe is strengthening its role through coordinated modernization of grid infrastructure, emphasis on integration of variable renewable generation, and a focus on energy efficiency across industrial and commercial sectors. Major industrial companies in Germany, cutting-edge research and service businesses in the United Kingdom, and creative systems integration companies in France complement each other's capabilities. Utility and service companies have a high priority for performance of their assets, reducing their number of outages, and improving their ability to operate flexibly; while equipment vendors are focused on providing modular software-based product platforms that improve maintenance optimization and integrate seamlessly into the rest of the grid management system. A growing trend across the region towards increased digitalization and enhanced cybersecurity has resulted in a greater emphasis on real-time analytics, predictive maintenance and cloud-based platforms.
Germany Power Monitoring Market
Power monitoring market in Germany is driven by an industrial base demanding high reliability and energy management. To optimize the performance of industrial assets, as well as for energy transition purposes, utilities and industrial industries want advanced metering, condition monitoring and analytics. The ability to collaborate with local vendors and have access to localized engineering expertise helps create interoperable (i.e., able to communicate and function with each other) monitoring solutions that are customized to fit an organization's specific needs based on the complexity of its industrial processes.
United Kingdom Power Monitoring Market
Power monitoring market in United Kingdom benefits from a strong services sector and research institutions that support adoption of smart city and grid initiatives. Utilities and operators are exploring solutions for monitoring, such as adding connections to building management, telecommunications, and digital operations centers. Technology providers, regulatory authorities and end users will work collaboratively to support scalable pilot projects and build them out to all of public infrastructure.
France Power Monitoring Market
Power monitoring market in France is characterized by strong system integration capabilities and active utility engagement in modernization and flexibility measures. Monitoring and control processes for diverse energy supplies such as nuclear and renewable sources require various types of solutions. For example, local vendors/integrators are offering customized solutions for industrial facility, transport site, and urban infrastructure in order to accommodate digitalisation, interoperability, and energy efficiency.
To know more about the market opportunities by region and country, click here to
Buy The Complete Report
Drivers
Grid Modernization Drives Adoption
Cloud Platforms are Enabling
Restraints
High Implementation Complexity
Data Security Concerns Increase Resistance
Request Free Customization of this report to help us to meet your business objectives.
Competitive intensity in the global power monitoring market outlook centers on bundling hardware with analytics, driving incumbents and challengers to use M&A, strategic partnerships and platform innovation to defend contracts; examples include Eaton’s acquisition of PDI for data center monitoring, Schneider Electric linking EcoStruxure with AI partners to add analytics, and data center focused entrants launching virtualization platforms to deliver power aware GPU operations.
Top Player’s Company Profile
Recent Developments
SkyQuest’s ABIRAW (Advanced Business Intelligence, Research & Analysis Wing) is our Business Information Services team that Collects, Collates, Correlates, and Analyses the Data collected by means of Primary Exploratory Research backed by robust Secondary Desk research.
As per SkyQuest analysis, the global power monitoring industry is propelled primarily by the accelerating need for real-time visibility into electrical systems, while growth also benefits from the rapid rise of renewable generation and distributed energy resources that require finer monitoring and control. Adoption is led by the hardware segment, where durable sensing devices provide the foundation for analytics, and Asia Pacific dominates due to fast industrialization, smart grid investments and strong electronics supply chains. A significant restraint remains high implementation complexity when integrating advanced solutions into heterogeneous legacy infrastructures, which can extend timelines and raise costs, even as IoT and cloud platforms continue to expand addressable markets.
| Report Metric | Details |
|---|---|
| Market size value in 2024 | USD 5.3 Billion |
| Market size value in 2033 | USD 8.58 Billion |
| Growth Rate | 5.5% |
| Base year | 2024 |
| Forecast period | (2026-2033) |
| Forecast Unit (Value) | USD Billion |
| Segments covered |
|
| Regions covered | North America (US, Canada), Europe (Germany, France, United Kingdom, Italy, Spain, Rest of Europe), Asia Pacific (China, India, Japan, Rest of Asia-Pacific), Latin America (Brazil, Rest of Latin America), Middle East & Africa (South Africa, GCC Countries, Rest of MEA) |
| Companies covered |
|
| Customization scope | Free report customization with purchase. Customization includes:-
|
To get a free trial access to our platform which is a one stop solution for all your data requirements for quicker decision making. This platform allows you to compare markets, competitors who are prominent in the market, and mega trends that are influencing the dynamics in the market. Also, get access to detailed SkyQuest exclusive matrix.
Table Of Content
Executive Summary
Market overview
Parent Market Analysis
Market overview
Market size
KEY MARKET INSIGHTS
COVID IMPACT
MARKET DYNAMICS & OUTLOOK
Market Size by Region
KEY COMPANY PROFILES
Methodology
For the Power Monitoring Market, our research methodology involved a mixture of primary and secondary data sources. Key steps involved in the research process are listed below:
1. Information Procurement: This stage involved the procurement of Market data or related information via primary and secondary sources. The various secondary sources used included various company websites, annual reports, trade databases, and paid databases such as Hoover's, Bloomberg Business, Factiva, and Avention. Our team did 45 primary interactions Globally which included several stakeholders such as manufacturers, customers, key opinion leaders, etc. Overall, information procurement was one of the most extensive stages in our research process.
2. Information Analysis: This step involved triangulation of data through bottom-up and top-down approaches to estimate and validate the total size and future estimate of the Power Monitoring Market.
3. Report Formulation: The final step entailed the placement of data points in appropriate Market spaces in an attempt to deduce viable conclusions.
4. Validation & Publishing: Validation is the most important step in the process. Validation & re-validation via an intricately designed process helped us finalize data points to be used for final calculations. The final Market estimates and forecasts were then aligned and sent to our panel of industry experts for validation of data. Once the validation was done the report was sent to our Quality Assurance team to ensure adherence to style guides, consistency & design.
Analyst Support
Customization Options
With the given market data, our dedicated team of analysts can offer you the following customization options are available for the Power Monitoring Market:
Product Analysis: Product matrix, which offers a detailed comparison of the product portfolio of companies.
Regional Analysis: Further analysis of the Power Monitoring Market for additional countries.
Competitive Analysis: Detailed analysis and profiling of additional Market players & comparative analysis of competitive products.
Go to Market Strategy: Find the high-growth channels to invest your marketing efforts and increase your customer base.
Innovation Mapping: Identify racial solutions and innovation, connected to deep ecosystems of innovators, start-ups, academics, and strategic partners.
Category Intelligence: Customized intelligence that is relevant to their supply Markets will enable them to make smarter sourcing decisions and improve their category management.
Public Company Transcript Analysis: To improve the investment performance by generating new alpha and making better-informed decisions.
Social Media Listening: To analyze the conversations and trends happening not just around your brand, but around your industry as a whole, and use those insights to make better Marketing decisions.
REQUEST FOR SAMPLE
 REQUEST FREE CUSTOMIZATION
Global Power Monitoring Market size was valued at USD 5.3 Billion in 2024 and is poised to grow from USD 5.59 Billion in 2025 to USD 8.58 Billion by 2033, growing at a CAGR of 5.5% during the forecast period (2026-2033).
Competitive intensity in the global power monitoring market centers on bundling hardware with analytics, driving incumbents and challengers to use M&A, strategic partnerships and platform innovation to defend contracts; examples include Eaton’s acquisition of PDI for data center monitoring, Schneider Electric linking EcoStruxure with AI partners to add analytics, and data center focused entrants launching virtualization platforms to deliver power aware GPU operations. 'Schneider Electric SE', 'Siemens AG', 'ABB Ltd.', 'Eaton Corporation plc', 'General Electric Company', 'Honeywell International Inc.', 'Emerson Electric Co.', 'Mitsubishi Electric Corporation', 'Yokogawa Electric Corporation', 'Rockwell Automation, Inc.', 'Legrand SA', 'Socomec Group S.A.', 'Schweitzer Engineering Laboratories, Inc.', 'Janitza electronics GmbH', 'Accuenergy Inc.', 'OMICRON electronics GmbH', 'Huawei Technologies Co., Ltd.', 'Delta Electronics, Inc.', 'Vertiv Holdings Co.', 'Cisco Systems, Inc.'
Grid modernization initiatives are prompting utilities to replace legacy instrumentation with advanced monitoring solutions, enabling improved visibility, reliability, and operational efficiency across transmission and distribution networks. This modernization creates sustained demand for power monitoring systems as operators prioritize real time analytics, fault detection, and predictive maintenance to manage increasingly complex grids. The focus on integrating distributed energy resources and accommodating two way power flows further elevates the need for granular monitoring, making investment in comprehensive monitoring platforms a strategic priority for infrastructure upgrades and system resilience.
Edge Analytics Adoption: Adoption of edge analytics is driving the power monitoring market by shifting intelligence closer to assets, enabling low latency insights and decision making. Onsite processing reduces reliance on central systems, optimizes bandwidth, and facilitates predictive maintenance with faster fault detection. Integration with IoT sensors plus legacy equipment enhances situational awareness for operators while supporting regulatory compliance. Vendors emphasize scalable edge platforms and interoperable protocols to deliver resilient monitoring, improve operational efficiency, and enable granular control across distributed energy and industrial installations.
Why does Asia Pacific Dominate the Global Power Monitoring Market? |@12


Want to customize this report? This report can be personalized according to your needs. Our analysts and industry experts will work directly with you to understand your requirements and provide you with customized data in a short amount of time. We offer $1000 worth of FREE customization at the time of purchase.
Feedback From Our Clients


 USA (+1) 351-333-4748

