Power Generation Market Size, Share, and Growth Analysis

Global Power Generation Market

Power Generation Market By Type (Hydroelectricity, Fossil Fuel Electricity), By End-User (Industrial, Commercial), By Source (Conventional/Non-Renewable Source, Renewable Source), By Grid (Off Grid, On Grid), By Region - Industry Forecast 2025-2032


Report ID: SQMIG55E2079 | Region: Global | Published Date: May, 2025
Pages: 199 |Tables: 67 |Figures: 70

Format - word format excel data power point presentation

Power Generation Market Insights

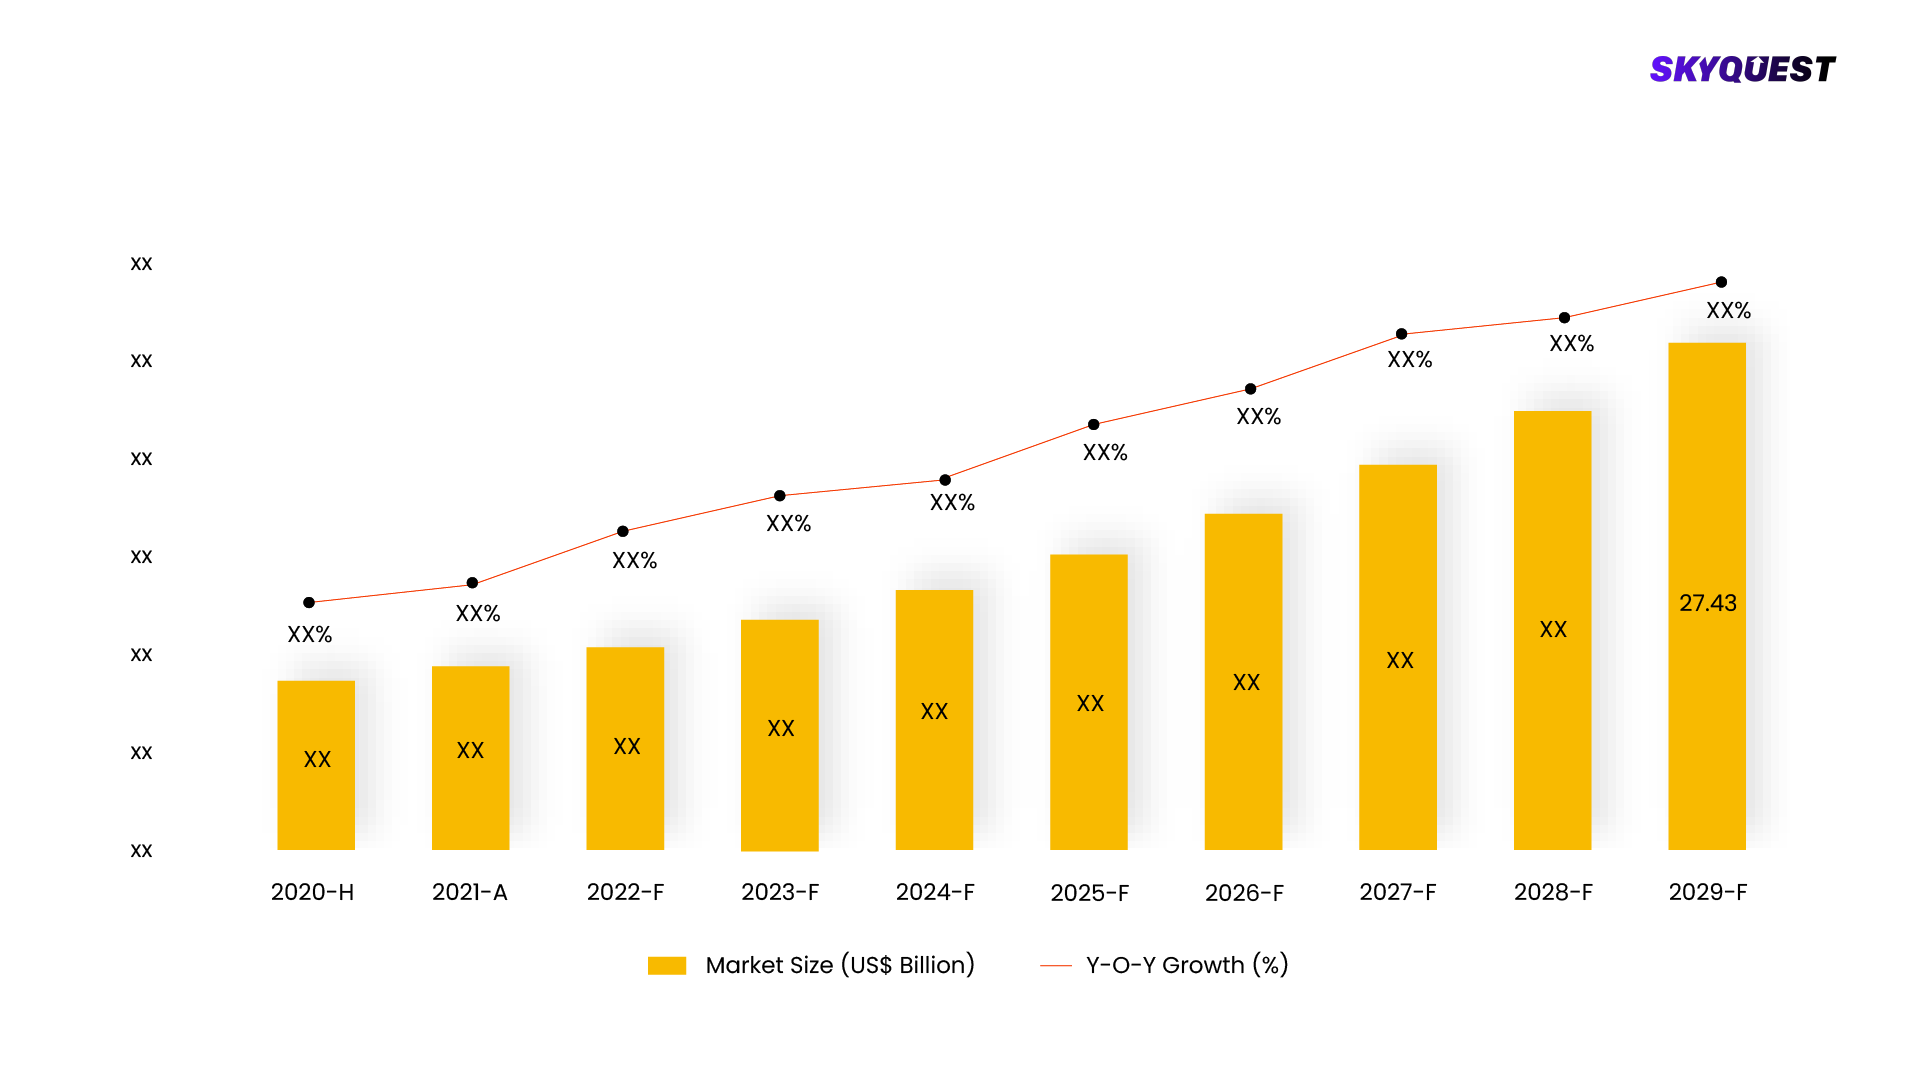
Global Power Generation Market size was valued at USD 2.2 trillion in 2023 and is poised to grow from USD 2.38 trillion in 2024 to USD 4.55 trillion by 2032, growing at a CAGR of 8.4% during the forecast period (2025-2032).

One of the key drivers of the global power generation market is the shift towards cleaner fuels. This is largely driven by the imperative to combat climate change and lower emissions of greenhouse gases. Governments globally are putting in place enabling policies and incentives for the use of renewable energy, which has spurred heavy investment in technologies like solar, wind, and hydroelectric energy. For example, the International Energy Agency (IEA) documents that renewable energy capacity grew by 700 gigawatts in 2024, representing a record 22nd successive annual rise. The growth not only adds to the sustainability of the environment but also supports the trend towards diversification of energy mix and energy security at the international level.

One of the main drivers of the power generation market is technological innovation, especially renewable energy technologies and energy storage. There has been spectacular price reduction with innovations, specifically 99% in the cost of solar panels over a single generation, thus making renewable energy economically viable compared to conventional fossil fuels. As the price of renewable energy infrastructure continues to fall, conventional energy sources become more expensive, leading the energy sector towards cleaner options. This technological advancement allows renewable energy to supply increasing global electricity needs, transforming the energy sector and diminishing dependence on fossil fuels.

What role does AI Play in Improving Energy Forecasting for Renewable Energy Integration?

The global power generation market is influenced and is now a place for massive transformation by artificial intelligence towards becoming more efficient, reliable, and sustainable. Very often, one of those outcomes is found in predictive maintenance, where data from both sensors and equipment are analyzed to predict possible failures to soon take preventive measures. With this, there can be a reduction in unplanned downtimes of as much as 50% and a maintenance cost reduction of anywhere from 10 to 40%, making it more reliable in its generation and even in preserving some cash. Energy forecasting is another. AI becomes relevant for the integration of renewable energy power sources. It improves the prediction of renewable energy outputs so that management of the grid is easier and less dependency on fossil fuels is promoted as AI processes inherent volumes of data. This is yet another advancement in the sustainability agenda as it optimizes the clean energy initiative.

In 2024, China made a key milestone in the energy sector through a record clean energy share of 44% in its power generation. It was fueled through massive investments made in renewable forms, with 12% share of solar energy, 11% of wind energy, 15% from hydropower, and 5% share of nuclear power. China had installed 19 GW of solar, 3 GW of wind, and 1.2 GW of nuclear power in the month of May 2024 alone. This fast growth reflects China's determination to shift towards a more diversified and sustainable energy mix.

How do Startups Address Energy Intermittency and Grid Stability Challenges?

The global power generation industry is witnessing a massive surge in new-age innovative startups redefining the energy sector. These firms are leading cutting-edge innovations in overcoming energy inefficiency, sustainability, and reliability. Startups are pursuing a variety of solutions ranging from energy storage technologies, renewable energy production techniques, to smart grids. Their innovations are solving pivotal issues such as energy intermittency, grid stability, and reducing dependence on dirty, unsustainable power sources.

Established in the year 2022, Founded by former SpaceX rocket scientist Brad Hartwig, Arbor focuses on converting organic waste into affordable energy using oxy-combustion technology derived from rocket engines. Arbor's lead product is a shipping container-sized energy system that produces five megawatts of power per year, enough to fuel about 4,000 homes. The technology employs oxy-combustion technology to transform organic waste into energy, which traps and stores the resulting carbon dioxide. This is not only an energy production process but also clean water, which can be recycled, and this solves both energy generation and water shortage issues. Arbor's pioneering use of oxy-combustion technology, initially designed for rocket engines, marks a substantial leap forward in waste-to-energy conversion. Arbor's system proves its mettle before the energy and waste management solutions it can offer through the whole capture and sequestration of carbon dioxide gas at the combustion stage. In consonance with worldwide efforts driving towards greenhouse gas emission reduction themes, this innovation bodes well further, and it urges circular economy principles into practice.

Established in the year 2015, Mocean Energy is a Scottish company developing wave energy converters (WECs) to harness energy from ocean waves. The company has received funding through the Wave Energy Scotland Novel Wave Energy Converter calls to develop small-scale prototypes. Mocean Energy's main product is the Blue X wave energy converter, a 10kW-rated power device that was tested at the European Marine Energy Centre (EMEC) in 2021. The Blue X is a hinged-raft attenuator WEC that bends under passing waves, transducing motion into electrical power. Its self-referenced nature removes the requirement for reaction mooring, and it can be deployed in deep waters as well as enhancing survivability in large waves. Mocean's innovation of the Blue X WEC is a major breakthrough in wave energy technology. The device's self-referencing and novel geometry improve survivability and performance, overcoming issues of previous wave energy converters. With the use of a lightweight modular generator designed in collaboration with CGEN Engineering and the University of Edinburgh, Mocean has enhanced scalability and maintenance, bringing it closer to commercialization in tapping wave energy.

Established in 2018, Spin-off from the Massachusetts Institute of Technology (MIT), Commonwealth Fusion Systems is focused on creating real fusion energy by developing a compact fusion power plant in accordance with the ARC tokamak design. The most prominent project of the company is the ARC fusion reactor, compact tokamak design that uses high-temperature superconducting magnets to create the conditions required for fusion. Using these high-tech magnets, ARC hopes to generate more energy than it uses, opening the door to commercial fusion power plants. Commonwealth Fusion Systems' exploitation of high-temperature superconducting magnets is a breakthrough in fusion energy research. They enable higher-temperature magnetic fields of greater strength, shrinking the size and cost of fusion reactors. This innovation moves fusion energy nearer to viable application, promising the possibility of a virtually limitless and clean energy source.

Market snapshot - 2025-2032

Global Market Size

USD 2.2 trillion

Largest Segment

Hydroelectric

Fastest Growth

Solar

Growth Rate

8.4% CAGR

Global Power Generation Market ($ Bn)
Country Share by Asia Pacific (%)

To get more reports on the above market click here to Buy The Report

Power Generation Market Segments Analysis

Global Power Generation Market is segmented by Type, End-User, Source, Grid and region. Based on Type, the market is segmented into Hydroelectricity, Fossil Fuel Electricity, Nuclear Electricity, Solar Electricity, Wind Electricity, Geothermal Electricity, Biomass Electricity and Other Electricity. Based on End-User, the market is segmented into Industrial, Commercial, Residential and Transportation. Based on Source, the market is segmented into Conventional/Non-Renewable Source and Renewable Source. Based on Grid, the market is segmented into Off Grid and On Grid. Based on region, the market is segmented into North America, Europe, Asia Pacific, Latin America and Middle East & Africa.

How does Hydroelectric Power Help in Maintaining Grid Stability?

Hydroelectric power remains a dominant factor in the global power generation market due to its reliability, efficiency, and established infrastructure. Today's innovations are directed toward enhancing turbine technology, increasing energy storage capacity, and incorporating small modular hydro plants that minimize environmental effects. Hydroelectric facilities, particularly large dams, offer base-load power that is stable and allows for energy storage through pumped hydro storage. Its predominance is based on its capability to generate a high volume of inexpensive, renewable energy and, in addition, contribute to the stability of the grid as well as its very low carbon footprint compared to generation based on fossil fuels, hence being at the forefront of sustainable energy transformation.

Solar power is likely to be the most rapidly expanding part of the global power generation market as costs decline, technology improves, and demand for clean energy grows. Its ability to scale, along with government incentives and the demand for sustainability, makes solar a prime solution to mitigate carbon emissions and address energy demands.

Why is the Industrial Sector a Dominant Force in the Global Power Generation Market?

The industrial segment in the global power generation market is going through a massive innovation phase with improved energy efficiency, automation, and incorporation of renewable sources. Industrial plants are becoming more and more inclined toward combined heat and power (CHP) units, sophisticated turbines, and waste-to-energy systems to cut costs of operation and carbon emissions. The industrial sector holds a lion's share of the market as it has the highest energy consumption requirements, creating demand for effective and economical power solutions. Moreover, manufacturing, oil and gas, and mining industries demand constant, uninterrupted energy to power production activities. The drive toward sustainability and independence from energy sources also increases the industrial vertical of power generation.

The residential vertical is set to be the fastest-growing in the global power generation market due to the increasing adoption of solar panels, home energy storage systems, and smart grid technologies. Skyrocketing energy prices, rising concerns for the environment, and new incentives from the government are compelling homeowners more toward the move to renewable, decentralized energy systems that promise savings and sustainability.

Global Power Generation Market By Type (%)

To get detailed analysis on other segments, Request For Free Sample Report

Power Generation Market Regional Insights

How is Asia Pacific Contributing to the Growth of the Global Power Generation Market?

The Asia Pacific is among the prime engines of growth of the global power generation market, driven by fast industrialization, urbanization, and booming energy demand. China and India are leading huge investments in the renewable sources of energy, like solar and wind, along with increasing coal and natural gas facilities. Government backing for clean power, energy security, and building infrastructure, allied with advances in technology, turns Asia Pacific into the largest as well as highest-growing market region in global power generation.

Japan is a major driver in the Asia Pacific’s power generation market, with a strong focus on renewable energy and nuclear power. Since the Fukushima disaster, Japan has been moving towards diversification of energy, ramping up investment in solar, wind, and geothermal energy. Japan is also developing energy efficiency technologies and modernizing grids, with a focus on cutting down on fossil fuels while ensuring energy security and sustainability.

South Korea is in the process of switching to cleaner energy supplies, with major efforts towards renewable power generation, including solar and wind. South Korea has set ambitious targets to eliminate coal and increase nuclear and hydrogen power. Technological innovations in smart grids and energy storage facilities by South Korea also drive its power generation market growth, with implications for both energy security and sustainability.

Singapore, a regional leader in Asia Pacific’s power generation market, is looking at solar power as the prime renewable energy source due to its limited land for such large-scale projects. The government's agenda consists of bold city solar take-up, energy storage, and smart grids. Singapore is also looking into hydrogen and offshore floating solar technology to serve its energy needs and cut carbon emissions, playing a pivotal role in the region's shift to clean energy.

Indonesia is committed to diversifying its energy mix, with significant investments in geothermal, hydro, and solar power. Being the largest economy in Southeast Asia, it is confronted with increasing energy demand, which brings about initiatives in increasing the capacity of renewable energy. Indonesia aims to reduce dependence on coal while upgrading its grid system, developing clean energy, and managing environmental issues as part of long-term energy plans to be able to achieve sustainable growth and access to energy.

What Factors are Driving the Growth of the Power Generation Market in North America?

North America is a key player in the global power generation market, fueled by innovation, a transition to cleaner forms of energy, and strong infrastructure. The U.S. is at the forefront in renewable energy investment, with a special focus on wind and solar energy, with hydroelectric energy being a priority in Canada. Mexico is adding more emphasis on renewables and grid modernization. Government policies, including tax credits and carbon reduction targets, are driving the shift to a more sustainable and diversified energy mix in the region.

The United States leads the North America’s power generation market with major investments in renewable energy sources, especially solar and wind energy. The nation has increased onshore and offshore wind farms' capacity and solar projects at an accelerated rate. U.S. policies, for example, tax credits for clean energy, are driving the movement away from natural gas and coal to renewable energy. The U.S. also emphasizes grid modernization, energy storage, and technology advancements to improve energy security and sustainability.

Canada is largely dependent on hydroelectricity, and most of its electricity is generated from hydroelectric power. It is also advancing in the areas of wind, solar, and biomass energy. Canada's natural resources are plentiful and the country is focused on mitigating greenhouse gas emissions, thus there has been an investment in clean energy infrastructure. With an emphasis on sustainability, Canada is seeking to decarbonize its energy market, utilizing clean technologies to fund long-term energy requirements and to help lead the world toward a greener path of power development.

What is Europe’s Approach to Renewable Energy and Decarbonization in the Power Generation Market?

Europe is leading the global power generation market with its emphasis on decarbonization and renewable energy. The European Union's Green Deal and aggressive climate targets have ignited investment in solar, wind, and biomass energy. Germany, Spain, and Denmark are among the top countries for wind power, while Norway and Sweden focus on hydropower. Energy storage, smart grids, and nuclear energy are also a must for securing grid stability as well as securing sustainability in the power generation of the region.

Germany is a leader in renewable energy, particularly wind and solar power, due to its Energiewende policy, which promotes a transition to a low-carbon energy system. The country is phasing out nuclear and coal, with substantial investments in wind farms and solar photovoltaic systems. Germany's pledge to decarbonize its energy mix, coupled with energy storage innovation and grid modernization, is at the forefront of influencing Europe's renewable energy future and decreasing dependence on fossil fuels.

The United Kingdom has made significant strides in renewable energy, particularly offshore wind power, becoming a global leader in this sector. The UK has significantly cut back on the use of coal, relying on natural gas and renewables to power its economy. Incentives from the government, including subsidies on clean energy initiatives and carbon-cutting targets, are driving the transition towards a cleaner energy system faster. The UK is also investing heavily in nuclear power and energy storage to provide grid stability and sustainability.

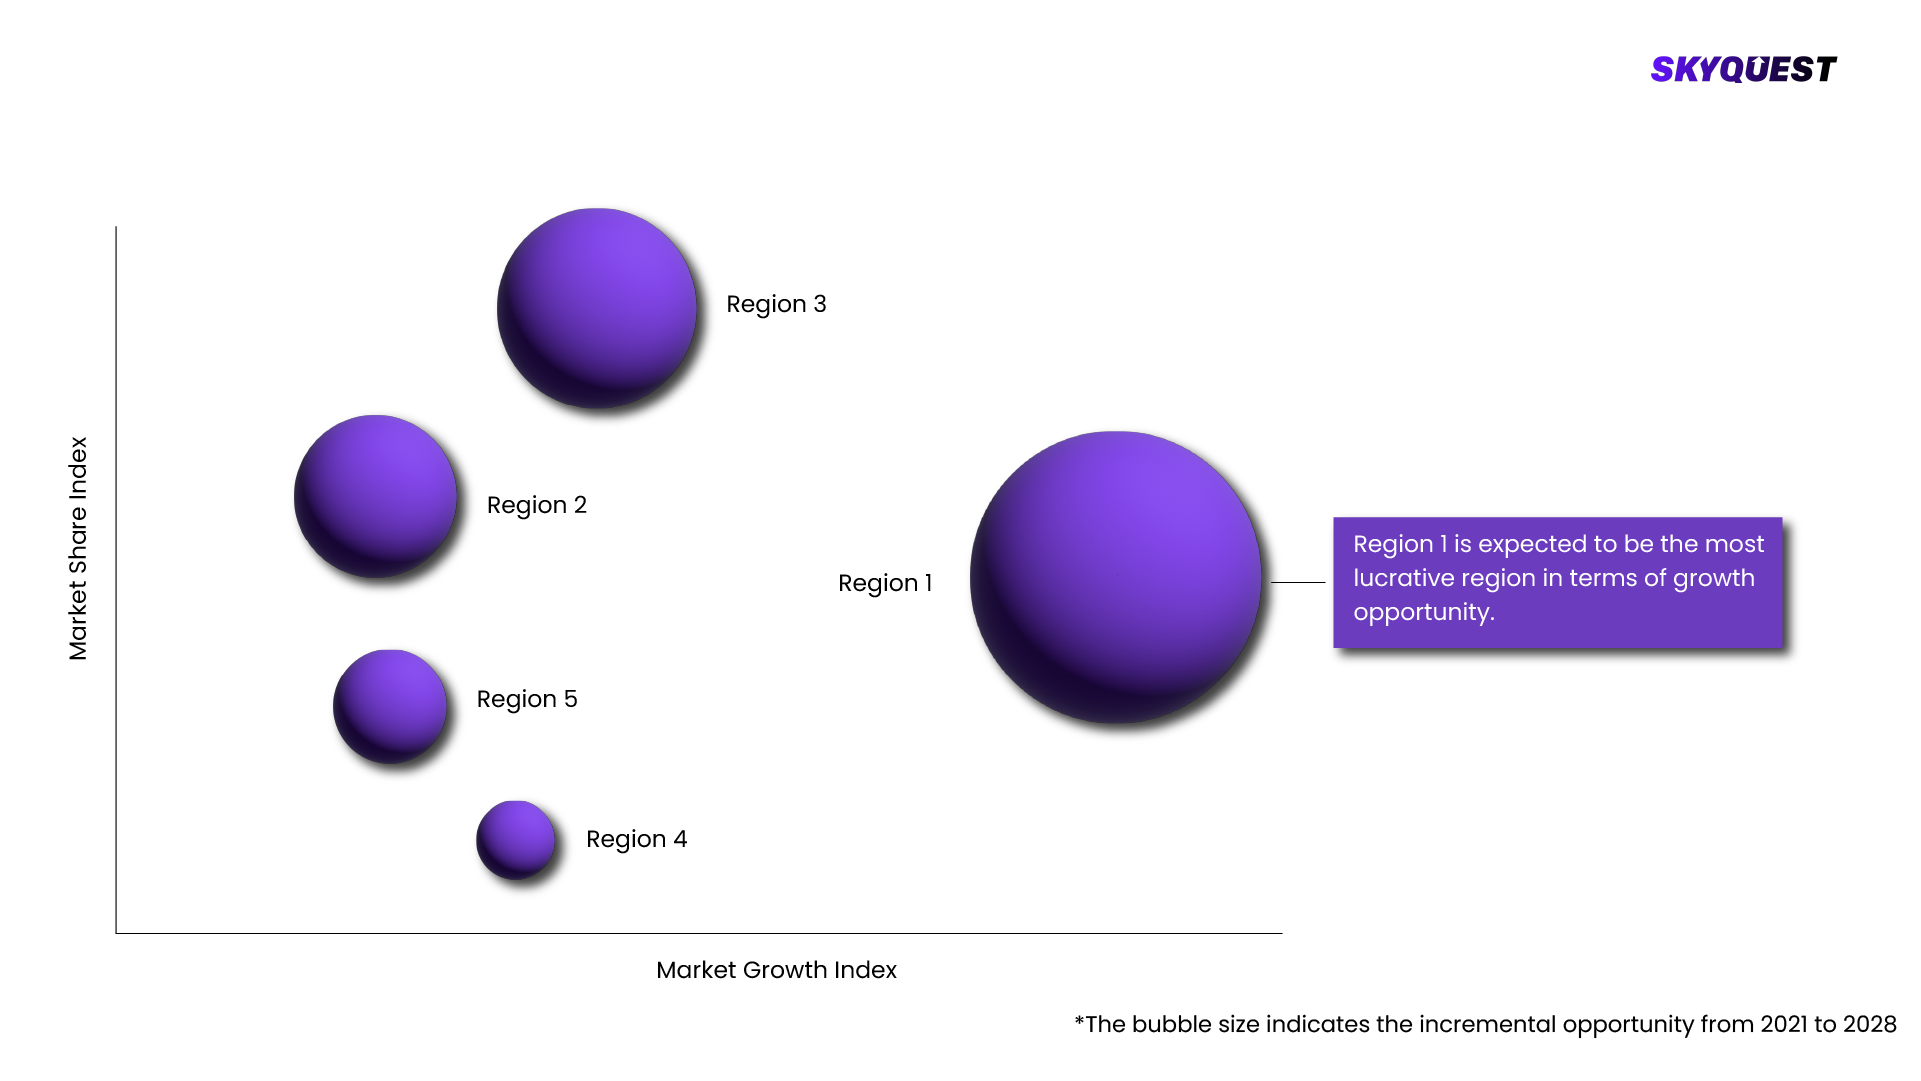
Global Power Generation Market By Geography
  • Largest
  • Fastest

To know more about the market opportunities by region and country, click here to
Buy The Complete Report

Power Generation Market Dynamics

Power Generation Market Drivers

Increasing Demand for Renewable Energy

  • As world recognition of climate change increases, renewable energy sources such as solar, wind, and hydro are being increasingly demanded. Governments around the world are becoming more stringent on emissions and promoting incentives for the use of renewable energy schemes. This movement toward cleaner energy is fueling remarkable growth in the world power generation market.

Technological Advancements in Energy Storage

  • Innovations in energy storage technologies, such as batteries and grid-scale storage systems, are crucial for integrating renewable energy into the grid. These developments improve the stability and effectiveness of power generation through the storage of excess power for future use, thereby facilitating a consistent shift towards renewable sources of power and improving grid efficiency.

Power Generation Market Restraints

Grid Infrastructure Limitations

  • Existing grid infrastructure in many regions is outdated and ill-equipped to handle the integration of intermittent renewable energy sources like wind and solar. The absence of modernization and capacity building in grid networks restricts the effective supply of renewable energy, slowing down the shift towards cleaner power generation and constraining market development.

Environmental and Social Impacts

  • Large-scale power generation projects, especially hydroelectric dams and wind farms, can face opposition due to environmental and social concerns. They consist of ecosystem disturbance, land use conflict, and displacement of indigenous people. These are likely to slow down project approvals and raise costs, serving as a hindrance to the global power generation market growth.

Request Free Customization of this report to help us to meet your business objectives.

Power Generation Market Competitive Landscape

The competitive landscape of the global power generation market is shaped by key players in both conventional and renewable energy sectors. Global leaders in the industry include General Electric (GE), Siemens Energy, Mitsubishi Power, and Vestas Wind Systems. They prioritize technological innovation, sustainable energy solutions, and geographic growth to ensure competitive positioning. GE, for example, prioritizes digital power technologies and renewable energy integration, while Siemens Energy prioritizes green hydrogen and offshore wind ventures. Vestas, a major wind turbine manufacturer, invests heavily in R&D for improving turbine efficiency, aiming to lead the global wind energy market.

Top Player’s Company Profiles

  • General Electric (US) 
  • Siemens Energy (Germany) 
  • Mitsubishi Power (Japan) 
  • Orsted (Denmark) 
  • ABB Ltd. (Switzerland) 
  • Schneider Electric (France) 
  • Enel SpA (Italy) 
  • NextEra Energy (US) 
  • EDF Group (France) 
  • First Solar (US) 
  • Tata Power (India) 
  • Brookfield Renewable Partners (Canada) 
  • NTPC Limited (India) 
  • Adani Power (India) 
  • AGL Energy (Australia) 
  • RWE (Germany) 
  • Engie (France)

Recent Developments in Power Generation Market

  • In March 2025, General Electric (GE) has unveiled a pioneering gas turbine technology that boosts efficiency by 5%, meaning power generation performance is greatly enhanced and carbon emissions are lessened. The technology further serves to reinforce GE's continued focus on cleaner energy options. GE further continues to increase its renewable energy base, with investments made in solar and wind energy to increase sustainability.
  • In February 2025, Siemens Energy unveiled plans to construct the world’s largest green hydrogen production facility in Germany. This plant will center on upscaling renewable hydrogen production to enable industries to decarbonize their operations. The project is also consistent with Siemens Energy's overall strategy of becoming a net-zero emissions company by 2050 and also supporting Germany's green energy transition drive.
  • In January 2025, Vestas Wind Systems installed its new 15 MW offshore wind turbine off the coast of Denmark successfully, a key achievement in the generation of offshore wind power. The turbine has the latest technology to maximize energy production and efficiency. Vestas wants to spur Europe's renewable energy ambitions by putting its high-performance turbines on the global map, dominating the wind energy industry.

Power Generation Key Market Trends

Power Generation Market SkyQuest Analysis

SkyQuest’s ABIRAW (Advanced Business Intelligence, Research & Analysis Wing) is our Business Information Services team that Collects, Collates, Correlates, and Analyses the Data collected by means of Primary Exploratory Research backed by robust Secondary Desk research.

As per SkyQuest analysis, the global power generation industry is undergoing a major transformation driven by a combination of policy incentives, technological advancements, and growing demand for renewable energy sources. Acceptance of renewable energy is visible in the unprecedented investment linked with advancements in solar photovoltaics, offshore wind, and large hydrogeneration, with ancillary industries evolving around energy storage and grid resilience.

AI is also crucial in enhancing energy prediction, better grid management, and the ability to integrate renewables. Startups and innovations in waste-to-energy and fusion power technologies also underline the innovative strategy transforming the industry. With Asian-Pacific, North American, and European regions making investments in renewables infrastructure, power generation in the future will undoubtedly be centered around sustainability, efficiency, and resiliency despite climate challenges.

Report Metric Details
Market size value in 2023 USD 2.2 trillion
Market size value in 2032 USD 4.55 trillion
Growth Rate 8.4%
Base year 2024
Forecast period 2025-2032
Forecast Unit (Value) USD Trillion
Segments covered
  • Type
    • Hydroelectricity
    • Fossil Fuel Electricity
    • Nuclear Electricity
    • Solar Electricity
    • Wind Electricity
    • Geothermal Electricity
    • Biomass Electricity
    • Other Electricity
  • End-User
    • Industrial
    • Commercial
    • Residential
    • Transportation
  • Source
    • Conventional/Non-Renewable Source
    • Renewable Source
  • Grid
    • Off Grid
    • On Grid
Regions covered North America (US, Canada), Europe (Germany, France, United Kingdom, Italy, Spain, Rest of Europe), Asia Pacific (China, India, Japan, Rest of Asia-Pacific), Latin America (Brazil, Rest of Latin America), Middle East & Africa (South Africa, GCC Countries, Rest of MEA)
Companies covered
  • General Electric (US) 
  • Siemens Energy (Germany) 
  • Mitsubishi Power (Japan) 
  • Orsted (Denmark) 
  • ABB Ltd. (Switzerland) 
  • Schneider Electric (France) 
  • Enel SpA (Italy) 
  • NextEra Energy (US) 
  • EDF Group (France) 
  • First Solar (US) 
  • Tata Power (India) 
  • Brookfield Renewable Partners (Canada) 
  • NTPC Limited (India) 
  • Adani Power (India) 
  • AGL Energy (Australia) 
  • RWE (Germany) 
  • Engie (France)
Customization scope

Free report customization with purchase. Customization includes:-

  • Segments by type, application, etc
  • Company profile
  • Market dynamics & outlook
  • Region


To get a free trial access to our platform which is a one stop solution for all your data requirements for quicker decision making. This platform allows you to compare markets, competitors who are prominent in the market, and mega trends that are influencing the dynamics in the market. Also, get access to detailed SkyQuest exclusive matrix.

Buy The Complete Report to read the analyzed strategies adopted by the top vendors either to retain or gain market share

Table Of Content

Executive Summary

Market overview

  • Exhibit: Executive Summary – Chart on Market Overview
  • Exhibit: Executive Summary – Data Table on Market Overview
  • Exhibit: Executive Summary – Chart on Power Generation Market Characteristics
  • Exhibit: Executive Summary – Chart on Market by Geography
  • Exhibit: Executive Summary – Chart on Market Segmentation
  • Exhibit: Executive Summary – Chart on Incremental Growth
  • Exhibit: Executive Summary – Data Table on Incremental Growth
  • Exhibit: Executive Summary – Chart on Vendor Market Positioning

Parent Market Analysis

Market overview

Market size

  • Market Dynamics
    • Exhibit: Impact analysis of DROC, 2021
      • Drivers
      • Opportunities
      • Restraints
      • Challenges
  • SWOT Analysis

KEY MARKET INSIGHTS

  • Technology Analysis
    • (Exhibit: Data Table: Name of technology and details)
  • Pricing Analysis
    • (Exhibit: Data Table: Name of technology and pricing details)
  • Supply Chain Analysis
    • (Exhibit: Detailed Supply Chain Presentation)
  • Value Chain Analysis
    • (Exhibit: Detailed Value Chain Presentation)
  • Ecosystem Of the Market
    • Exhibit: Parent Market Ecosystem Market Analysis
    • Exhibit: Market Characteristics of Parent Market
  • IP Analysis
    • (Exhibit: Data Table: Name of product/technology, patents filed, inventor/company name, acquiring firm)
  • Trade Analysis
    • (Exhibit: Data Table: Import and Export data details)
  • Startup Analysis
    • (Exhibit: Data Table: Emerging startups details)
  • Raw Material Analysis
    • (Exhibit: Data Table: Mapping of key raw materials)
  • Innovation Matrix
    • (Exhibit: Positioning Matrix: Mapping of new and existing technologies)
  • Pipeline product Analysis
    • (Exhibit: Data Table: Name of companies and pipeline products, regional mapping)
  • Macroeconomic Indicators

COVID IMPACT

  • Introduction
  • Impact On Economy—scenario Assessment
    • Exhibit: Data on GDP - Year-over-year growth 2016-2022 (%)
  • Revised Market Size
    • Exhibit: Data Table on Power Generation Market size and forecast 2021-2027 ($ million)
  • Impact Of COVID On Key Segments
    • Exhibit: Data Table on Segment Market size and forecast 2021-2027 ($ million)
  • COVID Strategies By Company
    • Exhibit: Analysis on key strategies adopted by companies

MARKET DYNAMICS & OUTLOOK

  • Market Dynamics
    • Exhibit: Impact analysis of DROC, 2021
      • Drivers
      • Opportunities
      • Restraints
      • Challenges
  • Regulatory Landscape
    • Exhibit: Data Table on regulation from different region
  • SWOT Analysis
  • Porters Analysis
    • Competitive rivalry
      • Exhibit: Competitive rivalry Impact of key factors, 2021
    • Threat of substitute products
      • Exhibit: Threat of Substitute Products Impact of key factors, 2021
    • Bargaining power of buyers
      • Exhibit: buyers bargaining power Impact of key factors, 2021
    • Threat of new entrants
      • Exhibit: Threat of new entrants Impact of key factors, 2021
    • Bargaining power of suppliers
      • Exhibit: Threat of suppliers bargaining power Impact of key factors, 2021
  • Skyquest special insights on future disruptions
    • Political Impact
    • Economic impact
    • Social Impact
    • Technical Impact
    • Environmental Impact
    • Legal Impact

Market Size by Region

  • Chart on Market share by geography 2021-2027 (%)
  • Data Table on Market share by geography 2021-2027(%)
  • North America
    • Chart on Market share by country 2021-2027 (%)
    • Data Table on Market share by country 2021-2027(%)
    • USA
      • Exhibit: Chart on Market share 2021-2027 (%)
      • Exhibit: Market size and forecast 2021-2027 ($ million)
    • Canada
      • Exhibit: Chart on Market share 2021-2027 (%)
      • Exhibit: Market size and forecast 2021-2027 ($ million)
  • Europe
    • Chart on Market share by country 2021-2027 (%)
    • Data Table on Market share by country 2021-2027(%)
    • Germany
      • Exhibit: Chart on Market share 2021-2027 (%)
      • Exhibit: Market size and forecast 2021-2027 ($ million)
    • Spain
      • Exhibit: Chart on Market share 2021-2027 (%)
      • Exhibit: Market size and forecast 2021-2027 ($ million)
    • France
      • Exhibit: Chart on Market share 2021-2027 (%)
      • Exhibit: Market size and forecast 2021-2027 ($ million)
    • UK
      • Exhibit: Chart on Market share 2021-2027 (%)
      • Exhibit: Market size and forecast 2021-2027 ($ million)
    • Rest of Europe
      • Exhibit: Chart on Market share 2021-2027 (%)
      • Exhibit: Market size and forecast 2021-2027 ($ million)
  • Asia Pacific
    • Chart on Market share by country 2021-2027 (%)
    • Data Table on Market share by country 2021-2027(%)
    • China
      • Exhibit: Chart on Market share 2021-2027 (%)
      • Exhibit: Market size and forecast 2021-2027 ($ million)
    • India
      • Exhibit: Chart on Market share 2021-2027 (%)
      • Exhibit: Market size and forecast 2021-2027 ($ million)
    • Japan
      • Exhibit: Chart on Market share 2021-2027 (%)
      • Exhibit: Market size and forecast 2021-2027 ($ million)
    • South Korea
      • Exhibit: Chart on Market share 2021-2027 (%)
      • Exhibit: Market size and forecast 2021-2027 ($ million)
    • Rest of Asia Pacific
      • Exhibit: Chart on Market share 2021-2027 (%)
      • Exhibit: Market size and forecast 2021-2027 ($ million)
  • Latin America
    • Chart on Market share by country 2021-2027 (%)
    • Data Table on Market share by country 2021-2027(%)
    • Brazil
      • Exhibit: Chart on Market share 2021-2027 (%)
      • Exhibit: Market size and forecast 2021-2027 ($ million)
    • Rest of South America
      • Exhibit: Chart on Market share 2021-2027 (%)
      • Exhibit: Market size and forecast 2021-2027 ($ million)
  • Middle East & Africa (MEA)
    • Chart on Market share by country 2021-2027 (%)
    • Data Table on Market share by country 2021-2027(%)
    • GCC Countries
      • Exhibit: Chart on Market share 2021-2027 (%)
      • Exhibit: Market size and forecast 2021-2027 ($ million)
    • South Africa
      • Exhibit: Chart on Market share 2021-2027 (%)
      • Exhibit: Market size and forecast 2021-2027 ($ million)
    • Rest of MEA
      • Exhibit: Chart on Market share 2021-2027 (%)
      • Exhibit: Market size and forecast 2021-2027 ($ million)

KEY COMPANY PROFILES

  • Competitive Landscape
    • Total number of companies covered
      • Exhibit: companies covered in the report, 2021
    • Top companies market positioning
      • Exhibit: company positioning matrix, 2021
    • Top companies market Share
      • Exhibit: Pie chart analysis on company market share, 2021(%)

Methodology

For the Power Generation Market, our research methodology involved a mixture of primary and secondary data sources. Key steps involved in the research process are listed below:

1. Information Procurement: This stage involved the procurement of Market data or related information via primary and secondary sources. The various secondary sources used included various company websites, annual reports, trade databases, and paid databases such as Hoover's, Bloomberg Business, Factiva, and Avention. Our team did 45 primary interactions Globally which included several stakeholders such as manufacturers, customers, key opinion leaders, etc. Overall, information procurement was one of the most extensive stages in our research process.

2. Information Analysis: This step involved triangulation of data through bottom-up and top-down approaches to estimate and validate the total size and future estimate of the Power Generation Market.

3. Report Formulation: The final step entailed the placement of data points in appropriate Market spaces in an attempt to deduce viable conclusions.

4. Validation & Publishing: Validation is the most important step in the process. Validation & re-validation via an intricately designed process helped us finalize data points to be used for final calculations. The final Market estimates and forecasts were then aligned and sent to our panel of industry experts for validation of data. Once the validation was done the report was sent to our Quality Assurance team to ensure adherence to style guides, consistency & design.

Analyst Support

Customization Options

With the given market data, our dedicated team of analysts can offer you the following customization options are available for the Power Generation Market:

Product Analysis: Product matrix, which offers a detailed comparison of the product portfolio of companies.

Regional Analysis: Further analysis of the Power Generation Market for additional countries.

Competitive Analysis: Detailed analysis and profiling of additional Market players & comparative analysis of competitive products.

Go to Market Strategy: Find the high-growth channels to invest your marketing efforts and increase your customer base.

Innovation Mapping: Identify racial solutions and innovation, connected to deep ecosystems of innovators, start-ups, academics, and strategic partners.

Category Intelligence: Customized intelligence that is relevant to their supply Markets will enable them to make smarter sourcing decisions and improve their category management.

Public Company Transcript Analysis: To improve the investment performance by generating new alpha and making better-informed decisions.

Social Media Listening: To analyze the conversations and trends happening not just around your brand, but around your industry as a whole, and use those insights to make better Marketing decisions.

$5,300

REQUEST FOR SAMPLE

Please verify that you're not a robot to proceed!
Want to customize this report? REQUEST FREE CUSTOMIZATION

FAQs

Global Power Generation Market size was valued at USD 941.16 Billion in 2023 poised to grow from USD 1,020.03 Billion in 2024 to USD 1,941.81 Billion by 2032, growing at a CAGR of 8.38% in the forecast period (2025-2032).

The competitive landscape of the global power generation market is shaped by key players in both conventional and renewable energy sectors. Global leaders in the industry include General Electric (GE), Siemens Energy, Mitsubishi Power, and Vestas Wind Systems. They prioritize technological innovation, sustainable energy solutions, and geographic growth to ensure competitive positioning. GE, for example, prioritizes digital power technologies and renewable energy integration, while Siemens Energy prioritizes green hydrogen and offshore wind ventures. Vestas, a major wind turbine manufacturer, invests heavily in R&D for improving turbine efficiency, aiming to lead the global wind energy market. 'General Electric (USA)', 'Siemens Energy (Germany)', 'Mitsubishi Power (Japan)', 'Vestas Wind Systems (Denmark)', 'Orsted (Denmark)', 'ABB Ltd. (Switzerland)', 'Schneider Electric (France)', 'Enel SpA (Italy)', 'NextEra Energy (USA)', 'Iberdrola (Spain)', 'Duke Energy (USA)', 'EDF Group (France)', 'First Solar (USA)', 'Tata Power (India)', 'Brookfield Renewable Partners (Canada)'

As world recognition of climate change increases, renewable energy sources such as solar, wind, and hydro are being increasingly demanded. Governments around the world are becoming more stringent on emissions and promoting incentives for the use of renewable energy schemes. This movement toward cleaner energy is fueling remarkable growth in the world power generation market.

Accelerating Shift to Renewable Energy: The global power generation market is undergoing a significant transformation, with a strong shift towards renewable energy sources such as solar, wind, and hydropower. Governments globally are spending big on clean energy infrastructure and providing incentives to minimize carbon footprints. Technologies such as innovative energy storage systems, new turbine designs, and solar panels are making renewables more efficient and reliable, putting them in the running as substitutes for fossil fuels towards a cleaner and sustainable energy future.

How is Asia Pacific Contributing to the Growth of the Global Power Generation Market?

Want to customize this report? This report can be personalized according to your needs. Our analysts and industry experts will work directly with you to understand your requirements and provide you with customized data in a short amount of time. We offer $1000 worth of FREE customization at the time of purchase.

logo-images

Feedback From Our Clients

Global Power Generation Market
Power Generation Market

Report ID: SQMIG55E2079

[email protected]
USA +1 351-333-4748

BUY NOW GET FREE SAMPLE