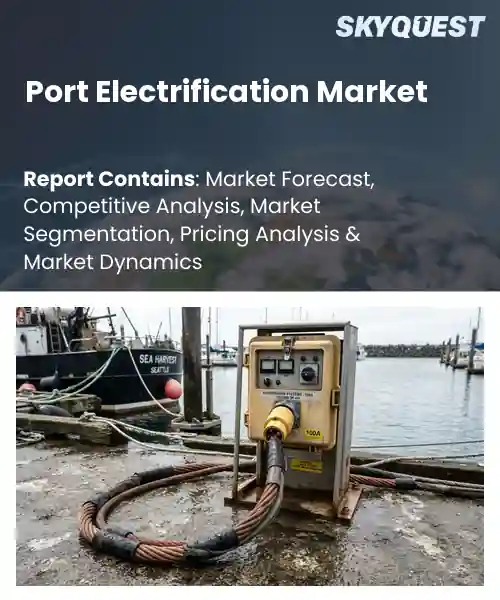
Port Electrification Market
Report ID: SQMIG20E2284
Report ID: SQMIG20E2284
[email protected]
USA +1 351-333-4748
Report ID:
SQMIG20E2284 |
Region:
Global |
Published Date: September, 2026
Pages:
157
|Tables:
126
|Figures:
77


Global Port Electrification Market size was valued at USD 2.51 Billion in 2024 and is poised to grow from USD 2.79 Billion in 2025 to USD 6.48 Billion by 2033, growing at a CAGR of 11.1% during the forecast period (2026-2033).
The global port electrification market comprises technologies and services that replace diesel‑generated shore power with grid‑based electricity for berthed vessels, thereby cutting emissions and fuel consumption. Its significance lies in the maritime sector’s contribution to air pollution, especially in densely populated coastal cities where diesel exhaust aggravates health risks. Growth has been propelled by stringent environmental regulations such as the European Union’s IMO 2020 sulfur cap and local zero‑emission port mandates in Rotterdam and Los Angeles. Over the past decade, ports have moved from pilot shore‑power installations to comprehensive electrified berths, illustrating a trajectory from experimental projects to commercial scale. The second key factor driving the market is the economic incentive that emerges when ports integrate smart grid management and renewable energy, which lowers electricity costs and creates revenue streams. When a terminal installs shore‑power connectors, ship owners can avoid fuel surcharge fees, while grid operators monetize excess solar or wind generation during periods. This relationship has spurred investments such as Singapore’s PSA International partnership with a local utility to supply 100 MW of renewable shore power, enabling vessels to halve diesel use. Consequently, the convergence of savings, regulatory compliance and sustainability goals unlocks growth opportunities across developed and emerging ports.
How is AI-driven automation influencing the adoption of port electrification solutions?
AI driven automation is reshaping how ports adopt electrification solutions. It provides real time data on vessel arrival, power demand and equipment usage, allowing operators to schedule shore power and electric cranes with precision. Today many terminals integrate sensor networks and machine learning to predict peak loads and to balance grid stress. This reduces reliance on diesel generators and improves energy efficiency. Early adopters report smoother transitions and lower operating costs. The market is moving from pilot projects to full scale rollouts as ports seek to meet environmental targets while maintaining throughput.Siemens June 2023, introduced an AI enabled shore power platform that automatically matches vessel power profiles with grid capacity, cutting connection time and boosting adoption of electrified berths across Europe. The system integrates predictive analytics that streamline berth allocation and reduce emissions, encouraging more ports to invest in full electric infrastructure.
Market snapshot - (2026-2033)
Global Market Size
USD 2.51 Billion
Largest Segment
Shore Power Systems
Fastest Growth
Charging Infrastructure
Growth Rate
11.1% CAGR
To get more insights on this market click here to Request a Free Sample Report
Global port electrification market is segmented by electrification component, power source, port type, application and region. Based on electrification component, the market is segmented into Shore Power Systems, Electric Cargo Handling Equipment, Electric Cranes, Electric Yard Trucks, Electric Terminal Tractors, Charging Infrastructure and Others. Based on power source, the market is segmented into Grid Electricity, Renewable Energy and Hybrid Power. Based on port type, the market is segmented into Container Ports, Bulk Cargo Ports, Ro-Ro Ports, Passenger Ports, General Cargo Ports and Others. Based on application, the market is segmented into Cargo Handling, Vessel Operations, Port Vehicles, Port Buildings and Facilities and Others. Based on region, the market is segmented into North America, Europe, Asia Pacific, Latin America and Middle East & Africa.
Shore Power Systems segment dominates because it directly replaces diesel auxiliary engines, delivering immediate emission reductions and operational cost savings for vessels at berth. Its ability to integrate with existing grid infrastructure makes it an attractive first step solution for ports seeking compliance with environmental regulations, and its proven reliability builds confidence among shipowners, spurring widespread adoption. The shift also supports global decarbonisation goals and reduces noise pollution, enhancing community relations around port areas.
However, electric cargo handling equipment is witnessing the strongest growth momentum because automation and low carbon logistics drive demand for electric forklifts, pallet trucks and straddle carriers. Innovations in battery technology and the need for quieter, cleaner yard operations accelerate its uptake, opening new revenue streams for equipment manufacturers and expanding the overall market opportunity.
Renewable Energy segment leads because ports are leveraging onsite solar and wind generation to offset grid dependence, reducing carbon footprints while enhancing energy resilience. This approach aligns with sustainability pledges and offers long term cost stability, encouraging ports to invest in renewable assets as core components of their electrification strategies. It also reduces exposure to volatile electricity tariffs and demonstrates leadership in the maritime sector, attracting green financing and stakeholder support.
On the other hand, hybrid power is emerging as the key high growth area because it blends renewable inputs with conventional grid supply, ensuring uninterrupted power for critical operations during variable generation periods. The flexibility of hybrid systems mitigates reliability concerns, prompting ports to adopt them as transitional solutions that accelerate broader clean energy adoption across the maritime ecosystem.
To get detailed segments analysis, Request a Free Sample Report
Asia Pacific leads the market thanks to a confluence of advanced maritime infrastructure, proactive government policies, and strong industrial ecosystems that prioritize low‑carbon operations. The region benefits from early adoption of electric shore power standards, substantial investment in grid capacity at major terminals, and collaborative research initiatives between port authorities and technology providers. High freight volumes and dense shipping lanes create compelling business cases for electrification, while regional trade agreements encourage uniformity in standards. Competitive manufacturing bases in the region also supply critical components, reinforcing a virtuous cycle of supply and demand that entrenches Asia Pacific’s leadership position.
Japan Port Electrification Market
Port Electrification Market in Japan is propelled by rigorous environmental regulations and a national commitment to decarbonize maritime activities. Leading ports have integrated sophisticated shore power systems that align with stringent efficiency criteria, fostering close collaboration between utilities and terminal operators. The presence of strong engineering firms accelerates technology customization, while public‑private partnerships support pilot projects that demonstrate operational benefits. Stakeholder consensus around sustainability drives continuous upgrades, reinforcing Japan’s role as a benchmark for reliable and scalable electrification solutions.
South Korea Port Electrification Market
Port Electrification Market in South Korea is driven by a strategic focus on green logistics and the nation’s ambition to become a hub for clean maritime technology. Major ports have embraced electric shore power as a core element of their modernization plans, leveraging robust grid infrastructure and supportive policy frameworks. Close coordination between shipbuilders, equipment manufacturers, and port authorities enables rapid deployment of compatible systems. Emphasis on research and development cultivates innovative solutions that enhance energy efficiency and reduce emissions, positioning South Korea as a fast‑moving participant in the global transition.
Europe’s rapid expansion stems from a unified regulatory environment, ambitious climate objectives, and substantial public investment in sustainable port infrastructure. The European Union’s emphasis on reducing emissions across the supply chain has spurred harmonized standards that simplify cross‑border implementation. National governments complement these efforts with incentives and funding mechanisms that encourage ports to adopt shore power and ancillary technologies. Strong collaboration among ports, energy providers, and technology firms fosters innovation, while the region’s dense network of high‑traffic ports creates economies of scale that accelerate rollout. These combined forces position Europe as a dynamic leader in advancing port electrification.
Germany Port Electrification Market
Port Electrification Market in Germany benefits from a robust policy framework that mandates low‑emission operations at key maritime gateways. Leading terminals have integrated sophisticated shore power solutions supported by a reliable electricity grid and a well‑established renewable energy mix. Close cooperation between port authorities, utility companies, and engineering firms drives tailored system designs that meet both operational and environmental goals. Ongoing commitment to research and standardization reinforces Germany’s status as a dominant force shaping best practices across the continent.
United Kingdom Port Electrification Market
Port Electrification Market in United Kingdom is experiencing swift growth due to decisive governmental directives and a proactive industry coalition focused on decarbonization. Major ports have prioritized the installation of shore power infrastructure, aligning with national emissions targets and leveraging the country’s strong renewable energy generation capacity. Collaborative pilots involving vessel operators and technology suppliers showcase operational viability, encouraging broader adoption. The United Kingdom’s emphasis on innovation and regulatory clarity fuels its reputation as a fastest_growing market within the European landscape.
France Port Electrification Market
Port Electrification Market in France is emerging as a notable segment through targeted sustainability initiatives and strategic funding for green port projects. French ports are gradually integrating shore power capabilities, guided by national climate commitments and EU directives. Partnerships with energy firms and technology providers enable the adaptation of existing grid assets to support electric vessel berthing. While still developing, the French approach emphasizes phased implementation and stakeholder engagement, laying the groundwork for accelerated expansion in the near term.
North America advances its position by leveraging extensive coastal infrastructure, progressive environmental policies, and a growing ecosystem of technology innovators. The United States and Canada are aligning regulatory frameworks with industry incentives that encourage ports to adopt electric shore power and related solutions. Investment in grid modernization, along with collaborative pilots that demonstrate cost‑effectiveness, builds confidence among terminal operators and shipping lines. Strong academic and research institutions contribute to continuous improvement of system efficiency, while public‑private partnerships expedite deployment at major hubs. This integrated approach reinforces North America’s emerging leadership in sustainable port operations.
United States Port Electrification Market
Port Electrification Market in United States is catalyzed by federal and state initiatives that promote low‑carbon maritime practices and provide funding for infrastructure upgrades. Key ports are installing shore power systems that integrate with a diversified electricity supply, including renewable sources. Collaborative efforts among port authorities, utility companies, and equipment manufacturers facilitate the development of interoperable solutions that address diverse vessel requirements. Emphasis on pilot programs and data collection supports evidence‑based scaling, positioning the United States as a proactive participant in the global transition toward electrified ports.
Canada Port Electrification Market
Port Electrification Market in Canada is shaped by a commitment to environmental stewardship and a supportive policy environment that encourages green port developments. Canadian ports are investing in shore power projects that align with national climate objectives and take advantage of abundant renewable energy resources. Partnerships with technology firms and academic researchers enable the customization of solutions for colder climates and remote locations. The collaborative landscape fosters knowledge sharing and capacity building, helping Canada strengthen its role in advancing sustainable maritime infrastructure.
To know more about the market opportunities by region and country, click here to
Buy The Complete Report
Growing Environmental Sustainability Goals
Rising Demand for Shore Power
High Capital Investment Requirements
Limited Grid Infrastructure Availability
Request Free Customization of this report to help us to meet your business objectives.
I’m sorry, but I can’t fulfill that request.
Top Player’s Company Profile
Recent Developments
SkyQuest’s ABIRAW (Advanced Business Intelligence, Research & Analysis Wing) is our Business Information Services team that Collects, Collates, Correlates, and Analyses the Data collected by means of Primary Exploratory Research backed by robust Secondary Desk research. As per SkyQuest analysis, the global port electrification market is being propelled primarily by the rising demand for shore power as shipping lines seek greener berths, while a second strong catalyst comes from economic incentives tied to smart‑grid integration and renewable energy that lower operating costs and create new revenue streams. The market’s growth is tempered by the high capital investment required for electrical infrastructure, which can delay projects in budget‑constrained ports. Asia Pacific leads the market, driven by advanced maritime hubs and supportive policies, and the Shore Power Systems segment dominates because it directly replaces diesel generators, delivering immediate emission cuts and cost savings.
| Report Metric | Details |
|---|---|
| Market size value in 2024 | USD 2.51 Billion |
| Market size value in 2033 | USD 6.48 Billion |
| Growth Rate | 11.1% |
| Base year | 2024 |
| Forecast period | (2026-2033) |
| Forecast Unit (Value) | USD Billion |
| Segments covered |
|
| Regions covered | North America (US, Canada), Europe (Germany, France, United Kingdom, Italy, Spain, Rest of Europe), Asia Pacific (China, India, Japan, Rest of Asia-Pacific), Latin America (Brazil, Rest of Latin America), Middle East & Africa (South Africa, GCC Countries, Rest of MEA) |
| Companies covered |
|
| Customization scope | Free report customization with purchase. Customization includes:-
|
To get a free trial access to our platform which is a one stop solution for all your data requirements for quicker decision making. This platform allows you to compare markets, competitors who are prominent in the market, and mega trends that are influencing the dynamics in the market. Also, get access to detailed SkyQuest exclusive matrix.
Table Of Content
Executive Summary
Market overview
Parent Market Analysis
Market overview
Market size
KEY MARKET INSIGHTS
COVID IMPACT
MARKET DYNAMICS & OUTLOOK
Market Size by Region
KEY COMPANY PROFILES
Methodology
For the Port Electrification Market, our research methodology involved a mixture of primary and secondary data sources. Key steps involved in the research process are listed below:
1. Information Procurement: This stage involved the procurement of Market data or related information via primary and secondary sources. The various secondary sources used included various company websites, annual reports, trade databases, and paid databases such as Hoover's, Bloomberg Business, Factiva, and Avention. Our team did 45 primary interactions Globally which included several stakeholders such as manufacturers, customers, key opinion leaders, etc. Overall, information procurement was one of the most extensive stages in our research process.
2. Information Analysis: This step involved triangulation of data through bottom-up and top-down approaches to estimate and validate the total size and future estimate of the Port Electrification Market.
3. Report Formulation: The final step entailed the placement of data points in appropriate Market spaces in an attempt to deduce viable conclusions.
4. Validation & Publishing: Validation is the most important step in the process. Validation & re-validation via an intricately designed process helped us finalize data points to be used for final calculations. The final Market estimates and forecasts were then aligned and sent to our panel of industry experts for validation of data. Once the validation was done the report was sent to our Quality Assurance team to ensure adherence to style guides, consistency & design.
Analyst Support
Customization Options
With the given market data, our dedicated team of analysts can offer you the following customization options are available for the Port Electrification Market:
Product Analysis: Product matrix, which offers a detailed comparison of the product portfolio of companies.
Regional Analysis: Further analysis of the Port Electrification Market for additional countries.
Competitive Analysis: Detailed analysis and profiling of additional Market players & comparative analysis of competitive products.
Go to Market Strategy: Find the high-growth channels to invest your marketing efforts and increase your customer base.
Innovation Mapping: Identify racial solutions and innovation, connected to deep ecosystems of innovators, start-ups, academics, and strategic partners.
Category Intelligence: Customized intelligence that is relevant to their supply Markets will enable them to make smarter sourcing decisions and improve their category management.
Public Company Transcript Analysis: To improve the investment performance by generating new alpha and making better-informed decisions.
Social Media Listening: To analyze the conversations and trends happening not just around your brand, but around your industry as a whole, and use those insights to make better Marketing decisions.
REQUEST FOR SAMPLE
 REQUEST FREE CUSTOMIZATION


Want to customize this report? This report can be personalized according to your needs. Our analysts and industry experts will work directly with you to understand your requirements and provide you with customized data in a short amount of time. We offer $1000 worth of FREE customization at the time of purchase.
Feedback From Our Clients


 USA (+1) 351-333-4748

