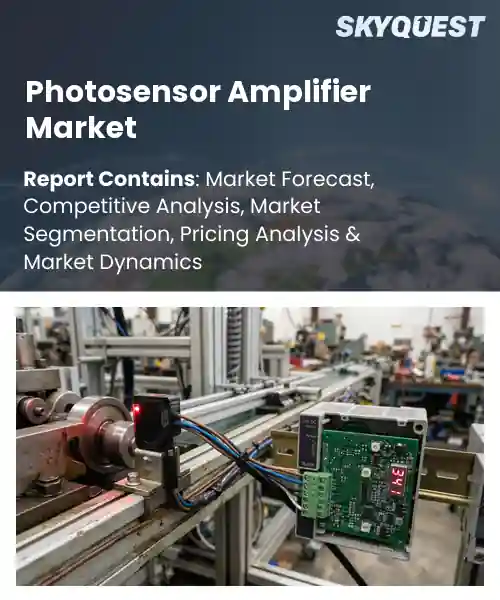
Photosensor Amplifier Market
Report ID: SQMIG45K2447
Report ID: SQMIG45K2447
[email protected]
USA +1 351-333-4748
Report ID:
SQMIG45K2447 |
Region:
Global |
Published Date: September, 2026
Pages:
157
|Tables:
118
|Figures:
77


Global Photosensor Amplifier Market size was valued at USD 2.18 Billion in 2024 and is poised to grow from USD 2.32 Billion in 2025 to USD 3.78 Billion by 2033, growing at a CAGR of 6.3% during the forecast period (2026-2033).
The global photosensor amplifier market comprises semiconductor devices that boost weak optical signals from photodiodes, CCDs and CMOS sensors for applications ranging from automotive LIDAR to medical imaging. Its importance stems from the need to convert photons into usable electrical data with fidelity, a prerequisite for vehicles, inspection and electronics. Historically, the market was confined to niche scientific instruments, but the proliferation of cameras and car prototypes in the 2010s accelerated demand. For instance, an automotive supplier reported a 45 % increase in amplifier shipments after integrating them into LIDAR modules, illustrating how ecosystems have become the catalyst for market growth. Growth in the photosensor amplifier market is driven by the expansion of advanced driver‑assistance systems (ADAS) and autonomous platforms, which require high‑speed, low‑noise conditioning to process large streams of visual and lidar data in real time. As vehicle makers adopt higher‑resolution sensor arrays, amplifier bandwidth and linearity must increase, prompting semiconductor firms to create integrated chips that combine amplification, filtering, and digital interfaces. This integration cuts board space and power use, allowing manufacturers to meet automotive safety standards and reduce production costs. Companies delivering automotive‑qualified amplifiers are therefore positioned to capture a significant share of the multi‑billion‑dollar market by 2030.
How is AI-driven automation influencing performance and demand in the photosensor amplifier market?
AI‑driven automation is reshaping the photosensor amplifier market by streamlining design cycles and enhancing performance consistency. Machine‑learning models now predict optimal transistor sizing and biasing, reducing manual iteration and shortening time‑to‑market. Integrated AI tools also monitor production data in real time, flagging drift and enabling predictive maintenance that keeps gain stability high. These capabilities attract OEMs seeking reliable, low‑noise amplification for imaging and LiDAR systems, driving demand for smarter, more adaptable amplifier solutions. As manufacturers embed AI into their design and test workflows, product differentiation increasingly hinges on how effectively the technology can boost signal fidelity while cutting development costs.Hamamatsu Photonics, June 2023, introduced an AI‑optimized low‑noise amplifier that automatically adjusts gain based on sensor feedback, improving overall system efficiency and supporting the market’s growth trajectory.
Market snapshot - (2026-2033)
Global Market Size
USD 2.18 Billion
Largest Segment
Digital Amplifiers
Fastest Growth
Fiber Optic Amplifiers
Growth Rate
6.3% CAGR
To get more insights on this market click here to Request a Free Sample Report
Global photosensor amplifier market is segmented by amplifier type, output type, application, end user and region. Based on amplifier type, the market is segmented into Digital Amplifiers, Analog Amplifiers and Fiber Optic Amplifiers. Based on output type, the market is segmented into NPN, PNP and Analog Output. Based on application, the market is segmented into Factory Automation, Packaging, Electronics and Automotive. Based on end user, the market is segmented into Manufacturing, Logistics and Semiconductor. Based on region, the market is segmented into North America, Europe, Asia Pacific, Latin America and Middle East & Africa.
Digital amplifiers segment dominates because they integrate high‑speed signal processing with low noise, meeting the stringent performance demands of modern photosensor systems. Their ability to convert optical signals into precise electrical outputs while supporting advanced communication protocols drives widespread adoption across high‑precision applications. This technological edge fosters strong supplier confidence and encourages continuous investment in R&D, reinforcing their market leadership by enabling faster data throughput and reducing system complexity, which are critical for emerging AI‑driven imaging platforms.
However, analog amplifiers are witnessing the strongest growth momentum as manufacturers seek ultra‑low latency solutions for legacy sensor arrays. Their simpler architecture and compatibility with existing analog front‑ends lower integration costs, prompting renewed interest in retrofitting older equipment. This resurgence fuels market expansion and opens new opportunities for cost‑sensitive deployments.
PNP segment dominates because its current sourcing capability aligns with the majority of industrial sensor designs that require positive voltage swing for reliable detection. The inherent robustness against temperature variations and ease of integration with standard power rails simplify system architecture, reducing component count. This compatibility accelerates time‑to‑market for new products and sustains strong demand among manufacturers prioritizing durability and straightforward maintenance by enabling consistent signal polarity and minimizing the need for additional biasing circuitry, which enhances overall system reliability.
Meanwhile, analog output configurations are emerging as the key high‑growth area because they provide continuous signal fidelity essential for precision imaging applications. Their ability to convey subtle intensity variations without quantization loss attracts advanced optical inspection systems. This demand drives innovation in low‑noise analog front‑ends, expanding market opportunities for high‑resolution sensor platforms.
To get detailed segments analysis, Request a Free Sample Report
North America maintains a leading position due to a mature technology ecosystem, extensive investment in research and development, and a concentration of key manufacturers that drive innovation. The region benefits from strong collaborative networks between academic institutions and industry, fostering rapid translation of advanced sensor designs into commercial products. Robust supply chain capabilities and a high level of engineering expertise support the production of high‑performance amplifiers for diverse applications. Moreover, demand from sectors such as automotive safety, industrial automation, and consumer electronics remains consistently strong, reinforcing market leadership through continual product evolution and early adoption of emerging standards.
United States Photosensor Amplifier Market
Photosensor Amplifier Market in the United States is propelled by a vibrant venture capital environment that fuels start‑ups focusing on next‑generation optoelectronic solutions. The presence of leading semiconductor firms encourages deep integration of amplifier technology into complex system‑on‑chip designs, while government research programs reinforce breakthroughs in low‑noise and high‑speed performance. Close ties with automotive and aerospace manufacturers create a pipeline for advanced sensing applications, ensuring sustained relevance across multiple high‑growth industries.
Canada Photosensor Amplifier Market
Photosensor Amplifier Market in Canada benefits from a strong emphasis on clean technology and precision engineering, supported by collaborative research clusters that bridge universities and industry partners. The country’s focus on renewable energy and smart infrastructure drives demand for reliable sensing components, while trade relationships with neighboring markets facilitate efficient distribution channels. A skilled workforce complemented by supportive innovation incentives helps maintain competitive product development and adoption across niche industrial segments.
Europe’s expansion is driven by stringent regulatory standards that prioritize safety and efficiency, prompting manufacturers to adopt high‑precision amplification solutions. The region’s strong emphasis on sustainable technologies fuels integration of photosensor amplifiers in renewable energy systems, smart grids, and advanced manufacturing. Collaborative research initiatives across national borders accelerate the development of low‑power, high‑accuracy devices, while a mature automotive sector seeks enhanced driver‑assistance and autonomous capabilities. Additionally, comprehensive standards harmonization across member states simplifies market entry, encouraging both established firms and emerging innovators to scale offerings throughout the continent.
Germany Photosensor Amplifier Market
Photosensor Amplifier Market in Germany is anchored by world‑renowned engineering expertise and a dense network of automotive suppliers that require exacting sensor performance. The country’s focus on Industry 4.0 drives adoption of amplifiers for high‑resolution vision systems and precision robotics, while strong university‑industry collaborations accelerate technology transfer. A proactive approach to standardization and quality assurance further reinforces confidence among global equipment manufacturers.
United Kingdom Photosensor Amplifier Market
Photosensor Amplifier Market in the United Kingdom experiences rapid growth through vibrant research ecosystems and a thriving start‑up scene focused on AI‑enabled imaging solutions. Strategic investments in defense and aerospace sectors stimulate demand for ultra‑low‑noise amplification, while partnerships with telecom providers expand usage in fiber‑optic communication networks. The regulatory emphasis on energy efficiency also fuels integration into smart building and renewable infrastructure projects.
France Photosensor Amplifier Market
Photosensor Amplifier Market in France is emerging through targeted public funding that supports innovative sensor research and prototype development. The country’s strong aerospace and medical device industries create niche demand for high‑sensitivity amplifiers, while collaborative clusters promote cross‑disciplinary solutions. Growing awareness of autonomous mobility and environmental monitoring further encourages adoption across diverse application areas.
Asia Pacific is enhancing its role by leveraging a combination of large‑scale manufacturing capacity and rapidly evolving end‑user markets. The region benefits from a proactive policy environment that encourages investment in high‑tech facilities and supports skill development in advanced electronics. Close proximity to fast‑growing automotive, consumer electronics, and industrial automation sectors creates a fertile ground for deploying next‑generation photosensor amplifiers. Strong supply chain integration, coupled with increasing emphasis on quality and reliability, enables regional firms to meet stringent global requirements while expanding export potential across emerging economies.
Japan Photosensor Amplifier Market
Photosensor Amplifier Market in Japan thrives on a legacy of precision manufacturing and a deep focus on miniaturization for consumer and industrial devices. Collaborative efforts between leading electronics corporations and research institutes drive continuous refinement of low‑noise and high‑gain architectures. The country’s strategic push toward autonomous transportation and advanced robotics further amplifies demand for robust sensing solutions that integrate seamlessly with sophisticated control systems.
South Korea Photosensor Amplifier Market
Photosensor Amplifier Market in South Korea is propelled by aggressive adoption of cutting‑edge display technologies and high‑speed communication infrastructure. Strong government incentives for semiconductor innovation stimulate development of compact, high‑performance amplifiers suited for mobile and wearable applications. Partnerships between major conglomerates and specialized component makers accelerate time‑to‑market for next‑generation imaging and sensing platforms, reinforcing the nation’s competitive edge in the global supply chain.
To know more about the market opportunities by region and country, click here to
Buy The Complete Report
Rising Demand for Advanced Imaging
Integration With IoT Platforms
High Development Cost Barriers
Stringent Regulatory Compliance
Request Free Customization of this report to help us to meet your business objectives.
Key incumbents such as Texas Instruments, Analog Devices and ON Semiconductor intensify competition by acquiring niche sensor firms, forming joint development agreements with camera module makers and launching next‑generation low‑noise amplifiers that support AI‑enabled imaging. These moves accelerate technology cycles and pressure pricing, driving faster product introductions across automotive and mobile segments.
Top Player’s Company Profile
Recent Developments
SkyQuest’s ABIRAW (Advanced Business Intelligence, Research & Analysis Wing) is our Business Information Services team that Collects, Collates, Correlates, and Analyses the Data collected by means of Primary Exploratory Research backed by robust Secondary Desk research. As per SkyQuest analysis, the global photosensor amplifier market is set to grow from $2.32 billion in 2025 to $3.78 billion by 2033, driven by rising demand for advanced imaging in automotive safety and industrial inspection, which pushes adoption of high‑speed low‑noise amplifiers. A second driver is IoT integration, where compact, low‑power designs enable edge analytics in smart factories and connected devices. The market’s restraint is high development cost and strict regulatory compliance that slow new product launches, especially for smaller firms. North America dominates the market thanks to its mature R&D ecosystem and strong automotive and consumer electronics demand, while digital amplifiers dominate the segment by delivering integrated signal processing and reduced system complexity.
| Report Metric | Details |
|---|---|
| Market size value in 2024 | USD 2.18 Billion |
| Market size value in 2033 | USD 3.78 Billion |
| Growth Rate | 6.3% |
| Base year | 2024 |
| Forecast period | (2026-2033) |
| Forecast Unit (Value) | USD Billion |
| Segments covered |
|
| Regions covered | North America (US, Canada), Europe (Germany, France, United Kingdom, Italy, Spain, Rest of Europe), Asia Pacific (China, India, Japan, Rest of Asia-Pacific), Latin America (Brazil, Rest of Latin America), Middle East & Africa (South Africa, GCC Countries, Rest of MEA) |
| Companies covered |
|
| Customization scope | Free report customization with purchase. Customization includes:-
|
To get a free trial access to our platform which is a one stop solution for all your data requirements for quicker decision making. This platform allows you to compare markets, competitors who are prominent in the market, and mega trends that are influencing the dynamics in the market. Also, get access to detailed SkyQuest exclusive matrix.
Table Of Content
Executive Summary
Market overview
Parent Market Analysis
Market overview
Market size
KEY MARKET INSIGHTS
COVID IMPACT
MARKET DYNAMICS & OUTLOOK
Market Size by Region
KEY COMPANY PROFILES
Methodology
For the Photosensor Amplifier Market, our research methodology involved a mixture of primary and secondary data sources. Key steps involved in the research process are listed below:
1. Information Procurement: This stage involved the procurement of Market data or related information via primary and secondary sources. The various secondary sources used included various company websites, annual reports, trade databases, and paid databases such as Hoover's, Bloomberg Business, Factiva, and Avention. Our team did 45 primary interactions Globally which included several stakeholders such as manufacturers, customers, key opinion leaders, etc. Overall, information procurement was one of the most extensive stages in our research process.
2. Information Analysis: This step involved triangulation of data through bottom-up and top-down approaches to estimate and validate the total size and future estimate of the Photosensor Amplifier Market.
3. Report Formulation: The final step entailed the placement of data points in appropriate Market spaces in an attempt to deduce viable conclusions.
4. Validation & Publishing: Validation is the most important step in the process. Validation & re-validation via an intricately designed process helped us finalize data points to be used for final calculations. The final Market estimates and forecasts were then aligned and sent to our panel of industry experts for validation of data. Once the validation was done the report was sent to our Quality Assurance team to ensure adherence to style guides, consistency & design.
Analyst Support
Customization Options
With the given market data, our dedicated team of analysts can offer you the following customization options are available for the Photosensor Amplifier Market:
Product Analysis: Product matrix, which offers a detailed comparison of the product portfolio of companies.
Regional Analysis: Further analysis of the Photosensor Amplifier Market for additional countries.
Competitive Analysis: Detailed analysis and profiling of additional Market players & comparative analysis of competitive products.
Go to Market Strategy: Find the high-growth channels to invest your marketing efforts and increase your customer base.
Innovation Mapping: Identify racial solutions and innovation, connected to deep ecosystems of innovators, start-ups, academics, and strategic partners.
Category Intelligence: Customized intelligence that is relevant to their supply Markets will enable them to make smarter sourcing decisions and improve their category management.
Public Company Transcript Analysis: To improve the investment performance by generating new alpha and making better-informed decisions.
Social Media Listening: To analyze the conversations and trends happening not just around your brand, but around your industry as a whole, and use those insights to make better Marketing decisions.
REQUEST FOR SAMPLE
 REQUEST FREE CUSTOMIZATION


Want to customize this report? This report can be personalized according to your needs. Our analysts and industry experts will work directly with you to understand your requirements and provide you with customized data in a short amount of time. We offer $1000 worth of FREE customization at the time of purchase.
Feedback From Our Clients


 USA (+1) 351-333-4748

