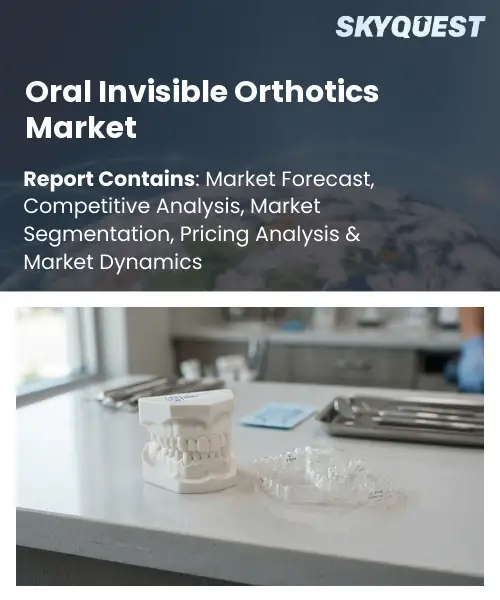
Oral Invisible Orthotics Market
Report ID: SQMIG35A4542
Report ID: SQMIG35A4542
[email protected]
USA +1 351-333-4748
Report ID:
SQMIG35A4542 |
Region:
Global |
Published Date: September, 2026
Pages:
157
|Tables:
150
|Figures:
78


Global Oral Invisible Orthotics Market size was valued at USD 29.9 Billion in 2024 and is poised to grow from USD 31.66 Billion in 2025 to USD 50.09 Billion by 2033, growing at a CAGR of 5.9% during the forecast period (2026-2033).
The Global Oral Invisible Orthotics market comprises clear aligners and retainers that straighten teeth without metal brackets. Its significance lies in offering a discreet, comfortable alternative that appeals to consumers and patients with mild‑to‑moderate malocclusions. The primary driver is the rising consumer demand for aesthetic dental solutions, fueled by expanding social media influence and increasing disposable incomes in emerging economies. Historically, the sector was dominated by conventional braces, but the introduction of digital scanning and 3D printing in the early 2010s accelerated adoption. Companies such as Align Technology demonstrated rapid growth, illustrating how technology reshaped treatment workflows and patient expectations. The next critical factor shaping market expansion is the integration of artificial intelligence and monitoring platforms, which lower treatment costs while enhancing clinical outcomes. AI algorithms analyse intraoral scans to generate optimal tooth‑movement sequences, reducing the need for adjustments. As a result, orthodontists can supervise patients through teledentistry apps, cutting travel time and expanding access in rural regions. For example, a clinic in Brazil leveraged AI‑driven aligner plans to serve 30 % more cases within a year, translating into higher revenue and shorter turnover. This efficiency creates a virtuous cycle: lower fees attract patients, driving adoption and encouraging investment in infrastructure.
How is AI-driven customization influencing the growth of the oral invisible orthotics market?
AI driven customization is reshaping the oral invisible orthotics market by turning raw scan data into personalized aligner designs in minutes. The process starts with a 3D intraoral scan that feeds a machine learning model trained on thousands of treatment outcomes. The model predicts optimal tooth movements and generates a series of aligners that fit each patient’s anatomy. Clinics now receive digital plans that can be reviewed instantly, reducing the need for manual adjustments. This speed and precision attract new patients and allow providers to scale services while maintaining high treatment quality. The technology also integrates feedback loops that refine predictions as treatment progresses, creating a continuously improving system.In June 2024 Align Technology launched an AI powered design platform that automates the creation of custom invisible aligners, cutting production time and improving fit, which drives market growth by making treatment more accessible and efficient. Dental practices report faster case acceptance and higher patient satisfaction as a result of the streamlined workflow.
Market snapshot - (2026-2033)
Global Market Size
USD 29.9 Billion
Largest Segment
Clear Aligners
Fastest Growth
Invisible Functional Orthotics
Growth Rate
5.9% CAGR
To get more insights on this market click here to Request a Free Sample Report
Global oral invisible orthotics market is segmented by orthotic type, material, application, patient group, end user and region. Based on orthotic type, the market is segmented into Clear Aligners, Invisible Retainers, Invisible Functional Orthotics, Custom Oral Appliances and Others. Based on material, the market is segmented into Thermoplastic, Polyurethane, Polyethylene and Other Dental Polymers. Based on application, the market is segmented into Teeth Alignment, Malocclusion Correction, Teeth Retention, Bruxism Management and Other Orthodontic Applications. Based on patient group, the market is segmented into Adults, Teenagers and Children. Based on end user, the market is segmented into Dental Clinics, Orthodontic Clinics, Hospitals and Others. Based on region, the market is segmented into North America, Europe, Asia Pacific, Latin America and Middle East & Africa.
Clear Aligners segment dominates because they provide a discreet removable solution that aligns teeth without the aesthetic drawbacks of traditional braces. Their ease of use, patient comfort, and compatibility with digital treatment planning have made them the preferred choice for aesthetic focused consumers. This preference fuels continuous investment in scanning and printing technologies, reinforcing their leadership in the oral invisible orthotics market and drives ongoing research into material durability for long term performance.
However, Invisible Functional Orthotics segment is witnessing the strongest growth momentum because emerging evidence links functional oral devices to improved sleep apnea outcomes and temporomandibular joint health. Clinicians are integrating these devices into multidisciplinary treatment plans, prompting manufacturers to innovate designs that address broader health concerns, thereby expanding market reach.
Invisible Functional Orthotics segment dominates because they directly target functional issues such as sleep apnea and temporomandibular joint disorders, offering therapeutic benefits beyond cosmetic alignment. Their ability to be customized for specific functional corrections makes them a preferred option for patients seeking comprehensive oral health solutions, encouraging clinicians to incorporate them into broader treatment protocols and driving sustained market interest.
Meanwhile, Polyurethane material segment is emerging as the key high growth area because its superior resilience and shockabsorbing properties address increasing demand for comfort in night time bruxism devices. Ongoing research into biocompatible formulations is expanding its applicability, prompting manufacturers to launch new product lines that attract both clinicians and patients, thereby accelerating market expansion.
Thermoplastic material segment leads because it offers a balance of flexibility, clarity, and ease of fabrication that aligns with digital workflow requirements. Its ability to be thermoformed quickly enables rapid production of patient specific devices, reducing turnaround time and enhancing clinical efficiency. This material’s adaptability to various design complexities encourages broader adoption across treatment modalities, cementing its central role in the oral invisible orthotics market.
Meanwhile, Polyurethane material segment is emerging as the key high growth area because its superior resilience and shockabsorbing properties address increasing demand for comfort in night time bruxism devices. Ongoing research into biocompatible formulations is expanding its applicability, prompting manufacturers to launch new product lines that attract both clinicians and patients, thereby accelerating market expansion.
To get detailed segments analysis, Request a Free Sample Report
North America leads the market through a confluence of advanced dental infrastructure, comprehensive reimbursement frameworks, and heightened consumer awareness of aesthetic solutions. The region benefits from strong research and development ecosystems, with leading manufacturers operating close to academic institutions to accelerate innovation. Professional education emphasizes digital workflow adoption, fostering early practitioner acceptance. Robust insurance coverage and widespread distribution networks ensure accessibility across diverse populations. Together these factors create a mature environment where invisible orthodontic products achieve high penetration and sustained demand.
Oral Invisible Orthotics Market in United States is characterized by a mature ecosystem of specialist providers, advanced digital scanning technologies, and strong integration with insurance plans. Consumers exhibit a high degree of confidence in clinical outcomes, encouraging widespread uptake. Leading manufacturers maintain research hubs that collaborate closely with academic institutions, driving continual product refinement. Distribution networks span both urban and suburban areas, ensuring accessibility across diverse patient populations throughout the nation.
Oral Invisible Orthotics Market in Canada benefits from a supportive public health framework that emphasizes preventive dental care and aesthetic treatment options. Dental professionals adopt cutting‑edge digital impression systems, enhancing treatment efficiency and patient comfort. Collaborative research initiatives with local universities drive innovation tailored to regional preferences. Reimbursement policies encourage uptake among a broad patient base, while distribution channels ensure product availability in both major metropolitan centres and smaller communities.
Europe’s expansion is propelled by a strong emphasis on aesthetic dentistry, reinforced by well‑established clinical training programmes across the continent. Healthcare systems increasingly incorporate coverage for discreet orthodontic options, boosting patient acceptance. Innovative manufacturers in Germany set high standards for product quality and technology transfer. The United Kingdom exhibits a rapidly evolving consumer mindset that embraces digital health and tele‑consultation, accelerating market penetration. France shows emerging interest driven by rising consumer awareness and expanding private dental networks. Collaborative research clusters, cross‑border regulatory harmonisation, and robust supply chains further streamline product introductions, creating a fertile environment for sustained growth throughout Europe.
Oral Invisible Orthotics Market in Germany is anchored by a legacy of precision engineering and a dense network of specialized orthodontic clinics. Manufacturers leverage advanced material science to produce solutions that meet regulatory expectations. Dental education institutions integrate digital workflow training, fostering early adoption among new practitioners. Strong reimbursement schemes and patient willingness to invest in aesthetic care sustain demand, while production reinforces Germany’s leadership position in the regional market.
Oral Invisible Orthotics Market in United Kingdom is propelled by an evolving consumer mindset that embraces digital health solutions and consultation models. orthodontic practices adopt design platforms, streamlining treatment planning and reducing turnaround times. Insurance frameworks are adapting to include coverage for discreet orthodontic options, broadening accessibility. Academic collaborations with technology firms accelerate innovation, while brand awareness among patients drives preference for invisible solutions across both urban and suburban settings.
Oral Invisible Orthotics Market in France is emerging alongside growing consumer awareness of aesthetic dental options and expanding private networks. Clinicians integrate digital impression technologies that enhance accuracy and patient comfort. Reimbursement policies are evolving to support orthodontic treatments, encouraging adoption. Research programs with European partners foster innovation tailored to local preferences, while marketing highlights the benefits of invisible solutions, attracting a patient base across metropolitan and regional areas.
Asia Pacific is strengthening its position through a combination of rising consumer demand for aesthetic dental solutions and rapid adoption of digital dentistry platforms across the region. Growing middle‑income populations place greater value on discreet orthodontic options, prompting clinics to invest in advanced scanning and 3‑D printing technologies. Government health initiatives in key markets encourage preventive oral care, creating pathways for coverage of invisible orthodontic treatments. Local manufacturers are scaling production capabilities, leveraging cost efficiencies while adhering to stringent quality standards. Strategic partnerships between technology firms and dental providers accelerate innovation and expand access. Cultural emphasis on personal appearance further fuels acceptance, positioning Asia Pacific as a dynamic growth engine for the global oral invisible orthotics market. Industry players continue to explore localized service models to deepen market penetration.
Oral Invisible Orthotics Market in Japan is driven by patient expectations for precision and comfort, coupled with acceptance of advanced dental care. Clinics integrate intraoral scanners and AI‑guided treatment planning, delivering accurate outcomes. Reimbursement policies increasingly recognize invisible orthodontic solutions, broadening patient access. Domestic manufacturers focus on material innovation, ensuring products meet quality standards. Educational programs emphasize digital workflow proficiency, fostering a practitioner base that sustains overall market momentum.
Oral Invisible Orthotics Market in South Korea benefits from transformation within dental practices and an emphasis on appearance. Clinics adopt scanning systems combined with design tools, enabling efficient treatment customization. Insurance frameworks evolve to incorporate coverage for orthodontic options, expanding patient eligibility. Manufacturers prioritize research collaborations with universities, advancing material science and reducing production lead times. Education campaigns highlight the convenience and discreet nature of invisible solutions, reinforcing market growth.
To know more about the market opportunities by region and country, click here to
Buy The Complete Report
Increasing Consumer Preference For Aesthetics
Advancements In 3D Imaging Technology
High Cost Of Custom Fabrication
Limited Awareness Among General Dentists
Request Free Customization of this report to help us to meet your business objectives.
The market is shaped by intense rivalry among established players such as Align Technology, Dentsply Sirona and SmileDirectClub, each leveraging digital scanning, AI‑driven treatment planning and expanding direct‑to‑consumer channels; recent competitive moves include Dentsply Sirona’s partnership with ClearCorrect to integrate its 3D printing pipeline and Align Technology’s acquisition of a smaller AI‑based orthodontic analytics firm to accelerate product personalization.
Top Player’s Company Profile
Recent Developments
SkyQuest’s ABIRAW (Advanced Business Intelligence, Research & Analysis Wing) is our Business Information Services team that Collects, Collates, Correlates, and Analyses the Data collected by means of Primary Exploratory Research backed by robust Secondary Desk research. As per SkyQuest analysis, the market is propelled by rising consumer preference for aesthetic, discreet tooth correction, while the surge in AI‑driven treatment planning and digital scan integration offers a second catalyst that accelerates case throughput and lowers costs. The dominant region remains North America, where advanced dental infrastructure, strong reimbursement and high brand awareness drive adoption, and clear aligners continue to lead the segment landscape because of their removable comfort and digital workflow compatibility. However, the high cost of custom fabrication acts as a restraint, limiting price‑sensitive adoption especially in emerging economies, and underscores the need for affordable manufacturing solutions.
| Report Metric | Details |
|---|---|
| Market size value in 2024 | USD 29.9 Billion |
| Market size value in 2033 | USD 50.09 Billion |
| Growth Rate | 5.9% |
| Base year | 2024 |
| Forecast period | (2026-2033) |
| Forecast Unit (Value) | USD Billion |
| Segments covered |
|
| Regions covered | North America (US, Canada), Europe (Germany, France, United Kingdom, Italy, Spain, Rest of Europe), Asia Pacific (China, India, Japan, Rest of Asia-Pacific), Latin America (Brazil, Rest of Latin America), Middle East & Africa (South Africa, GCC Countries, Rest of MEA) |
| Companies covered |
|
| Customization scope | Free report customization with purchase. Customization includes:-
|
To get a free trial access to our platform which is a one stop solution for all your data requirements for quicker decision making. This platform allows you to compare markets, competitors who are prominent in the market, and mega trends that are influencing the dynamics in the market. Also, get access to detailed SkyQuest exclusive matrix.
Table Of Content
Executive Summary
Market overview
Parent Market Analysis
Market overview
Market size
KEY MARKET INSIGHTS
COVID IMPACT
MARKET DYNAMICS & OUTLOOK
Market Size by Region
KEY COMPANY PROFILES
Methodology
For the Oral Invisible Orthotics Market, our research methodology involved a mixture of primary and secondary data sources. Key steps involved in the research process are listed below:
1. Information Procurement: This stage involved the procurement of Market data or related information via primary and secondary sources. The various secondary sources used included various company websites, annual reports, trade databases, and paid databases such as Hoover's, Bloomberg Business, Factiva, and Avention. Our team did 45 primary interactions Globally which included several stakeholders such as manufacturers, customers, key opinion leaders, etc. Overall, information procurement was one of the most extensive stages in our research process.
2. Information Analysis: This step involved triangulation of data through bottom-up and top-down approaches to estimate and validate the total size and future estimate of the Oral Invisible Orthotics Market.
3. Report Formulation: The final step entailed the placement of data points in appropriate Market spaces in an attempt to deduce viable conclusions.
4. Validation & Publishing: Validation is the most important step in the process. Validation & re-validation via an intricately designed process helped us finalize data points to be used for final calculations. The final Market estimates and forecasts were then aligned and sent to our panel of industry experts for validation of data. Once the validation was done the report was sent to our Quality Assurance team to ensure adherence to style guides, consistency & design.
Analyst Support
Customization Options
With the given market data, our dedicated team of analysts can offer you the following customization options are available for the Oral Invisible Orthotics Market:
Product Analysis: Product matrix, which offers a detailed comparison of the product portfolio of companies.
Regional Analysis: Further analysis of the Oral Invisible Orthotics Market for additional countries.
Competitive Analysis: Detailed analysis and profiling of additional Market players & comparative analysis of competitive products.
Go to Market Strategy: Find the high-growth channels to invest your marketing efforts and increase your customer base.
Innovation Mapping: Identify racial solutions and innovation, connected to deep ecosystems of innovators, start-ups, academics, and strategic partners.
Category Intelligence: Customized intelligence that is relevant to their supply Markets will enable them to make smarter sourcing decisions and improve their category management.
Public Company Transcript Analysis: To improve the investment performance by generating new alpha and making better-informed decisions.
Social Media Listening: To analyze the conversations and trends happening not just around your brand, but around your industry as a whole, and use those insights to make better Marketing decisions.
REQUEST FOR SAMPLE
 REQUEST FREE CUSTOMIZATION


Want to customize this report? This report can be personalized according to your needs. Our analysts and industry experts will work directly with you to understand your requirements and provide you with customized data in a short amount of time. We offer $1000 worth of FREE customization at the time of purchase.
Feedback From Our Clients


 USA (+1) 351-333-4748

