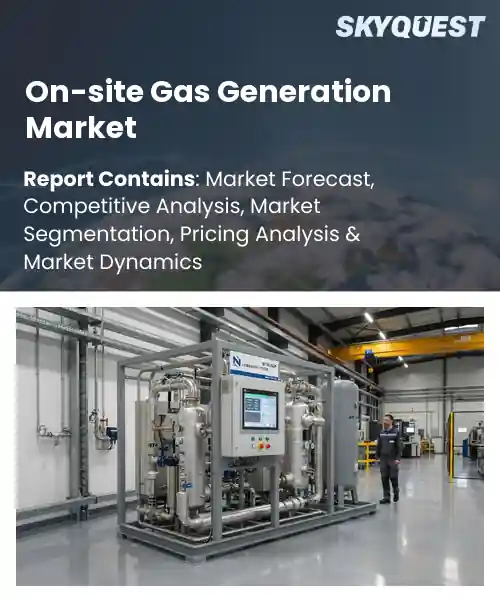
On-site Gas Generation Market
Report ID: SQMIG20I3854
Report ID: SQMIG20I3854
[email protected]
USA +1 351-333-4748
Report ID:
SQMIG20I3854 |
Region:
Global |
Published Date: September, 2026
Pages:
157
|Tables:
145
|Figures:
78


Global On-Site Gas Generation Market size was valued at USD 6.74 Billion in 2024 and is poised to grow from USD 7.25 Billion in 2025 to USD 13.04 Billion by 2033, growing at a CAGR of 7.6% during the forecast period (2026-2033).
On‑site gas generation, defined as the localized production of hydrogen, syngas, or other industrial gases at the point of consumption, has become a pivotal segment of energy transition. Its primary driver is rising demand for carbon feedstocks coupled with need to avoid costly and hazardous gas transport. Historically, market lingered in niche applications such as small‑scale reformers for refinery desulfurization in early 2000s, but advent of electrolyzers and modular steam‑methane reformers accelerated adoption. Today, chemical manufacturers, steel mills, and data‑center operators deploy on‑site units to secure supply reliability, cut emissions, and improve margins, illustrating market’s shift from pilots to significant assets. Building on this shift, the decisive factor for the on‑site gas generation market is the alignment of decarbonization policies with renewable‑electricity prices, which together accelerate electrolytic hydrogen adoption. Government carbon‑pricing and subsidies push corporations toward net‑zero targets, prompting larger deployments that lower capital costs and create economies of scale. This feedback enables on‑site hydrogen to replace coke in steelmaking and to power fuel‑cell backup for data centers, offering solutions. Cases include Hyundai’s electrolyzer feeding fuel‑cell trucks, Shell’s Rotterdam plant supplying processes, and Amazon’s pilot using hydrogen backup at a cloud facility, demonstrating how policy, cost, and technology expand market opportunities.
How are AI and IoT integration improving safety and performance in the on‑site gas generation market?
AI and IoT integration is reshaping on‑site gas generation by creating smarter, self‑monitoring systems that continuously assess equipment health and environmental conditions. Sensors collect data on pressure, temperature, flow rates and emissions, while AI algorithms detect anomalies, predict component wear and recommend preventive actions before failures occur. This predictive maintenance reduces unplanned downtime and enhances operational efficiency, allowing plants to run closer to optimal capacity. Real‑time alerts also improve worker safety by automatically shutting down units or triggering ventilation when hazardous levels are detected. The combined visibility and automation give operators greater confidence to scale installations, supporting the market’s shift toward decentralized, low‑emission gas production.A recent development from Air Liquide in March 2024, deploying an AI‑driven IoT platform at a new on‑site hydrogen generator, demonstrates how continuous data analytics can tighten safety controls and boost performance, reinforcing market growth.
Market snapshot - (2026-2033)
Global Market Size
USD 6.74 Billion
Largest Segment
Nitrogen
Fastest Growth
Hydrogen
Growth Rate
7.6% CAGR
To get more insights on this market click here to Request a Free Sample Report
Global on-site gas generation market is segmented by gas type, technology, end user, capacity, installation and region. Based on gas type, the market is segmented into Nitrogen, Oxygen, Hydrogen and Carbon Dioxide. Based on technology, the market is segmented into Pressure Swing Adsorption, Membrane Separation and Electrolysis. Based on end user, the market is segmented into Healthcare, Food & Beverage, Electronics and Chemicals. Based on capacity, the market is segmented into Small Scale, Medium Scale and Large Scale. Based on installation, the market is segmented into Indoor and Outdoor. Based on region, the market is segmented into North America, Europe, Asia Pacific, Latin America and Middle East & Africa.
Nitrogen segment dominates because it provides a universally required inert atmosphere across industrial processes, offering reliability and safety that simplify compliance. Its low cost and ease of storage make it the default choice for many manufacturers, reinforcing demand for onsite generation systems that can deliver consistent purity without complex handling. Consequently, manufacturers prioritize nitrogen solutions to reduce logistics and ensure uninterrupted production and operational efficiency across multiple lines.
However, hydrogen segment emerges as the fastest growing because renewable energy integration and stringent emissions targets are prompting industries to adopt clean fuel alternatives. Onsite electrolysis units enable localized production, reducing transport risks and supporting decarbonization strategies, thereby unlocking new applications and accelerating market expansion for sectors such as automotive and power generation.
Pressure swing adsorption segment leads because it delivers high purity gases using established adsorbent media, providing reliable performance without the need for high energy input. Its modular design fits diverse plant footprints, allowing seamless integration and commissioning, which eases operational bottlenecks and sustains continuous production across varied industries. Moreover, the technology's minimal maintenance requirements and proven durability lower cost of ownership, making it a preferred choice for firms seeking dependable gas supply while managing capital constraints.
Meanwhile, membrane separation segment is witnessing the strongest growth because advances in polymer chemistry are delivering higher selectivity and lower energy consumption, enabling compact onsite units for niche applications. Its scalability and ease of integration attract manufacturers aiming to reduce footprint and operational costs, propelling market expansion.
To get detailed segments analysis, Request a Free Sample Report
North America dominance is driven by a strong industrial base, advanced technology infrastructure, supportive regulatory environment, and sustained investment in low‑carbon solutions. The region’s extensive petrochemical clusters and integrated supply chains enable rapid deployment of modular gas generation systems. Companies benefit from mature engineering expertise, a skilled workforce, and close collaboration between energy producers and equipment manufacturers. Policy frameworks encourage on‑site generation to improve energy security and reduce emissions, while access to capital markets facilitates adoption of innovative technologies. In addition, strong intellectual property protections and a culture of continuous improvement drive adoption of cutting‑edge catalysts and modular designs that meet diverse operational requirements. Collaborative research institutions further accelerate technology validation, ensuring that North American providers remain at the forefront of efficiency and environmental performance.
United States On-site Gas Generation Market
On-site Gas Generation Market in the United States benefits from a deep network of technology innovators and a robust industrial ecosystem that prioritises energy resilience. The presence of leading equipment manufacturers enables rapid customization for sectors such as chemicals, refining and food processing. Strategic partnerships between utilities and end‑users foster integrated solutions, while regulatory incentives encourage adoption of low‑carbon generation options across a wide range of facilities throughout the country nationally.
Canada On-site Gas Generation Market
On-site Gas Generation Market in Canada leverages strong environmental policies and a commitment to decarbonisation that drive interest in localized gas production. Collaboration between provincial energy agencies and industrial clusters creates pathways for pilot projects and knowledge sharing. Access to abundant natural gas resources and emerging renewable feedstocks supports flexible system design, while expertise in engineering and project management ensures reliable deployment across sectors such as mining, pulp and paper, and transportation.
Europe experiences rapid expansion of the On‑site Gas Generation Market due to a confluence of stringent climate objectives, progressive policy frameworks, and a mature industrial landscape that values energy autonomy. Governments encourage on‑site solutions to lower carbon footprints and enhance grid resilience, while incentives promote integration with renewable energy sources. A strong engineering tradition and a dense network of specialized suppliers enable rapid adaptation of modular technologies for chemicals, pharmaceuticals and food processing. Collaborative research programs across borders accelerate innovation in catalyst efficiency and emissions control. Moreover, the focus on circular economy principles drives interest in utilizing waste streams as feedstock, positioning European manufacturers as early adopters of sustainable gas generation practices. These dynamics also foster close collaboration between utilities and end‑users, creating integrated value chains that further accelerate market uptake.
Germany On-site Gas Generation Market
On-site Gas Generation Market in Germany is anchored by a strong engineering base and a long‑standing commitment to industrial efficiency. The country’s extensive chemical and automotive sectors provide a ready platform for deploying modular gas systems that reduce reliance on external supplies. Governmental support for low‑emission technologies encourages integration with renewable hydrogen, while collaborative clusters between universities and manufacturers accelerate advances in catalyst performance and system automation across the nation today.
United Kingdom On-site Gas Generation Market
On-site Gas Generation Market in the United Kingdom is propelled by aggressive decarbonisation targets and a vibrant ecosystem of technology innovators. The presence of leading research institutions and a proactive regulatory environment stimulates rapid adoption of compact gas generation units for sectors such as pharmaceuticals, food and beverage, and energy services. Emphasis on integrating on‑site production with renewable electricity sources fosters hybrid solutions that improve overall plant efficiency and lower emissions.
France On-site Gas Generation Market
On-site Gas Generation Market in France is emerging as a focal point for sustainable industrial transformation. Strong policy incentives encourage companies to trial localized gas production within broader energy transition strategies. Collaboration between French energy agencies and industrial clusters nurtures modular solutions that can be coupled with renewable feedstocks. Growing awareness of carbon reduction benefits drives adoption across chemicals, cosmetics and agribusiness, positioning France as a catalyst for wider European uptake.
Asia Pacific is strengthening its position in the On‑site Gas Generation Market through a combination of technological innovation, increasing emphasis on energy security and proactive environmental policies. Nations in the region invest heavily in research and development to improve catalyst efficiency and develop compact, modular systems suited to diverse industrial applications. Growing industrial activity, particularly in high‑value manufacturing, creates demand for reliable and flexible gas supplies that can operate independently of grid constraints. Government initiatives promote the integration of on‑site generation with renewable electricity and low‑carbon feedstocks, fostering hybrid solutions that reduce overall emissions. Collaborative platforms linking manufacturers, utilities and academia accelerate knowledge transfer, positioning the region as a hub for next‑generation gas generation technologies. These efforts also attract multinational corporations seeking reliable local power, further solidifying the region’s competitive advantage.
Japan On-site Gas Generation Market
On-site Gas Generation Market in Japan is driven by a focus on high‑efficiency manufacturing and a regulatory environment that prioritises low‑carbon solutions. The country’s advanced chemical and electronics sectors demand compact, reliable gas generation units that integrate with existing processes. Collaboration between research institutes and equipment manufacturers accelerates development of catalysts with superior performance, while government incentives support pilot deployments that demonstrate operational and environmental benefits across industrial applications.
South Korea On-site Gas Generation Market
On-site Gas Generation Market in South Korea benefits from government support and a manufacturing base that emphasizes advancement. The nation’s petrochemical and steel industries seek flexible gas solutions to enhance energy resilience and reduce carbon intensity. Close ties between universities, research centres and equipment suppliers foster prototyping of high‑efficiency systems. Policy measures encouraging integration with renewable electricity and low‑carbon feedstocks stimulate adoption, positioning South Korea as a leading adopter of on‑site gas generation technologies.
To know more about the market opportunities by region and country, click here to
Buy The Complete Report
Increasing Demand for Remote Power
Stringent Environmental Regulations
High Capital Investment Requirements
Complex Permitting and Approval Processes
Request Free Customization of this report to help us to meet your business objectives.
The competitive landscape is shaped by intense rivalry among global industrial gas leaders seeking to capture the growing demand for on‑site hydrogen and nitrogen generation driven by decarbonisation mandates, while innovators accelerate technology roll‑outs. Air Liquide’s 2022 acquisition of a German on‑site gas generator firm expanded its portfolio and customer base. Linde formed a strategic partnership with H2Pro to pilot its E‑TAC electrolyzer, accelerating time‑to‑market. Praxair launched a modular on‑site hydrogen unit in 2023, leveraging digital controls to differentiate its offering and win new contracts.
Top Player’s Company Profile
Recent Developments
SkyQuest’s ABIRAW (Advanced Business Intelligence, Research & Analysis Wing) is our Business Information Services team that Collects, Collates, Correlates, and Analyses the Data collected by means of Primary Exploratory Research backed by robust Secondary Desk research. As per SkyQuest analysis the global on‑site gas generation market is being propelled primarily by the rising demand for remote power which pushes industries to adopt compact generators that can operate off‑grid while stringent environmental regulations provide a second strong incentive by mandating lower‑emission solutions. The market’s pace is tempered by the high capital investment required to install these systems a restraint that slows adoption among smaller players. North America remains the dominant region thanks to its mature industrial base and supportive policy framework and nitrogen generation continues to hold the largest share of the market because of its low cost and universal need for an inert atmosphere.
| Report Metric | Details |
|---|---|
| Market size value in 2024 | USD 6.74 Billion |
| Market size value in 2033 | USD 13.04 Billion |
| Growth Rate | 7.6% |
| Base year | 2024 |
| Forecast period | (2026-2033) |
| Forecast Unit (Value) | USD Billion |
| Segments covered |
|
| Regions covered | North America (US, Canada), Europe (Germany, France, United Kingdom, Italy, Spain, Rest of Europe), Asia Pacific (China, India, Japan, Rest of Asia-Pacific), Latin America (Brazil, Rest of Latin America), Middle East & Africa (South Africa, GCC Countries, Rest of MEA) |
| Companies covered |
|
| Customization scope | Free report customization with purchase. Customization includes:-
|
To get a free trial access to our platform which is a one stop solution for all your data requirements for quicker decision making. This platform allows you to compare markets, competitors who are prominent in the market, and mega trends that are influencing the dynamics in the market. Also, get access to detailed SkyQuest exclusive matrix.
Table Of Content
Executive Summary
Market overview
Parent Market Analysis
Market overview
Market size
KEY MARKET INSIGHTS
COVID IMPACT
MARKET DYNAMICS & OUTLOOK
Market Size by Region
KEY COMPANY PROFILES
Methodology
For the On-site Gas Generation Market, our research methodology involved a mixture of primary and secondary data sources. Key steps involved in the research process are listed below:
1. Information Procurement: This stage involved the procurement of Market data or related information via primary and secondary sources. The various secondary sources used included various company websites, annual reports, trade databases, and paid databases such as Hoover's, Bloomberg Business, Factiva, and Avention. Our team did 45 primary interactions Globally which included several stakeholders such as manufacturers, customers, key opinion leaders, etc. Overall, information procurement was one of the most extensive stages in our research process.
2. Information Analysis: This step involved triangulation of data through bottom-up and top-down approaches to estimate and validate the total size and future estimate of the On-site Gas Generation Market.
3. Report Formulation: The final step entailed the placement of data points in appropriate Market spaces in an attempt to deduce viable conclusions.
4. Validation & Publishing: Validation is the most important step in the process. Validation & re-validation via an intricately designed process helped us finalize data points to be used for final calculations. The final Market estimates and forecasts were then aligned and sent to our panel of industry experts for validation of data. Once the validation was done the report was sent to our Quality Assurance team to ensure adherence to style guides, consistency & design.
Analyst Support
Customization Options
With the given market data, our dedicated team of analysts can offer you the following customization options are available for the On-site Gas Generation Market:
Product Analysis: Product matrix, which offers a detailed comparison of the product portfolio of companies.
Regional Analysis: Further analysis of the On-site Gas Generation Market for additional countries.
Competitive Analysis: Detailed analysis and profiling of additional Market players & comparative analysis of competitive products.
Go to Market Strategy: Find the high-growth channels to invest your marketing efforts and increase your customer base.
Innovation Mapping: Identify racial solutions and innovation, connected to deep ecosystems of innovators, start-ups, academics, and strategic partners.
Category Intelligence: Customized intelligence that is relevant to their supply Markets will enable them to make smarter sourcing decisions and improve their category management.
Public Company Transcript Analysis: To improve the investment performance by generating new alpha and making better-informed decisions.
Social Media Listening: To analyze the conversations and trends happening not just around your brand, but around your industry as a whole, and use those insights to make better Marketing decisions.
REQUEST FOR SAMPLE
 REQUEST FREE CUSTOMIZATION


Want to customize this report? This report can be personalized according to your needs. Our analysts and industry experts will work directly with you to understand your requirements and provide you with customized data in a short amount of time. We offer $1000 worth of FREE customization at the time of purchase.
Feedback From Our Clients


 USA (+1) 351-333-4748

