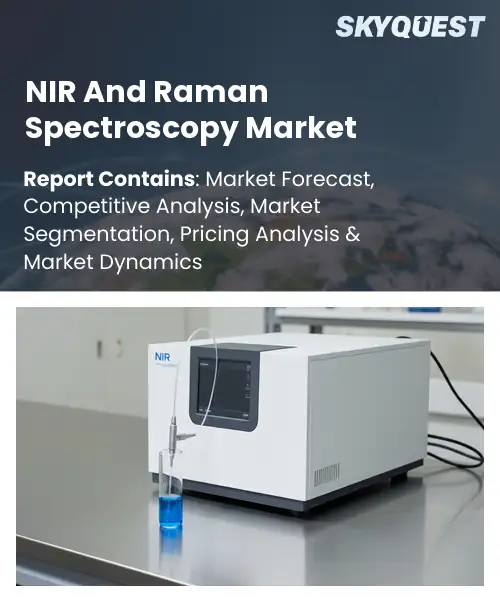
NIR And Raman Spectroscopy Market
Report ID: SQMIG20I2943
Report ID: SQMIG20I2943
[email protected]
USA +1 351-333-4748
Report ID:
SQMIG20I2943 |
Region:
Global |
Published Date: April, 2026
Pages:
157
|Tables:
88
|Figures:
76


Global Nir And Raman Spectroscopy Market size was valued at USD 2.14 Billion in 2024 and is poised to grow from USD 2.29 Billion in 2025 to USD 2.1 Billion by 2033, growing at a CAGR of 6.9% during the forecast period (2026-2033).
The primary driver of the NIR and Raman spectroscopy market is growing demand for rapid, noninvasive analytical techniques across pharmaceuticals, food safety and materials science, which has elevated instruments from niche labs to manufacturing for process optimization. NIR and Raman systems deliver real-time quality control and compositional analysis without sample preparation, enabling manufacturers to shorten cycle times and minimize waste. Over time the market moved from bulky bench-top instruments to compact, portable sensors as improvements in diode lasers, detectors and chemometric algorithms reduced costs and improved usability. For example, on-line NIR probes monitor moisture and blend uniformity in tablet production.Building on the shift, the pivotal factor accelerating market growth is integration of advanced chemometrics, AI and cloud connectivity, because superior data interpretation turns spectral outputs into reliable process controls for automated environments. As machine learning extracts meaningful signatures from complex spectra, manufacturers deploy at-line and in-line monitoring, which lowers recalls and energy consumption, supports sustainability targets and prompts regulatory acceptance within process analytical technology frameworks. Portable Raman systems help customs detect counterfeit medicines while NIR sorters boost throughput in grain elevators, producing ROI that attracts capital. Consequently, vendors emphasize SaaS platforms and service models to capture emerging regional demand.
How is AI enhancing data analysis in the NIR and Raman spectroscopy market?
AI is transforming data analysis in near infrared and Raman spectroscopy by improving signal processing, pattern recognition and predictive modeling. Key aspects are automated preprocessing that reduces noise and fluorescence, advanced chemometric models that extract meaningful features, and machine learning classifiers that speed identification and classification. The current state shows growing adoption of embedded and cloud based AI that turns complex spectra into actionable insights for pharmaceuticals, food quality and process control. Real world examples include AI enabled spectral libraries for robust fingerprinting and automated calibration transfer that reduces expert time and increases laboratory throughput.HORIBA March 2025, the PoliSpectra Rapid Raman Plate Reader launch demonstrates how combining high throughput Raman acquisition with AI based chemometrics enables rapid screening and real time classification, supporting faster drug discovery and more efficient quality control workflows across the market, and reduces manual review burden for laboratories and manufacturers.
Market snapshot - (2026-2033)
Global Market Size
USD 2.14 Billion
Largest Segment
Pneumatic/Catapult Launchers
Fastest Growth
Hydraulic/Mechanical Rail Launchers
Growth Rate
6.9% CAGR
To get more insights on this market click here to Request a Free Sample Report
Global nir and raman spectroscopy market is segmented by launch mechanism, platform mobility, end-user/branch and region. Based on launch mechanism, the market is segmented into Pneumatic/Catapult Launchers, Rocket-Assisted Take-Off (RATO) and Hydraulic/Mechanical Rail Launchers. Based on platform mobility, the market is segmented into Truck-Mounted/Vehicle-Integrated Launchers and Trailer-Based/Portable Launching Skids. Based on end-user/branch, the market is segmented into National Defense Forces (Training/Sim) and Aerospace Defense Contractors (Testing/R&D). Based on region, the market is segmented into North America, Europe, Asia Pacific, Latin America and Middle East & Africa.
Pneumatic/Catapult Launchers segment dominates because their repeatable, low-vibration deployment profiles make them ideal platforms for integrating sensitive NIR and Raman instrumentation that demands stable optical alignment and minimal thermal shock. Consistent launch dynamics reduce calibration drift and measurement noise, enabling reliable field and test-lab spectral acquisition. This operational predictability drives procurement toward instruments and service offerings tailored to these deployment conditions, reinforcing ecosystem adoption.
However, Rocket-Assisted Take-Off (RATO) is emerging as the most rapidly expanding area due to its requirement for ruggedized, high-shock tolerant spectral systems. Advances in miniaturized detectors, robust enclosure design, and high-speed data capture respond to testing demands for extreme acceleration profiles, stimulating instrument innovation and aftermarket services that open new testing and defense-related spectroscopy applications.
Truck-Mounted/Vehicle-Integrated Launchers segment leads because their integrated power, climate control, and payload capacity enable deployment of full-featured NIR and Raman laboratories close to testing sites and operational areas. The capacity to support larger spectrometers, stabilized optics, and onboard calibration standards reduces measurement variability and shortens deployment cycles, making vehicle-integrated solutions the preferred choice for comprehensive, turnkey spectral analysis across complex testing workflows.
Meanwhile, Trailer-Based/Portable Launching Skids are the most rapidly expanding area as lightweight, rapidly deployable platforms address demand for temporary test ranges and distributed spectral monitoring. Innovations in compact mounting interfaces, modular environmental covers, and plug-and-play calibration options lower setup complexity, enabling broader adoption by smaller operators and service vendors and unlocking new rental and field service business models.
To get detailed segments analysis, Request a Free Sample Report
North America commands the global NIR And Raman spectroscopy market through an interplay of technological leadership, dense application demand, and mature commercialization pathways. Advanced instrument manufacturers and specialized service providers are concentrated in key innovation hubs, enabling rapid product development and dependable after sales support. Extensive use in pharmaceutical development, clinical diagnostics, food safety, and materials research drives a sophisticated buyer base that values accuracy and regulatory compliance. Strong university and national laboratory networks sustain methodological innovation and skilled talent pipelines. Well established calibration standards, robust distribution channels, and frequent collaboration between industry and academia facilitate adoption across laboratory and process environments. Access to capital and a culture of early technology uptake further underpin market depth and resilience relative to other regions.
NIR And Raman Spectroscopy Market United States benefits from a dense concentration of instrument developers, contract research organizations, and end users across pharmaceutical, clinical, and materials sectors. Leading research universities and national laboratories support method development and validation while commercial labs accelerate adoption. Service networks provide calibration and maintenance expertise. Strong industry academic partnerships and procurement frameworks encourage early adoption of advanced spectroscopy solutions across research, development, and manufacturing environments.
NIR And Raman Spectroscopy Market Canada leverages research hospitals, agricultural testing facilities, and resource sector laboratories to expand practical applications. Collaborative networks between universities, provincial labs, and private providers foster tailored solutions for food safety, environmental monitoring, and materials analysis. A growing base of specialized service providers offers method validation, training, and maintenance, while procurement programs and cross institutional partnerships encourage integration of spectroscopy into centralized laboratories and distributed workflows.
Europe is experiencing rapid expansion in the NIR And Raman spectroscopy market due to a convergence of strong industrial demand, regulatory emphasis on product quality, and collaborative innovation ecosystems. A diverse manufacturing base spanning pharmaceuticals, chemicals, food and beverage, and automotive elevates the need for reliable in line and laboratory analytics. Public and private research centers support translational projects that adapt spectroscopy for process control and quality assurance. Harmonized standards and certification regimes foster cross border adoption by lowering technical uncertainty for buyers. Strategic partnerships between local instrument makers and global vendors accelerate technology transfer and localization. Investment in digital connectivity and analytical software further enhances instrument value by enabling real time data integration and compliance reporting across complex supply chains.
NIR And Raman Spectroscopy Market Germany benefits from a robust manufacturing ecosystem that supports instrument development and industrial deployment. Integration with automation and process control systems is common, driven by close ties between instrument makers and scale producers in chemicals and automotive. Strong certification laboratories and research institutes help validate methods for industrial use. A dense service network ensures calibration and maintenance, enabling sustained adoption across laboratory and process environments.
NIR And Raman Spectroscopy Market United Kingdom features rapid uptake supported by strong university industry collaborations. Innovation hubs and startups develop portable solutions while research organizations expand laboratory services. National health and research institutions back translational projects that ease regulatory acceptance and procurement. A vibrant analytics software ecosystem complements instruments, enabling end users to integrate spectroscopy into clinical, pharmaceutical, and industrial quality workflows with increasing confidence and manufacturing process control.
NIR And Raman Spectroscopy Market France is emerging through targeted investment in agrofood, cosmetics, and pharmaceutical testing capabilities. Public research institutions and innovation clusters promote applied spectroscopy projects that address local industry needs. Domestic instrument distributors and service providers tailor solutions for regulatory nuances while partnerships with international vendors accelerate access to advanced technologies. Growing emphasis on quality assurance and product traceability supports wider adoption across laboratory applications and manufacturing.
Asia Pacific is strengthening its role in the NIR And Raman spectroscopy market by combining rising domestic demand with targeted technological capability building and strategic partnerships. Regional manufacturers are adapting designs to local application needs and cost expectations, while multinational vendors deepen local service footprints through joint ventures and distribution agreements. Strong demand from pharmaceutical, electronics, and chemical manufacturing sectors drives adoption of both laboratory and process analytical solutions. Government supported research centers and industrial programs cultivate skilled talent and application know how. Investments in local calibration, validation services, and software localization reduce barriers to deployment, enabling wider adoption across small and large end users and creating a dynamic market environment that increasingly complements global supply chains. Localized pilot projects help tailor solutions and accelerate practical uptake across industrial segments.
NIR And Raman Spectroscopy Market Japan centers on precision instrument engineering and integration with automation. Established manufacturers collaborate with research institutions to refine hardware and software for demanding industrial applications. Adoption is significant in electronics and automotive quality assurance, while academic centers advance methodological innovation. Extensive after sales support and local calibration services enable reliable deployment, and domestic vendors increasingly offer solutions that meet rigorous performance expectations and robust serviceability.
NIR And Raman Spectroscopy Market South Korea draws momentum from strong demand in semiconductor and electronics manufacturing and rapid adoption of high throughput techniques. Local instrument manufacturers and systems integrators collaborate with industrial groups to deliver tailored solutions embedded into production lines. Government research initiatives and centers support application development, while service networks provide calibration and validation capabilities. This ecosystem accelerates deployment and refinement of spectroscopy applications for quality control.
To know more about the market opportunities by region and country, click here to
Buy The Complete Report
Rising Demand In Pharmaceutical Analysis
Integration With Process Analytical Technologies
High Initial Equipment Costs
Complex Data Interpretation Requirements
Request Free Customization of this report to help us to meet your business objectives.
Competition in the global NIR and Raman spectroscopy market combines rapid product innovation with consolidation driven by life sciences demand for inline process analytics and industry demand for fieldable, compact instruments. Large vendors use acquisitions to add process Raman and AI analytics while challengers pursue miniaturization and on chip sensing. Examples include Bruker acquiring Tornado, HORIBA buying Process Instruments, Thermo Fisher integrating MarqMetrix and Agilent adding Aizon software.
Top Player’s Company Profile
Recent Developments
SkyQuest’s ABIRAW (Advanced Business Intelligence, Research & Analysis Wing) is our Business Information Services team that Collects, Collates, Correlates, and Analyses the Data collected by means of Primary Exploratory Research backed by robust Secondary Desk research. As per SkyQuest analysis, the global NIR and Raman spectroscopy market is driven by rising demand for rapid, noninvasive analytical techniques in pharmaceuticals, food safety and materials science, while integration of advanced chemometrics, AI and cloud connectivity accelerates adoption by turning spectral data into actionable process controls. High initial equipment costs limit uptake among smaller laboratories and cost conscious manufacturers, constraining broader diffusion. North America remains the dominant region due to strong instrument development, regulatory frameworks and service networks. Within market segments pneumatic and catapult launchers lead deployment preferences because their stable, low vibration profiles support sensitive field and test lab spectroscopy, sustaining instrument and service procurement.
| Report Metric | Details |
|---|---|
| Market size value in 2024 | USD 2.14 Billion |
| Market size value in 2033 | USD 2.1 Billion |
| Growth Rate | 6.9% |
| Base year | 2024 |
| Forecast period | (2026-2033) |
| Forecast Unit (Value) | USD Billion |
| Segments covered |
|
| Regions covered | North America (US, Canada), Europe (Germany, France, United Kingdom, Italy, Spain, Rest of Europe), Asia Pacific (China, India, Japan, Rest of Asia-Pacific), Latin America (Brazil, Rest of Latin America), Middle East & Africa (South Africa, GCC Countries, Rest of MEA) |
| Companies covered |
|
| Customization scope | Free report customization with purchase. Customization includes:-
|
To get a free trial access to our platform which is a one stop solution for all your data requirements for quicker decision making. This platform allows you to compare markets, competitors who are prominent in the market, and mega trends that are influencing the dynamics in the market. Also, get access to detailed SkyQuest exclusive matrix.
Table Of Content
Executive Summary
Market overview
Parent Market Analysis
Market overview
Market size
KEY MARKET INSIGHTS
COVID IMPACT
MARKET DYNAMICS & OUTLOOK
Market Size by Region
KEY COMPANY PROFILES
Methodology
For the NIR And Raman Spectroscopy Market, our research methodology involved a mixture of primary and secondary data sources. Key steps involved in the research process are listed below:
1. Information Procurement: This stage involved the procurement of Market data or related information via primary and secondary sources. The various secondary sources used included various company websites, annual reports, trade databases, and paid databases such as Hoover's, Bloomberg Business, Factiva, and Avention. Our team did 45 primary interactions Globally which included several stakeholders such as manufacturers, customers, key opinion leaders, etc. Overall, information procurement was one of the most extensive stages in our research process.
2. Information Analysis: This step involved triangulation of data through bottom-up and top-down approaches to estimate and validate the total size and future estimate of the NIR And Raman Spectroscopy Market.
3. Report Formulation: The final step entailed the placement of data points in appropriate Market spaces in an attempt to deduce viable conclusions.
4. Validation & Publishing: Validation is the most important step in the process. Validation & re-validation via an intricately designed process helped us finalize data points to be used for final calculations. The final Market estimates and forecasts were then aligned and sent to our panel of industry experts for validation of data. Once the validation was done the report was sent to our Quality Assurance team to ensure adherence to style guides, consistency & design.
Analyst Support
Customization Options
With the given market data, our dedicated team of analysts can offer you the following customization options are available for the NIR And Raman Spectroscopy Market:
Product Analysis: Product matrix, which offers a detailed comparison of the product portfolio of companies.
Regional Analysis: Further analysis of the NIR And Raman Spectroscopy Market for additional countries.
Competitive Analysis: Detailed analysis and profiling of additional Market players & comparative analysis of competitive products.
Go to Market Strategy: Find the high-growth channels to invest your marketing efforts and increase your customer base.
Innovation Mapping: Identify racial solutions and innovation, connected to deep ecosystems of innovators, start-ups, academics, and strategic partners.
Category Intelligence: Customized intelligence that is relevant to their supply Markets will enable them to make smarter sourcing decisions and improve their category management.
Public Company Transcript Analysis: To improve the investment performance by generating new alpha and making better-informed decisions.
Social Media Listening: To analyze the conversations and trends happening not just around your brand, but around your industry as a whole, and use those insights to make better Marketing decisions.
REQUEST FOR SAMPLE
 REQUEST FREE CUSTOMIZATION


Want to customize this report? This report can be personalized according to your needs. Our analysts and industry experts will work directly with you to understand your requirements and provide you with customized data in a short amount of time. We offer $1000 worth of FREE customization at the time of purchase.
Feedback From Our Clients


 USA (+1) 351-333-4748

