Network as a Service Market Size, Share, Growth Analysis, By Type (WANaaS, LANaaS), By Application (Cloud and SaaS Connectivity, Bandwidth on Demand (BOD)), By Vertical (BFSI, Retail), By Region -Industry Forecast 2024-2031


Report ID: SQMIG45A2370 | Region: Global | Published Date: November, 2024
Pages: 181 |Tables: 0 |Figures: 0

Network as a Service Market Insights

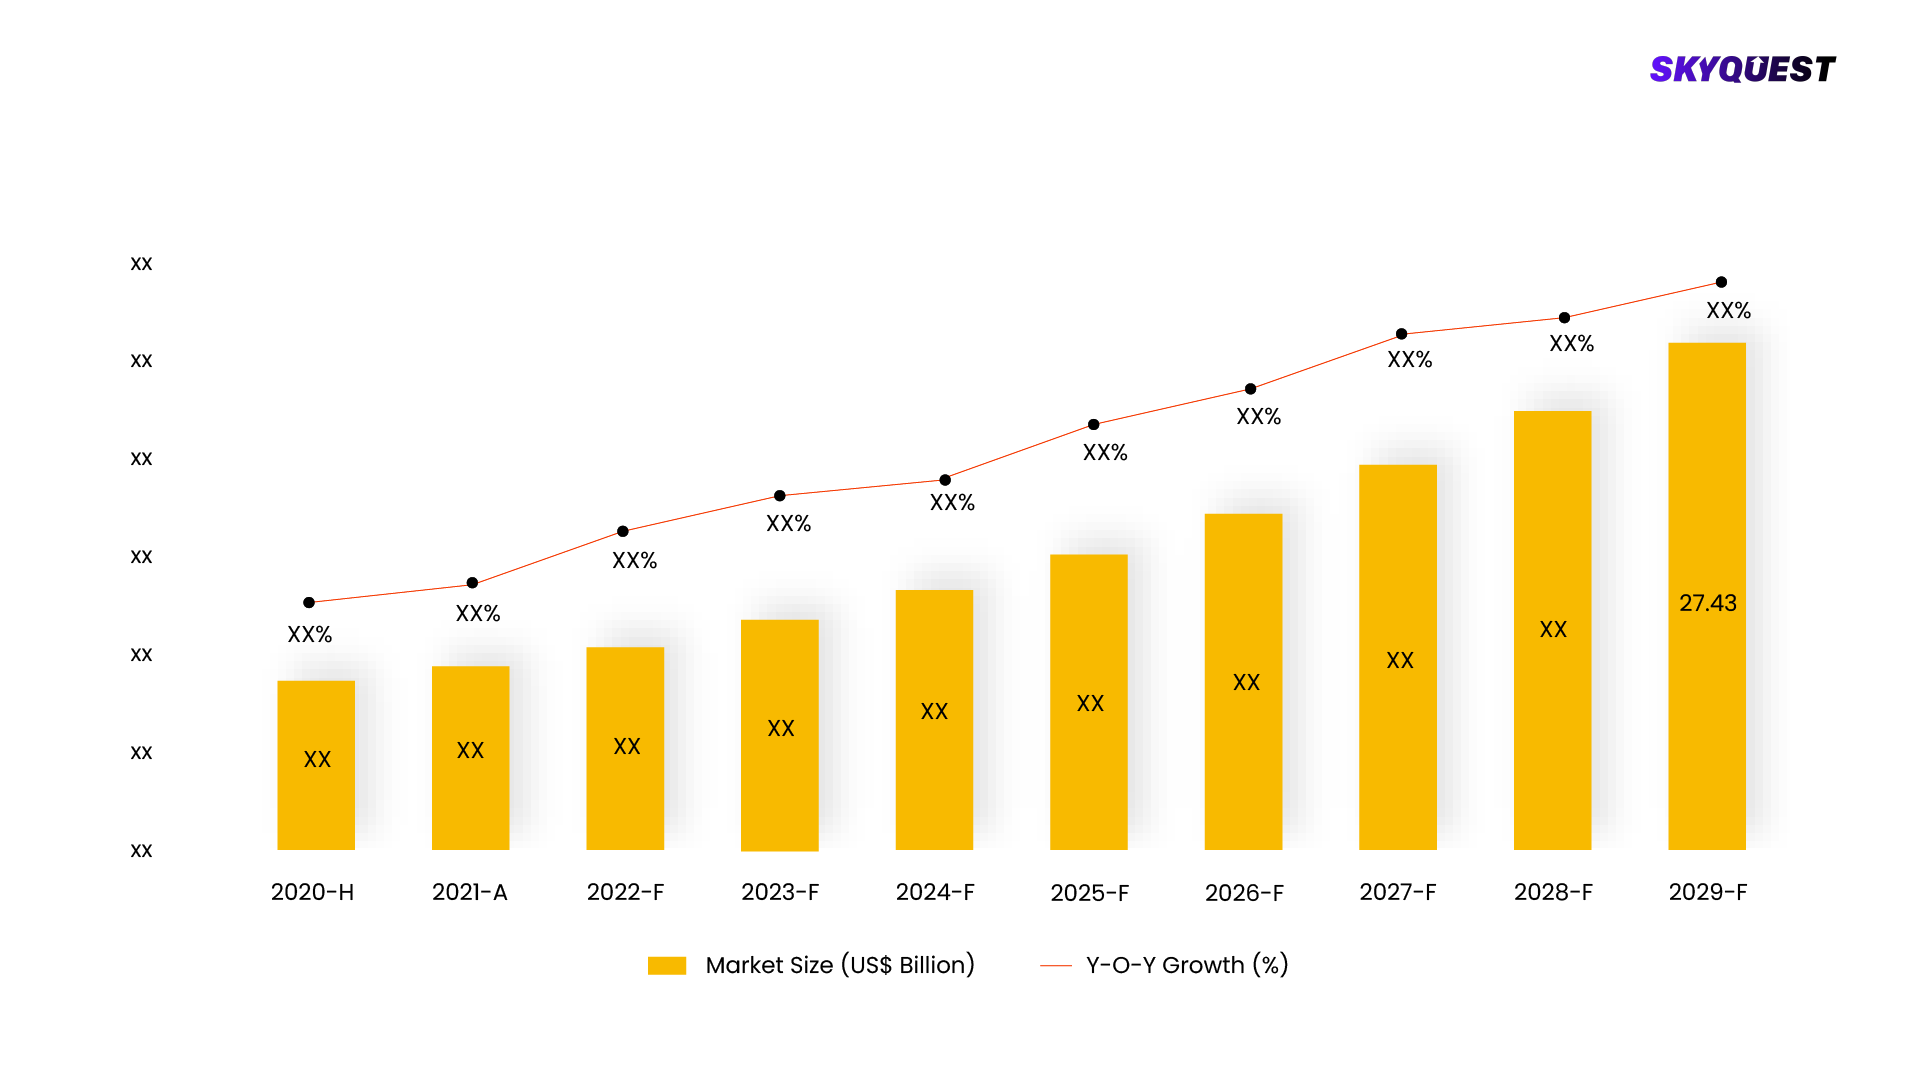
Global Network as a Service Market size was valued at USD 11.78 Billion in 2022 and is poised to grow from USD 15.66 Billion in 2023 to USD 114.65 Billion by 2031, growing at a CAGR of 32.9% in the forecast period (2024-2031).

The growth is attributed to increasing use of Network as a service (NaaS), as it costs less, offers more scalability. Increased demand for wider and faster network coverage and cloud adoption. They are widely used for data storage. Some of the factors fueling network as a service market growth are BFSI, manufacturing, retail, manufacturing. The widespread adoption of NaaS in many verticals like, transportation & logistics is contributing positively to the growth of network as a service market.

This network as a service industry is growing exponentially due to technological innovation and user appetite for cloud-based web services. Vertical organizations embrace network services to enable more efficient use of resources, reducing capital costs, improving performance and increasing time. NaaS lets users/customers charge network service costs from cloud providers. It is a cloud model that provides communication services over the Internet on a subscription model.

Network services are provided by network service providers and cloud providers for network products such as VPNs, WANs, and firewalls enables customers to monitor and operate their networks without having to manage network infrastructure. This includes a combination of hardware, software, licensing, and managed services. NaaS subscriptions for businesses and organizations with hardware and managed services.

Network as a service (NaaS) enables organizations and enterprises alike to maximize flexibility and performance for their network infrastructure. On-demand purchasing allows companies to be more cost-effective and only pay for essential communication infrastructure. Network as a service (NaaS) can also provide organizations in need of significant supply chain flexibility, without having to rebuild networks or renegotiate contracts from scratch.

NaaS offers businesses greater flexibility and opportunities to improve communications. Organizations can emphasize costs by billing for the specific network services requested through on-demand purchases. NaaS also enables businesses that need to make significant provisioning changes without reworking their networks or contracts.

To get more reports on the above market click here to Buy The Report

Network as a Service Market Segmental Analysis

The network as a service market is segmented by type, application, vertical, and region. Based on type, the market is segmented into WANaaS, LANaaS, enterprise size. Based on application, the market is segmented as, UCaaS/video conferencing, cloud and SaaS connectivity, virtualized private network (VPN), bandwidth on demand (BoD), multi-branch connectivity, WAN optimization, secure web gateway, network access control, other applications. Based on vertical, the market is segmented as, BFSI, retail, IT & telecommunication, manufacturing, media and entertainment, education, healthcare, government, others. Based on region, the market is segmented as, North America, Asia-Pacific, Europe, Latin America, Middle East and Africa.

Analysis by Type

The WANaaS segment accounted for the largest network as a service market share at 87.0% in 2023. It is expected to register the fastest CAGR of 40.6% during the forecast period. This cloud-based wide area network (WAN) model is modeled as it will replace legacy WANs, which relied on manufacturing hardware. It uses multiple protocol label switching (MLPS) and other communication protocols, which are difficult to maintain. WANaaS replaces hardware devices as provided by the cloud. Verticals can configure a WAN with an internet connection and simple software. WANaaS is a core managed service that is suitable for mid-sized to mid-sized enterprises because it speeds up deployment, optimizes user productivity and experience, and reduces costs.

The LANaaS segment is expected to witness a CAGR of 31.6% during the forecast period. LANaaS is a networked business model and integrates the LAN with frequently changing enterprise/business needs. Provides scalable infrastructure at reduced hardware costs without complex configuration, multi-vendor support, comprehensive analytics, and multi-site. Ethernet Wi-Fi support LANaaS simplifies local network connectivity, and it protects, enhances user experience, and optimizes through zero-touch deployment of applications. It ensures wired and wireless connectivity. Through LANaaS, companies can access the benefits of a high-performance, fully managed network infrastructure without the need for significant capital investment or ongoing in-house management.

Analysis by Application

The cloud and SaaS connectivity segment generated the highest revenue growth of over 32% in 2023. It is expected to grow at a CAGR of 33.6% during the forecast period. The high adoption of technology and consumer trend towards cloud is driving the adoption of cloud- based solutions. Cloud-based services and solutions enable verticals to access data from remote locations. It allows for scalability, migration, mobility, data recovery, and increasing performance. Organizations can achieve increased scaling, network assurance and cost-time at affordable costs resulting in faster adoption of cloud-based solutions in the enterprise.

The bandwidth on demand (BoD) segment is expected to register a CAGR of 34.6% during the forecast period. Bandwidth on Demand provides the bandwidth needed to enhance the user experience, simplify the interface to make service requests, and allow the application developer to pool. QoS resources and increase agility through automated provisioning and optimized network capacity planning. Reduces network operation complexity and costs, delivers competitive services in a customized and flexible network with defined transportation software. BoD administers service level agreements, identifies and resolves issues, manages routes, and delivers network design which is quick.

To get detailed analysis on other segments, Request For Free Sample Report

Network as a Service Market Regional Insights

North America led the largest revenue share of over 47.0% in 2023, due to rapid adoption of network as a service solutions. The major driver is the presence of important players such as Palo Alto, Amdocs, Megaport, Akamai, Cisco Systems Inc. and others. and other presence, which has driven the growth of the market. Significant companies invest heavily in data center research and development, and network infrastructure supports growth. In addition, the widespread adoption of IoT and cloud-based services is fueling the network as a service market growth. Businesses and organizations are modernizing their traditional networks with advanced IT infrastructure, network virtualization solutions and cloud computing services. Cloud providers and telecom service providers are adopting and using cloud platforms to eliminate complex network deployment management.

As per network as a service market outlook, Asia Pacific is expected to expand at a substantial CAGR of 34.1% throughout the forecast period. The growth is driven by increasing use of cloud computing driven by startups adopting SaaS, PaaS and NaaS cloud services in the region. India and China have a wide and distributed customer base driving demand and creating new opportunities. The growth was driven by network infrastructure improvements, CAPEX across the region and increased demand to reduce government infrastructure. Additionally, the untapped potential of the sector provides new investment opportunities for technology upgrades and upgrades such as Bring Your Own Device (BYOD) technology. In addition, MNCs are expanding their presence across the APAC region, resulting in a wider customer base and Internet customers that provide opportunities for profitable growth.

To know more about the market opportunities by region and country, click here to
Buy The Complete Report

Network as a Service Market Dynamics

Drivers

  • Increasing Demand for Cloud-based Communications Solutions

The increasing shift towards cloud-based communications solutions has given rise to the network as a service market as enterprises embrace and demand digital transformation communication solutions that are as flexible and flexible as their cloud's environment. NaaS provides enterprises with on-demand network infrastructure, enabling them to seamlessly expand operations without significant physical infrastructure investments. This requirement is particularly prominent in organizations that are adopting hybrid business models, where flexibility and remote connectivity have become increasingly important in maintaining productivity and collaboration.

  • Cost Savings and Operational Efficiencies

Another important driver is the cost savings offered by the NaaS model. Unlike traditional networks that require high CAPEX for hardware, NaaS works on a subscription basis, turning networks into OPEX models. This flexibility enables enterprises to reduce upfront costs by providing access to the latest web technologies and updates, ultimately reducing the overall cost of ownership. NaaS model also allows organizations to reallocate IT resources to more strategic tasks, as service providers handle network management and maintenance.

Restraints

  • Security and Privacy Concerns

One of the main limitations in the network as a service industry is security and privacy concerns, which arise when network services are managed externally. While NaaS providers manage the enterprise network services, including data traffic, so businesses face the risk of data breaches and unauthorized access. These concerns are particularly significant for companies with complex data security requirements, such as healthcare and finance, where any data security breach can have significant legal and financial implications.

  • Reliance on Internet Connectivity

NaaS models rely heavily on stable and high-speed Internet connections. Any disruption of Internet service can significantly affect network performance, causing potential downtime and service interruptions. This reliance on continuous networks can be a hindrance for companies in regions that do not yet fully rely on networks, affecting potential market growth in those areas. Furthermore, uninterrupted networks internal requirements increase pressure on NaaS providers to ensure robust solution support and high uptime commitments.

Request Free Customization of this report to help us to meet your business objectives.

Network as a Service Market Competitive Landscape

The competitive landscape of the network as a service market has been characterized by innovations, strategic partnerships, and huge investments in R&D. Key players are competing based on technology, supply chain and local presence, with an emphasis on meeting the requirements of industries such as the semiconductor industry, consumer electronics, automotive and telecommunications. Japan-based Advantest is a global leader in the market, known for its advanced semiconductor test equipment. The company focuses on high-performance, scalable solutions and is particularly strong in the market. Advantest's investment in R&D is substantial, ensuring its competitiveness with next-generation test systems designed for complex integrated circuits (ICs) and 5G-enabled devices.

Top Player’s Company Profiles

  • Palo Alto
  • Amdocs
  • Megaport
  • Akamai
  • Cisco Systems Inc.
  • Cloudflare
  • AT&T Inc.
  • Verizon Communications Inc.
  • DXC Technology Company
  • Synnex Corporation
  • NEC Corporation
  • Hewlett Packard Enterprise Co.
  • IBM Corporation

Recent Developments

  • February 2024: Nokia and Liberty Global, a combined video, broadband and communications company, ship with Telenet, a Belgian subsidiary of Liberty Global, using Nokia's network-as-a-code platform to provide services in Antwerp the station provides developers with improved access to network services and data.
  • June 2024: Verizon Business announced that its NaaS cloud management service enables businesses to manage application features and network configuration in cloud environments, all in one integrated online portal. The solution works with and delivers Verizon Business's NaaS offering managing multiple clouds is easier.
  • October 2023: Lumen Technologies announced the integration of its Network as a service (NaaS) platform with Equinix Fabric, allowing customers to purchase, deploy and manage Lumen Internet On-Demand and future Lumen.

Network as a Service Key Market Trends

  • Integration of AI Automation for Advanced Network Management: The key trend shaping the market is the integration of artificial intelligence (AI) and automation into network management. AI-powered tools are widely used to monitor network performance, detect anomalies and respond to real possibilities time. Automation also streamlines tasks such as bandwidth allocation, troubleshooting, and scaling resources when required. Together, these technologies reduce the need for manual intervention, increase network reliability, and improve customer satisfaction, positioning AI and automation as imperatives in a NaaS offering.
  • Rising adoption of 5G and Edge Computing: The rise of 5G and edge computing is also changing the market. As 5G networks expand, they enable faster, lower-cost connections, enabling NaaS providers to deliver advanced services with less latency. In addition, edge computing can perform data processing closer to the source, reducing latency and improving network response time. These advances are particularly useful in industries such as IoT and smart cities, where rapid data processing is essential. The combination of 5G and edge computing and NaaS solutions is expected to drive market demand as enterprises deploy faster and more efficient networks to support real-time deployment.

Network as a Service Market SkyQuest Analysis

SkyQuest’s ABIRAW (Advanced Business Intelligence, Research & Analysis Wing) is our Business Information Services team that Collects, Collates, Correlates, and Analyses the Data collected by means of Primary Exploratory Research backed by robust Secondary Desk research. 

According to SkyQuest analysis, the increasing construction of new data center infrastructure across the globe is fueling the growth of the network as a service market. Several key factors are driving this expansion, including increased use of cloud computing for data storage, inclusion of big data analytics, in-center virtualization to improve operational efficiencies. These developments have driven resources better utilization, greater availability, lower total cost results. Additionally, the growing need for network virtualization, cloud computing, and subscription-based per-use business models in software-defined network (SDN) significantly influences the market consumed by the increasing use of cloud services meeting the requirements of large and small organizations. The network as a service market is experiencing strong growth, driven by increasing demand for flexible, scalable and cost-effective networking solutions. NaaS enables enterprises to manage their network resources through a model-based model cloud based without the need for a large hardware investment build. This approach supports a dynamic business environment, especially as organizations adopt hybrid business models and expand their reliance on cloud services. Major industries such as information technology, telecommunications and healthcare are rapidly adopting NaaS to gain in operational efficiencies and cost savings. The shift to a cloud-based network model raises data security concerns, especially as network management moves away from traditional on-premises control. NaaS offers a subscription-based model that reduces CAPEX, making it more attractive to businesses aim to improve the economy and efficiency.

Report Metric Details
Market size value in 2022 USD 11.78 Billion
Market size value in 2031 USD 114.65 Billion
Growth Rate 32.9%
Base year 2023
Forecast period (2024-2031)
Forecast Unit (Value) USD Billion
Segments covered
  • Type
    • WANaaS, LANaaS, Enterprise Size
  • Application
    • UCaaS/Video Conferencing, Cloud and SaaS Connectivity, Virtualized Private Network (VPN), Bandwidth on Demand, Multi-Branch Connectivity, WAN Optimization, Secure Web Gateway, Network Access Control, Other Applications
  • Vertical
    • BFSI, Retail, IT & Telecommunication, Manufacturing, Media and Entertainment, Education, Healthcare, Government, Others
Regions covered North America (US, Canada), Europe (Germany, France, United Kingdom, Italy, Spain, Rest of Europe), Asia Pacific (China, India, Japan, Rest of Asia-Pacific), Latin America (Brazil, Rest of Latin America), Middle East & Africa (South Africa, GCC Countries, Rest of MEA)
Companies covered
  • Palo Alto
  • Amdocs
  • Megaport
  • Akamai
  • Cisco Systems Inc.
  • Cloudflare
  • AT&T Inc.
  • Verizon Communications Inc.
  • DXC Technology Company
  • Synnex Corporation
  • NEC Corporation
  • Hewlett Packard Enterprise Co.
  • IBM Corporation
Customization scope

Free report customization with purchase. Customization includes:-

  • Segments by type, application, etc
  • Company profile
  • Market dynamics & outlook
  • Region

To get a free trial access to our platform which is a one stop solution for all your data requirements for quicker decision making. This platform allows you to compare markets, competitors who are prominent in the market, and mega trends that are influencing the dynamics in the market. Also, get access to detailed SkyQuest exclusive matrix.

Buy The Complete Report to read the analyzed strategies adopted by the top vendors either to retain or gain market share

Table Of Content

Executive Summary

Market overview

  • Exhibit: Executive Summary – Chart on Market Overview
  • Exhibit: Executive Summary – Data Table on Market Overview
  • Exhibit: Executive Summary – Chart on Network as a Service Market Characteristics
  • Exhibit: Executive Summary – Chart on Market by Geography
  • Exhibit: Executive Summary – Chart on Market Segmentation
  • Exhibit: Executive Summary – Chart on Incremental Growth
  • Exhibit: Executive Summary – Data Table on Incremental Growth
  • Exhibit: Executive Summary – Chart on Vendor Market Positioning

Parent Market Analysis

Market overview

Market size

  • Market Dynamics
    • Exhibit: Impact analysis of DROC, 2021
      • Drivers
      • Opportunities
      • Restraints
      • Challenges
  • SWOT Analysis

KEY MARKET INSIGHTS

  • Technology Analysis
    • (Exhibit: Data Table: Name of technology and details)
  • Pricing Analysis
    • (Exhibit: Data Table: Name of technology and pricing details)
  • Supply Chain Analysis
    • (Exhibit: Detailed Supply Chain Presentation)
  • Value Chain Analysis
    • (Exhibit: Detailed Value Chain Presentation)
  • Ecosystem Of the Market
    • Exhibit: Parent Market Ecosystem Market Analysis
    • Exhibit: Market Characteristics of Parent Market
  • IP Analysis
    • (Exhibit: Data Table: Name of product/technology, patents filed, inventor/company name, acquiring firm)
  • Trade Analysis
    • (Exhibit: Data Table: Import and Export data details)
  • Startup Analysis
    • (Exhibit: Data Table: Emerging startups details)
  • Raw Material Analysis
    • (Exhibit: Data Table: Mapping of key raw materials)
  • Innovation Matrix
    • (Exhibit: Positioning Matrix: Mapping of new and existing technologies)
  • Pipeline product Analysis
    • (Exhibit: Data Table: Name of companies and pipeline products, regional mapping)
  • Macroeconomic Indicators

COVID IMPACT

  • Introduction
  • Impact On Economy—scenario Assessment
    • Exhibit: Data on GDP - Year-over-year growth 2016-2022 (%)
  • Revised Market Size
    • Exhibit: Data Table on Network as a Service Market size and forecast 2021-2027 ($ million)
  • Impact Of COVID On Key Segments
    • Exhibit: Data Table on Segment Market size and forecast 2021-2027 ($ million)
  • COVID Strategies By Company
    • Exhibit: Analysis on key strategies adopted by companies

MARKET DYNAMICS & OUTLOOK

  • Market Dynamics
    • Exhibit: Impact analysis of DROC, 2021
      • Drivers
      • Opportunities
      • Restraints
      • Challenges
  • Regulatory Landscape
    • Exhibit: Data Table on regulation from different region
  • SWOT Analysis
  • Porters Analysis
    • Competitive rivalry
      • Exhibit: Competitive rivalry Impact of key factors, 2021
    • Threat of substitute products
      • Exhibit: Threat of Substitute Products Impact of key factors, 2021
    • Bargaining power of buyers
      • Exhibit: buyers bargaining power Impact of key factors, 2021
    • Threat of new entrants
      • Exhibit: Threat of new entrants Impact of key factors, 2021
    • Bargaining power of suppliers
      • Exhibit: Threat of suppliers bargaining power Impact of key factors, 2021
  • Skyquest special insights on future disruptions
    • Political Impact
    • Economic impact
    • Social Impact
    • Technical Impact
    • Environmental Impact
    • Legal Impact

Market Size by Region

  • Chart on Market share by geography 2021-2027 (%)
  • Data Table on Market share by geography 2021-2027(%)
  • North America
    • Chart on Market share by country 2021-2027 (%)
    • Data Table on Market share by country 2021-2027(%)
    • USA
      • Exhibit: Chart on Market share 2021-2027 (%)
      • Exhibit: Market size and forecast 2021-2027 ($ million)
    • Canada
      • Exhibit: Chart on Market share 2021-2027 (%)
      • Exhibit: Market size and forecast 2021-2027 ($ million)
  • Europe
    • Chart on Market share by country 2021-2027 (%)
    • Data Table on Market share by country 2021-2027(%)
    • Germany
      • Exhibit: Chart on Market share 2021-2027 (%)
      • Exhibit: Market size and forecast 2021-2027 ($ million)
    • Spain
      • Exhibit: Chart on Market share 2021-2027 (%)
      • Exhibit: Market size and forecast 2021-2027 ($ million)
    • France
      • Exhibit: Chart on Market share 2021-2027 (%)
      • Exhibit: Market size and forecast 2021-2027 ($ million)
    • UK
      • Exhibit: Chart on Market share 2021-2027 (%)
      • Exhibit: Market size and forecast 2021-2027 ($ million)
    • Rest of Europe
      • Exhibit: Chart on Market share 2021-2027 (%)
      • Exhibit: Market size and forecast 2021-2027 ($ million)
  • Asia Pacific
    • Chart on Market share by country 2021-2027 (%)
    • Data Table on Market share by country 2021-2027(%)
    • China
      • Exhibit: Chart on Market share 2021-2027 (%)
      • Exhibit: Market size and forecast 2021-2027 ($ million)
    • India
      • Exhibit: Chart on Market share 2021-2027 (%)
      • Exhibit: Market size and forecast 2021-2027 ($ million)
    • Japan
      • Exhibit: Chart on Market share 2021-2027 (%)
      • Exhibit: Market size and forecast 2021-2027 ($ million)
    • South Korea
      • Exhibit: Chart on Market share 2021-2027 (%)
      • Exhibit: Market size and forecast 2021-2027 ($ million)
    • Rest of Asia Pacific
      • Exhibit: Chart on Market share 2021-2027 (%)
      • Exhibit: Market size and forecast 2021-2027 ($ million)
  • Latin America
    • Chart on Market share by country 2021-2027 (%)
    • Data Table on Market share by country 2021-2027(%)
    • Brazil
      • Exhibit: Chart on Market share 2021-2027 (%)
      • Exhibit: Market size and forecast 2021-2027 ($ million)
    • Rest of South America
      • Exhibit: Chart on Market share 2021-2027 (%)
      • Exhibit: Market size and forecast 2021-2027 ($ million)
  • Middle East & Africa (MEA)
    • Chart on Market share by country 2021-2027 (%)
    • Data Table on Market share by country 2021-2027(%)
    • GCC Countries
      • Exhibit: Chart on Market share 2021-2027 (%)
      • Exhibit: Market size and forecast 2021-2027 ($ million)
    • South Africa
      • Exhibit: Chart on Market share 2021-2027 (%)
      • Exhibit: Market size and forecast 2021-2027 ($ million)
    • Rest of MEA
      • Exhibit: Chart on Market share 2021-2027 (%)
      • Exhibit: Market size and forecast 2021-2027 ($ million)

KEY COMPANY PROFILES

  • Competitive Landscape
    • Total number of companies covered
      • Exhibit: companies covered in the report, 2021
    • Top companies market positioning
      • Exhibit: company positioning matrix, 2021
    • Top companies market Share
      • Exhibit: Pie chart analysis on company market share, 2021(%)

Methodology

For the Network as a Service Market, our research methodology involved a mixture of primary and secondary data sources. Key steps involved in the research process are listed below:

1. Information Procurement: This stage involved the procurement of Market data or related information via primary and secondary sources. The various secondary sources used included various company websites, annual reports, trade databases, and paid databases such as Hoover's, Bloomberg Business, Factiva, and Avention. Our team did 45 primary interactions Globally which included several stakeholders such as manufacturers, customers, key opinion leaders, etc. Overall, information procurement was one of the most extensive stages in our research process.

2. Information Analysis: This step involved triangulation of data through bottom-up and top-down approaches to estimate and validate the total size and future estimate of the Network as a Service Market.

3. Report Formulation: The final step entailed the placement of data points in appropriate Market spaces in an attempt to deduce viable conclusions.

4. Validation & Publishing: Validation is the most important step in the process. Validation & re-validation via an intricately designed process helped us finalize data points to be used for final calculations. The final Market estimates and forecasts were then aligned and sent to our panel of industry experts for validation of data. Once the validation was done the report was sent to our Quality Assurance team to ensure adherence to style guides, consistency & design.

Analyst Support

Customization Options

With the given market data, our dedicated team of analysts can offer you the following customization options are available for the Network as a Service Market:

Product Analysis: Product matrix, which offers a detailed comparison of the product portfolio of companies.

Regional Analysis: Further analysis of the Network as a Service Market for additional countries.

Competitive Analysis: Detailed analysis and profiling of additional Market players & comparative analysis of competitive products.

Go to Market Strategy: Find the high-growth channels to invest your marketing efforts and increase your customer base.

Innovation Mapping: Identify racial solutions and innovation, connected to deep ecosystems of innovators, start-ups, academics, and strategic partners.

Category Intelligence: Customized intelligence that is relevant to their supply Markets will enable them to make smarter sourcing decisions and improve their category management.

Public Company Transcript Analysis: To improve the investment performance by generating new alpha and making better-informed decisions.

Social Media Listening: To analyze the conversations and trends happening not just around your brand, but around your industry as a whole, and use those insights to make better Marketing decisions.

$5,300
BUY NOW

REQUEST FOR SAMPLE

Want to customize this report?
REQUEST FREE CUSTOMIZATION

FAQs

Global Network as a Service Market size was valued at USD 11.78 Billion in 2022 and is poised to grow from USD 15.66 Billion in 2023 to USD 114.65 Billion by 2031, growing at a CAGR of 32.9% in the forecast period (2024-2031).

The competitive landscape of the network as a service market has been characterized by innovations, strategic partnerships, and huge investments in R&D. Key players are competing based on technology, supply chain and local presence, with an emphasis on meeting the requirements of industries such as the semiconductor industry, consumer electronics, automotive and telecommunications. Japan-based Advantest is a global leader in the market, known for its advanced semiconductor test equipment. The company focuses on high-performance, scalable solutions and is particularly strong in the market. Advantest's investment in R&D is substantial, ensuring its competitiveness with next-generation test systems designed for complex integrated circuits (ICs) and 5G-enabled devices. 'Palo Alto', 'Amdocs', 'Megaport', 'Akamai', 'Cisco Systems Inc.', 'Cloudflare', 'AT&T Inc.', 'Verizon Communications Inc.', 'DXC Technology Company', 'Synnex Corporation', 'NEC Corporation', 'Hewlett Packard Enterprise Co.', 'IBM Corporation'

Increasing Demand for Cloud-based Communications Solutions

Integration of AI Automation for Advanced Network Management: The key trend shaping the market is the integration of artificial intelligence (AI) and automation into network management. AI-powered tools are widely used to monitor network performance, detect anomalies and respond to real possibilities time. Automation also streamlines tasks such as bandwidth allocation, troubleshooting, and scaling resources when required. Together, these technologies reduce the need for manual intervention, increase network reliability, and improve customer satisfaction, positioning AI and automation as imperatives in a NaaS offering.

North America led the largest revenue share of over 47.0% in 2023, due to rapid adoption of network as a service solutions. The major driver is the presence of important players such as Palo Alto, Amdocs, Megaport, Akamai, Cisco Systems Inc. and others. and other presence, which has driven the growth of the market. Significant companies invest heavily in data center research and development, and network infrastructure supports growth. In addition, the widespread adoption of IoT and cloud-based services is fueling the network as a service market growth. Businesses and organizations are modernizing their traditional networks with advanced IT infrastructure, network virtualization solutions and cloud computing services. Cloud providers and telecom service providers are adopting and using cloud platforms to eliminate complex network deployment management.

Request Free Customization

Want to customize this report? This report can be personalized according to your needs. Our analysts and industry experts will work directly with you to understand your requirements and provide you with customized data in a short amount of time. We offer $1000 worth of FREE customization at the time of purchase.

logo-images

Feedback From Our Clients

Network as a Service Market

Report ID: SQMIG45A2370

sales@skyquestt.com
USA +1 351-333-4748

BUY NOW GET FREE SAMPLE