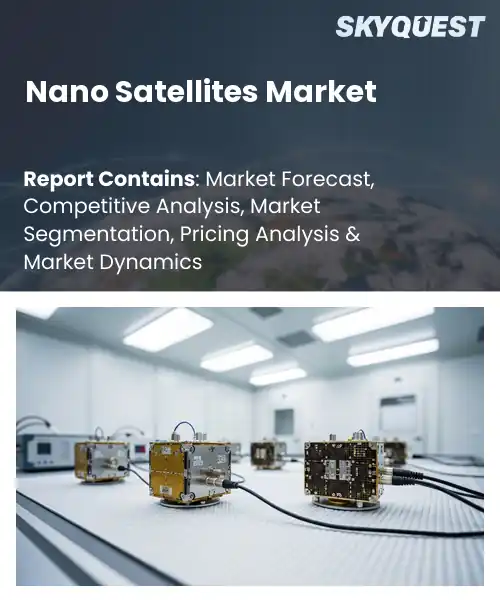
Nano Satellites Market
Report ID: SQMIG20A2807
Report ID: SQMIG20A2807
[email protected]
USA +1 351-333-4748
Report ID:
SQMIG20A2807 |
Region:
Global |
Published Date: July, 2026
Pages:
157
|Tables:
153
|Figures:
78


Global Nano Satellites Market size was valued at USD 3.26 Billion in 2024 and is poised to grow from USD 3.77 Billion in 2025 to USD 12.02 Billion by 2033, growing at a CAGR of 15.6% during the forecast period (2026-2033).
The nano‑satellite market revolves around compact spacecraft, typically under 10 kg, that deliver orbital capabilities at a fraction of traditional costs. Its emergence stems from the convergence of miniaturized electronics, commercial launch services, and regulatory frameworks that support low‑Earth‑orbit access. Early successes such as CubeSat deployments by universities in the early 2000s demonstrated feasibility, prompting aerospace firms to re‑engineer payloads for mass production. Over the past decade the sector has shifted from experimental missions to revenue‑generating constellations for Earth imaging, telecommunications, and scientific research, underscoring its growing strategic importance for both private and government actors in shaping future space infrastructure worldwide.
One key trend driving the global nano satellite sector is the surge in demand for real‑time, high‑resolution data across sectors such as agriculture, disaster response, and maritime logistics. As carriers lower launch prices through rideshare agreements, operators can field large constellations that refresh imagery multiple daily, enabling precision farming algorithms to adjust irrigation schedules and fertilizer applications, which in turn drives yield improvements and cost savings. Simultaneously, emergency management agencies leverage rapid‑deployment nano‑sats to fill communication gaps after natural catastrophes, illustrating how affordability translates into societal resilience and unlocks new revenue streams for service providers across both emerging and established markets.
How are AI and IoT Integrations Accelerating Growth in the Nano Satellite Market?
AI and IoT are reshaping the nano satellite landscape by turning small spacecraft into intelligent data hubs. Onboard AI enables real‑time image analysis, anomaly detection and autonomous maneuvering, reducing reliance on ground stations. IoT connectivity streams sensor feeds directly to cloud platforms, allowing seamless integration with smart‑city, agriculture and logistics applications. The market now hosts thousands of CubeSats that can be tasked on demand, creating a flexible constellation model. Operators benefit from lower latency, higher payload utilization and faster response to emerging use cases, which together drive investment and broaden the customer base beyond traditional aerospace players.
In January 2026, Nanosats.eu launched an AI‑driven catalog that links IoT sensor data to individual CubeSat missions, streamlining tasking and data downlink while boosting operational efficiency and market appeal.
Market snapshot - (2026-2033)
Global Market Size
USD 3.26 Billion
Largest Segment
1U
Fastest Growth
Above 6U
Growth Rate
15.6% CAGR
To get more insights on this market click here to Request a Free Sample Report
Global nano satellites market is segmented by platform type, application, subsystem, end user, orbit type and region. Based on platform type, the market is segmented into 1U, 2U–3U, 6U, above 6U and others. Based on application, the market is segmented into earth observation, communication, scientific research, technology demonstration and others. Based on subsystem, the market is segmented into payload, structure, power system, communication system and others. Based on end user, the market is segmented into commercial, government, defense, academic & research and others. Based on orbit type, the market is segmented into low earth orbit, medium earth orbit, geostationary orbit and others. Based on region, the market is segmented into North America, Europe, Asia Pacific, Latin America and Middle East & Africa.
Based on the global nano satellites market growth, 2U–3U platform stands out because it offers an optimal balance between payload capacity and launch cost efficiency, enabling versatile mission designs while fitting within standard deployer mechanisms. This flexibility attracts a broad customer base, from commercial operators to research institutions, fostering rapid adoption. The ease of integration and proven reliability further reinforce its leadership in the Nano Satellites Market across global constellations, increasing operational resilience.
Meanwhile, 6U platform is witnessing the strongest growth momentum as developers seek higher payload power and advanced processing within a compact form factor. Emerging demand for sophisticated imaging and communication payloads drives its adoption, unlocking new revenue streams in the industry and expanding the market’s technological frontier through innovative designs.
Earth observation application dominates because it leverages the high revisit rates and cost‑effective coverage offered by constellations of nano satellites, delivering timely data for climate monitoring, agriculture, and disaster response. These compelling use cases drive sustained investment, encourage partnerships, and create a virtuous cycle of technology refinement, cementing its central role in market expansion for both public and private sectors, across multiple industries, ensuring long‑term demand and fostering ecosystem development.
On the other hand, technology demonstration is emerging as the key high growth area as innovators use nano platforms to validate new sensors, AI processing, and propulsion concepts. This experimental focus attracts venture capital and accelerates technology readiness, broadening the market’s appeal and spawning future commercial and scientific missions.
To get detailed segments analysis, Request a Free Sample Report
As per the global nano satellites market share, Asia Pacific leads the industry due to a combination of advanced manufacturing ecosystems, strong governmental commitment to space innovation, and a vibrant startup culture that accelerates technology transfer. The region benefits from well‑established supply chains for electronics and miniaturized components, allowing rapid prototyping and cost‑effective production. Policy frameworks across Japan and South Korea encourage private investment and foster collaboration between research institutions and industry players. Additionally, strategic demand from communications, earth observation, and defense sectors creates a robust pipeline of applications, reinforcing the region’s competitive edge. The convergence of technical expertise, supportive regulation, and market appetite positions Asia Pacific as the most influential hub for nano satellite development globally. These dynamics also attract multinational firms seeking to leverage regional talent and infrastructure, further amplifying the ecosystem’s growth momentum.
Nano satellites market in Japan is propelled by a deep heritage in precision engineering and a cohesive national space policy that nurtures both legacy corporations and emerging innovators. Collaborative networks linking universities, research labs, and private firms accelerate knowledge transfer, while focused funding streams support mission‑critical demonstrations. The emphasis on high‑reliability components and modular design enables rapid integration into diverse applications ranging from scientific payloads to commercial constellations for global.
Nano satellites market in South Korea benefits from a strong governmental push toward autonomous satellite capabilities and a highly integrated electronics sector. The country’s expertise in miniaturized sensors and propulsion technologies translates into compact, high‑performance payloads that attract international collaborations. Investment in test‑beds and launch facilities shortens development cycles, while university‑driven incubators supply a steady pipeline of talent focused on innovative orbital solutions across communication and earth‑monitoring domains for future.
Based on global nano satellites regional forecast, North America experiences rapid expansion of the industry driven by an ecosystem that blends deep venture capital resources, advanced research institutions, and a flexible regulatory environment that encourages commercial launch services. The United States hosts a concentration of launch providers and a thriving developer community that iterates designs quickly, while Canada contributes strong expertise in satellite communications and a supportive policy landscape for small‑sat initiatives. Cross‑border collaborations accelerate technology standardisation, and the emphasis on dual‑use applications creates a broad customer base spanning commercial, scientific, and defense sectors. This synergy of financial muscle, technical talent, and policy encouragement fuels a sustained momentum that positions North America at the forefront of next‑generation satellite deployment.
Nano satellites market in United States is supported by a network of launch operators, research universities, and an entrepreneurial culture that speeds prototype development. Federal programmes and private funding provide access to cutting‑edge test facilities, while industry consortia promote interoperability standards needed for scaling constellations. Emphasis on high‑throughput communication, rapid‑revisit imaging, and responsive space capabilities draws a broad spectrum of customers, reinforcing United States role as a catalyst for global nano satellite innovation.
Nano satellites market in Canada leverages the nation’s strong heritage in satellite communications and a policy framework that encourages small‑sat deployment for remote connectivity and environmental monitoring. Collaboration between government agencies and academic centres cultivates specialized expertise in payload miniaturisation and low‑cost launch solutions. Incentives for commercial partnerships attract multinational interest, while a focus on sustainable operations aligns with broader climate objectives, positioning Canada as a key contributor to the evolving nano satellite ecosystem.
As per global nano satellites regional outlook, Europe strengthens its position in the industry through a coordinated blend of research excellence, industrial heritage, and policy‑driven incentives that foster collaborative development across borders. The European Union’s strategic roadmap emphasizes standardised frequencies, shared launch infrastructure, and joint mission concepts, enabling cost sharing and risk mitigation. Individual nations contribute deep expertise in components such as propulsion, telemetry, and payload sensors, while a growing constellation of startups benefits from venture capital increasingly directed toward space technology. Collaborative test sites and ground station networks enhance operational readiness, and the focus on sustainable, low‑impact satellite operations aligns with regional environmental commitments. This collective approach amplifies Europe’s influence in setting technical standards and expanding market adoption globally.
Nano satellites market in Germany is anchored by a robust aerospace sector and a strong emphasis on precision engineering that yields highly reliable miniature payloads. Government‑backed research initiatives collaborate closely with industrial partners to advance propulsion miniaturisation and autonomous navigation. The country’s extensive ground‑segment infrastructure supports rapid testing, while a network of universities cultivates talent skilled in satellite integration. Together these elements position Germany as a pivotal hub for high‑performance nano satellite solutions within Europe.
Nano satellites market in United Kingdom thrives on a vibrant startup ecosystem supported by strong research universities and a regulatory framework that encourages rapid licensing of small‑sat missions. Collaborative programmes between government agencies and private firms accelerate development of novel payloads and agile deployment strategies. The presence of dedicated launch services and a growing number of ground stations enhances operational flexibility, while policy focus on space sustainability drives innovation in de‑orbiting technologies, reinforcing United Kingdom role as an agile contributor to the continental nano satellite landscape.
Nano satellites market in France benefits from a strong heritage in aerospace and a national commitment to fostering space‑based services for scientific and commercial purposes. Collaborative clusters linking CNES, research institutes, and emerging firms drive advancements in miniaturised sensors and autonomous mission planning. The French regulatory approach streamlines spectrum allocation and launch licensing, while investment in specialized test facilities accelerates validation cycles. This combination of institutional support and technology leadership positions France as a key driver of innovative nano satellite applications across Europe.
To know more about the market opportunities by region and country, click here to
Buy The Complete Report
Miniaturization Enables Cost Reduction
Proliferation Of Constellation Services
Regulatory Complexity Limits Deployment
Limited Power Availability Constrains Capabilities
Request Free Customization of this report to help us to meet your business objectives.
The global nano satellite market outlook is intensely competitive as firms race to lower launch costs and increase constellation density. Startups such as STOKE SPACE pursue rapid‑reuse launch technology, while the French orbital‑debris venture leverages a partnership with the European Space Agency to validate its LEO cleanup platform. Established players also accelerate growth through strategic alliances and selective acquisitions of niche component providers.
Top Player’s Company Profile
Recent Developments
SkyQuest’s ABIRAW (Advanced Business Intelligence, Research & Analysis Wing) is our Business Information Services team that Collects, Collates, Correlates, and Analyses the Data collected by means of Primary Exploratory Research backed by robust Secondary Desk research.
As per SkyQuest analysis, the global nano satellite industry is being propelled primarily by the dramatic cost savings that come from component miniaturisation, which lets multiple units share a single launch and lowers entry barriers for commercial and government users. A second powerful boost comes from AI and IoT integration that turns small spacecraft into intelligent data hubs, enabling on‑board processing and instant cloud connectivity. The main restraint remains regulatory complexity, as varied licensing and debris‑mitigation rules can slow deployments and increase uncertainty. Asia Pacific dominates the market thanks to its advanced manufacturing base and supportive space policies, while the 2U‑3U platform segment leads in volume because it balances payload capability with launch‑cost efficiency.
| Report Metric | Details |
|---|---|
| Market size value in 2024 | USD 3.26 Billion |
| Market size value in 2033 | USD 12.02 Billion |
| Growth Rate | 15.6% |
| Base year | 2024 |
| Forecast period | (2026-2033) |
| Forecast Unit (Value) | USD Billion |
| Segments covered |
|
| Regions covered | North America (US, Canada), Europe (Germany, France, United Kingdom, Italy, Spain, Rest of Europe), Asia Pacific (China, India, Japan, Rest of Asia-Pacific), Latin America (Brazil, Rest of Latin America), Middle East & Africa (South Africa, GCC Countries, Rest of MEA) |
| Companies covered |
|
| Customization scope | Free report customization with purchase. Customization includes:-
|
To get a free trial access to our platform which is a one stop solution for all your data requirements for quicker decision making. This platform allows you to compare markets, competitors who are prominent in the market, and mega trends that are influencing the dynamics in the market. Also, get access to detailed SkyQuest exclusive matrix.
Table Of Content
Executive Summary
Market overview
Parent Market Analysis
Market overview
Market size
KEY MARKET INSIGHTS
COVID IMPACT
MARKET DYNAMICS & OUTLOOK
Market Size by Region
KEY COMPANY PROFILES
Methodology
For the Nano Satellites Market, our research methodology involved a mixture of primary and secondary data sources. Key steps involved in the research process are listed below:
1. Information Procurement: This stage involved the procurement of Market data or related information via primary and secondary sources. The various secondary sources used included various company websites, annual reports, trade databases, and paid databases such as Hoover's, Bloomberg Business, Factiva, and Avention. Our team did 45 primary interactions Globally which included several stakeholders such as manufacturers, customers, key opinion leaders, etc. Overall, information procurement was one of the most extensive stages in our research process.
2. Information Analysis: This step involved triangulation of data through bottom-up and top-down approaches to estimate and validate the total size and future estimate of the Nano Satellites Market.
3. Report Formulation: The final step entailed the placement of data points in appropriate Market spaces in an attempt to deduce viable conclusions.
4. Validation & Publishing: Validation is the most important step in the process. Validation & re-validation via an intricately designed process helped us finalize data points to be used for final calculations. The final Market estimates and forecasts were then aligned and sent to our panel of industry experts for validation of data. Once the validation was done the report was sent to our Quality Assurance team to ensure adherence to style guides, consistency & design.
Analyst Support
Customization Options
With the given market data, our dedicated team of analysts can offer you the following customization options are available for the Nano Satellites Market:
Product Analysis: Product matrix, which offers a detailed comparison of the product portfolio of companies.
Regional Analysis: Further analysis of the Nano Satellites Market for additional countries.
Competitive Analysis: Detailed analysis and profiling of additional Market players & comparative analysis of competitive products.
Go to Market Strategy: Find the high-growth channels to invest your marketing efforts and increase your customer base.
Innovation Mapping: Identify racial solutions and innovation, connected to deep ecosystems of innovators, start-ups, academics, and strategic partners.
Category Intelligence: Customized intelligence that is relevant to their supply Markets will enable them to make smarter sourcing decisions and improve their category management.
Public Company Transcript Analysis: To improve the investment performance by generating new alpha and making better-informed decisions.
Social Media Listening: To analyze the conversations and trends happening not just around your brand, but around your industry as a whole, and use those insights to make better Marketing decisions.
REQUEST FOR SAMPLE
 REQUEST FREE CUSTOMIZATION
Global Nano Satellites Market size was valued at USD 3.26 Billion in 2024 and is poised to grow from USD 3.77 Billion in 2025 to USD 12.02 Billion by 2033, growing at a CAGR of 15.6% during the forecast period (2026-2033).
The nano‑satellite market is intensely competitive as firms race to lower launch costs and increase constellation density. Startups such as STOKE SPACE pursue rapid‑reuse launch technology, while the French orbital‑debris venture leverages a partnership with the European Space Agency to validate its LEO cleanup platform. Established players also accelerate growth through strategic alliances and selective acquisitions of niche component providers. 'AAC Clyde Space AB', 'GomSpace Group AB', 'NanoAvionics Corp.', 'EnduroSat AD', 'SatRev S.A.', 'Tyvak International S.r.l.', 'ISISPACE Group', 'Open Cosmos Ltd.', 'Space Inventor A/S', 'Axelspace Corporation', 'Planet Labs PBC', 'Spire Global, Inc.', 'York Space Systems LLC', 'SITAEL S.p.A.', 'Berlin Space Technologies GmbH', 'DHV Technology S.L.', 'CubeSpace (Pty) Ltd.', 'Orbital Astronautics Ltd.', 'SatLab Geosolutions AB', 'NanoAvionics US Inc.'
The continuous reduction in component size allows manufacturers to use less material and streamline assembly processes, which directly lowers production expenses. Smaller payloads also enable launch providers to accommodate multiple units within a single launch vehicle, spreading costs across customers. This shared‑launch model reduces the financial barrier for entry‑level operators, fostering broader adoption of nano satellite solutions. As cost pressures ease, investment in research and development intensifies, further accelerating technological advancements and reinforcing market expansion. Consequently, commercial and governmental programs find nano satellites an attractive alternative to traditional platforms.
Rapid Constellation Deployment: The proliferation of low‑cost launch services and standardized nano‑satellite platforms has enabled operators to assemble large constellations within short timeframes, dramatically increasing coverage and redundancy for Earth observation, communications, and IoT connectivity. Companies are leveraging modular architectures to mass‑produce units, reducing per‑unit costs and accelerating rollout schedules. This momentum is shifting industry focus from single‑mission bespoke satellites to scalable fleets, prompting new business models centered on subscription‑based data services and on‑demand capacity provisioning across diverse verticals for governments, enterprises, NGOs.
Why does Asia Pacific Dominate the Global Nano Satellites Market? |@12


Want to customize this report? This report can be personalized according to your needs. Our analysts and industry experts will work directly with you to understand your requirements and provide you with customized data in a short amount of time. We offer $1000 worth of FREE customization at the time of purchase.
Feedback From Our Clients


 USA (+1) 351-333-4748

