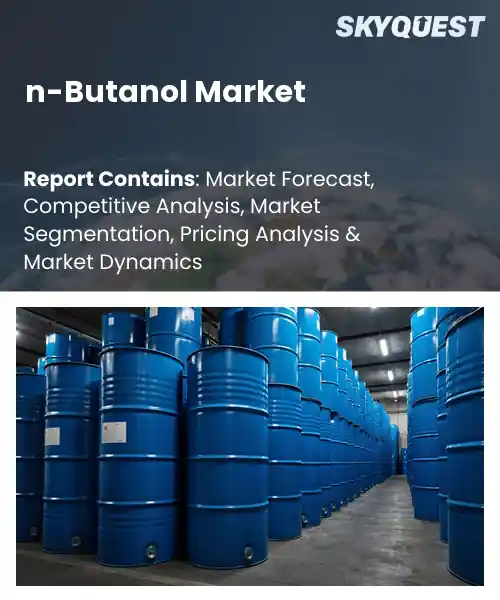
n-Butanol Market
Report ID: SQMIG15A2745
Report ID: SQMIG15A2745
[email protected]
USA +1 351-333-4748
Report ID:
SQMIG15A2745 |
Region:
Global |
Published Date: June, 2026
Pages:
157
|Tables:
174
|Figures:
79


Global N-Butanol Market size was valued at USD 5.6 Billion in 2024 and is poised to grow from USD 5.85 Billion in 2025 to USD 8.32 Billion by 2033, growing at a CAGR of 4.5% during the forecast period (2026-2033).
Growing demand for solvents and coatings, increasing consumption of plasticizers and butyl acrylate, rising construction and automotive manufacturing activities, expansion of chemical processing industries, and growing interest in bio-based chemicals are driving sales of n-butanol.
With greater environmental and safety awareness around new, growing regulations, new opportunities have opened for fermentation based biobutanol technologies, complementing other renewable fuels and chemicals to broaden supply sources and application choices. As markets evolve, a factor impacting their growth and development is feedstock flexibility. Fresh alternatives include conventional oxo-alcohol routes versus renewable routes and shifted production costs and GHG effects for regional supply mirrors. As more manufacturers develop bio-based processing options with sugarand cellulosic-based feedstocks, new opportunities are opening to market for sustainable industries, derive access to existing incentive measures, and build customer loyalty among packaging and coatings producers, transport OEMs and other manufacturers/ industries seeking lower-impact supply chains in the years ahead. Concurrently, abundant regional supplies of the available domestic and mixed biomass feedstocks are driving capacity additions and strengthening regional supply chains in North America, Europe, and SE Asia. Strong demand from downstream chemical industries is expected to primarily drive n-butanol market growth.
On the contrary, volatility in raw material prices, environmental and regulatory pressures on chemical manufacturing, availability of substitute solvents, and fluctuations in demand from end-use industries are estimated to slow down n-butanol market penetration going forward.
How is AI Improving Demand Forecasting in the N-butanol market?
Artificial intelligence (AI) enhances demand forecasting accuracy in the n-butanol market by using AI algorithms to combine internal business data with external market signals from other feeds and customer markets to make forecast predictions. AI-based models evaluate historical sales, inventory and production data along with upstream feedstock and downstream customer activity, as well as economic and logistics conditions, to quickly detect demand trends and shifts. This powerful insight enables n-butanol producers and suppliers to better match supply with seasonal as well as unanticipated incremental market changes. Future scenarios can be tested and simulated while inventories are minimized, and emergency repack plans eliminated for n-butanol logistics planning.
Market snapshot - (2026-2033)
Global Market Size
USD 5.6 Billion
Largest Segment
Oxo Process
Fastest Growth
Bio-Based Production
Growth Rate
4.5% CAGR
To get more insights on this market click here to Request a Free Sample Report
Global n-butanol market is segmented by production process, application, end user industry, grade, distribution channel, source, and region. Based on production process, the market is segmented into oxo process and bio-based production. Based on application, the market is segmented into butyl acrylate production, butyl acetate production, glycol ethers production, direct solvents, plasticizers production, and others. Based on end user industry, the market is segmented into paints & coatings, chemicals, adhesives & sealants, textiles, pharmaceuticals, and others. Based on grade, the market is segmented into industrial grade, chemical grade, and pharmaceutical grade. Based on distribution channel, the market is segmented into direct sales and distributors & traders. Based on source, the market is segmented into petrochemical-based and bio-based. Based on region, the market is segmented into North America, Europe, Asia Pacific, Latin America, and Middle East & Africa.
The Oxo Process segment is forecasted to lead the global n-Butanol market revenue generation in the long run. Current, proven level-of-operation petrochemical systems and mature catalyst technology allow conversion of the available pool of propylene to n-butanol at a high-yield on a large industrial scale. Integrated supply chains with accessibility to olefin feedstock minimizes operating cost complex and secures product quality, attracting large scale of end-users. Cost predictability supports current downstream process connection and reinforces industry favor to achieve high product yield; maintains capacity and investment.
However, bio-based production is emerging as the most rapidly expanding segment as per this n-Butanol market analysis. This is due to progressing fermentation process technologies and increasing demand for sustainable solvent feedstock. Enhancing feedstock flexibility and building positive regulatory trends are propelling commercial-scale initiatives, opening up fresh supply channels and high value markets. Such developments are spurring new investment in bio-refining facilities and producing distinctive low-carbon offerings for n-butanol consumers.
The Butyl Acrylate production segment is predicted to account for the highest global n-Butanol market share going forward. Major downstream demand from coating and adhesive chemistries supports continuous highvolume use of n-butanol as an alcohol intermediate. Its importance in esterification and alignment with key polymerization pathways results in foreseeable demand profiles, forming the basis for producer supply planning. Customers seek assured long-term supply through commercial agreements and technical specifications, under which production is directed to acrylate production and secure premium position within integrated aromatic-alkene building blocks.
However, the glycol ethers production segment is experiencing the highest growth momentum as formulators are looking for flexible solvent blends for solutions in specialty cleaning, electronic and industrial sector. Innovation in downstream solvent formulations and growing industrial cleaning requirements is encouraging more n-butanol consumption for glycol ether production thereby creating new high value applications along with encouraging capacity expansions throughout the supply chain.
To get detailed segments analysis, Request a Free Sample Report
Petrochemical ecosystems, concentrated end use demand, and integrated supply chains that link feedstock sources to large manufacturing clusters are helping this region hold sway over others. The region has a well-established manufacturing base for coatings, adhesives and specialty chemicals (MCAA) as well as active capacity expansion investments and a strong export orientation towards its surrounding countries. There are many strategic partnerships between chemical manufacturers, technology providers, and end users to accelerate the commercialization of innovative processes and sustainable practices. The region has a skilled workforce in petrochemical manufacturing, competitively priced supply of feedstock materials and strong ports and transportation infrastructure to provide reliable supply. There is cross border trade among countries in the region creating economies of scale and allowing quick reaction times to changing demands in many manufacturing industries. There are also several clustered research centers that develop new technologies for using catalytic conversions and green chemicals, which provide competitive advantage in the domestic and export markets.
n-Butanol market in Japan benefits from a sophisticated chemical industry base and strong integration between producers and advanced manufacturing sectors. Domestic demand from high performance coatings, electronics assembly and precision adhesives supports consumption, while local producers emphasize process efficiency and product consistency. Research institutions and industrial partners focus on incremental process improvements and alternative feedstocks. Japan supply chain advantages include logistical reliability and customer service orientation that sustain market positions.
n-Butanol demand in South Korea is centered on large petrochemical complexes and linked downstream industries that demand high quality solvent and intermediate streams. Industrial focus on automotive coatings, electronics adhesives and industrial chemicals supports product requirements. Local producers pursue operational efficiencies and partnerships with technology providers to maintain competitiveness. Export oriented manufacturing, efficient port connectivity and a regulatory environment that balances industry needs contribute to stable supply and customer engagement.
Dense network of specialty chemicals manufacturers, strong downstream demand from coatings, adhesives and personal care sectors, and an increasing emphasis on sustainable and circular production routes creates new opportunities in the region. policy frameworks and commitments at the corporate level that drive bio-based feedstock use and cleaner production technologies, which are encouraging the development of pilot-scale and commercial-scale investment projects. With Germany being the anchor for regional capacity and technical expertise, cross-border trade and premium demand for high-performance formulations support overall regional growth. Manufacturers can therefore produce differentiated grades and tailored supply solutions that meet the exacting quality and environmental requirements of their customers because of the existence of collaborative research and development, sophisticated customer specifications and well-established logistics corridors. The growth of the United Kingdom's specialty chemical industry, and France's focus on innovative and sustainable products, also complement the technical leadership of Germany, thus creating a balanced marketplace in which premium and green products will continue to gain momentum.
n-Butanol market in Germany is characterized by strong technical expertise and a base of specialty chemicals manufactures. Demand from automotive coatings, industrial adhesives and intermediates underpins requirements. Producers prioritize process reliability, product consistency and regulatory compliance while collaborative work between industry and research institutes advances process optimization. Germany logistical networks and industrial clustering enable efficient feedstock handling and allow manufacturers to supply tailored grades that meet performance and sustainability standards.
Emerging specialty chemicals segment focused on formulation innovation and sustainable sourcing are helping boost n-Butanol demand in the United Kingdom. Joint efforts among chemical producers, technology suppliers and brand owners are facilitating the adoption of greener processes. Logistics flexibility and research and development skills are allowing United Kingdom chemical producers to find the right positioning to seize niche opportunities. Coatings, personal care and industrial customers demanding differentiated solvent grades are having an impact on suppliers that are customizing chemical specifications and developing diverse formulations.
n-Butanol market in France is notable for strong emphasis on innovation, sustainability and adoption of bio-based feedstocks. Industry and research centers work together to foster sustainable production technology and commercialization of cosmetics, coatings and specialty intermediates. Regulatory and board agendas drive good value on,porcelain and bio derived alternatives. Leveraging financial, brand and end user liaising, French producers compete best in margin bands.
Capacity optimization, technological adoption and strategic supply chain integration that improve competitiveness and resilience help create new business scope in the region. Producers continue to optimize their processes, be flexible with source materials, and produce multiple different grades to serve customers in the automotive, coatings, and other industries. By partnering with downstream distributors and regional distribution networks, increasing service to end customers and shortening lead time for key end-users will continuously enhance the overall value of working in North America n-butanol. Interest in utilizing bio feedstocks or recycled n-butanol to supplement traditional production methods and work being done between manufacturers, logistics companies and customers will allow for many new opportunities within additional value-added chemistries/service offerings. Interest in producing specialty derivatives and providing formulations is causing a need for producers to develop quality chemistries/service offerings by collaborating with customers in their end markets. The presence of adequate mid-stream distribution systems and better connections to ports has given North America n-butanol some potential for increased export capabilities, as well as the promotion of laws and policies that will use environmentally friendly manufacturing processes and environmentally sustainable ingredients.
n-Butanol market in United States is driven by large scale chemical producers, diverse end markets and emphasis on process innovation. Demand from automotive coatings, industrial solvents and specialty intermediates supports product grades. Producers invest in operational efficiencies and partnerships with formulators to deliver tailored solutions. Robust midstream logistics and distribution networks enhance regional availability, while growing interest in renewable inputs and circular practices shapes product development priorities across manufacturing segments.
n-Butanol adoption in Canada reflects a focus on specialty grades, feedstock flexibility and integration with industrial clusters. Producers emphasize quality, regulatory compliance, and sustainable sourcing for domestic and export customers. Collaboration with research institutions and downstream formulators supports tailored development for coatings, adhesives and industrial applications. Efficient port access and trade relationships with neighboring markets enable Canadian suppliers to participate in North America supply chains while pursuing cleaner production pathways.
To know more about the market opportunities by region and country, click here to
Buy The Complete Report
Rising Demand From Solvent Applications
Growth In Biofuel Blending
Feedstock Price Volatility
Regulatory Compliance Challenges
Request Free Customization of this report to help us to meet your business objectives.
The n butanol competitive landscape is defined by incumbents pursuing decarbonization through partnerships, licensing and catalytic process scale up while technology newcomers push catalytic and microbial routes to displace fossil feedstocks; strategic examples include technology licensing and public innovation funding driving commercial pilots and industrial tie ups that shift procurement toward bio based intermediates.
SkyQuest’s ABIRAW (Advanced Business Intelligence, Research & Analysis Wing) is our Business Information Services team that Collects, Collates, Correlates, and Analyses the Data collected by means of Primary Exploratory Research backed by robust Secondary Desk research.
As per SkyQuest analysis, surge in demand for solvents and coatings, increasing consumption of plasticizers and butyl acrylate, rising construction and automotive manufacturing activities, and growing interest in bio-based chemicals are anticipated to drive the demand for n-butanol going forward. However, volatility in raw material prices, environmental and regulatory pressures on chemical manufacturing, and availability of substitute solvents are slated to slow down the adoption of n-butanol in the future. Asia Pacific is slated to spearhead the demand for n-butanol owing to strong growth in construction and automotive manufacturing activities, expanding chemical production capacity, and high consumption of coatings and adhesives. Development of AI-powered demand forecasting solutions, increasing investments in bio-based n-butanol production, and advancements in sustainable feedstock technologies are anticipated to be key trends driving the n-butanol sector through 2033.
| Report Metric | Details |
|---|---|
| Market size value in 2024 | USD 5.6 Billion |
| Market size value in 2033 | USD 8.32 Billion |
| Growth Rate | 4.5% |
| Base year | 2024 |
| Forecast period | (2026-2033) |
| Forecast Unit (Value) | USD Billion |
| Segments covered |
|
| Regions covered | North America (US, Canada), Europe (Germany, France, United Kingdom, Italy, Spain, Rest of Europe), Asia Pacific (China, India, Japan, Rest of Asia-Pacific), Latin America (Brazil, Rest of Latin America), Middle East & Africa (South Africa, GCC Countries, Rest of MEA) |
| Companies covered |
|
| Customization scope | Free report customization with purchase. Customization includes:-
|
To get a free trial access to our platform which is a one stop solution for all your data requirements for quicker decision making. This platform allows you to compare markets, competitors who are prominent in the market, and mega trends that are influencing the dynamics in the market. Also, get access to detailed SkyQuest exclusive matrix.
Table Of Content
Executive Summary
Market overview
Parent Market Analysis
Market overview
Market size
KEY MARKET INSIGHTS
COVID IMPACT
MARKET DYNAMICS & OUTLOOK
Market Size by Region
KEY COMPANY PROFILES
Methodology
For the n-Butanol Market, our research methodology involved a mixture of primary and secondary data sources. Key steps involved in the research process are listed below:
1. Information Procurement: This stage involved the procurement of Market data or related information via primary and secondary sources. The various secondary sources used included various company websites, annual reports, trade databases, and paid databases such as Hoover's, Bloomberg Business, Factiva, and Avention. Our team did 45 primary interactions Globally which included several stakeholders such as manufacturers, customers, key opinion leaders, etc. Overall, information procurement was one of the most extensive stages in our research process.
2. Information Analysis: This step involved triangulation of data through bottom-up and top-down approaches to estimate and validate the total size and future estimate of the n-Butanol Market.
3. Report Formulation: The final step entailed the placement of data points in appropriate Market spaces in an attempt to deduce viable conclusions.
4. Validation & Publishing: Validation is the most important step in the process. Validation & re-validation via an intricately designed process helped us finalize data points to be used for final calculations. The final Market estimates and forecasts were then aligned and sent to our panel of industry experts for validation of data. Once the validation was done the report was sent to our Quality Assurance team to ensure adherence to style guides, consistency & design.
Analyst Support
Customization Options
With the given market data, our dedicated team of analysts can offer you the following customization options are available for the n-Butanol Market:
Product Analysis: Product matrix, which offers a detailed comparison of the product portfolio of companies.
Regional Analysis: Further analysis of the n-Butanol Market for additional countries.
Competitive Analysis: Detailed analysis and profiling of additional Market players & comparative analysis of competitive products.
Go to Market Strategy: Find the high-growth channels to invest your marketing efforts and increase your customer base.
Innovation Mapping: Identify racial solutions and innovation, connected to deep ecosystems of innovators, start-ups, academics, and strategic partners.
Category Intelligence: Customized intelligence that is relevant to their supply Markets will enable them to make smarter sourcing decisions and improve their category management.
Public Company Transcript Analysis: To improve the investment performance by generating new alpha and making better-informed decisions.
Social Media Listening: To analyze the conversations and trends happening not just around your brand, but around your industry as a whole, and use those insights to make better Marketing decisions.
REQUEST FOR SAMPLE
 REQUEST FREE CUSTOMIZATION
Global N-Butanol Market size was valued at USD 5.6 Billion in 2024 and is poised to grow from USD 5.85 Billion in 2025 to USD 8.32 Billion by 2033, growing at a CAGR of 4.5% during the forecast period (2026-2033).
The n butanol competitive landscape is defined by incumbents pursuing decarbonization through partnerships, licensing and catalytic process scale up while technology newcomers push catalytic and microbial routes to displace fossil feedstocks; strategic examples include technology licensing and public innovation funding driving commercial pilots and industrial tie ups that shift procurement toward bio based intermediates. 'BASF', 'OQ', 'Dow', 'Eastman Chemical Company', 'Sasol', 'PetroChina', 'Sinopec', 'Formosa Plastics Corporation', 'KH Neochem', 'Mitsubishi Chemical Group', 'LG Chem', 'Mitsui Chemicals', 'Hanwha Solutions', 'SABIC', 'LyondellBasell Industries', 'Shandong Jianlan Chemical', 'Luxi Chemical Group', 'Zibo Qixiang Tengda Chemical', 'PETRONAS Chemicals Group', 'INEOS Group'
Rising demand for n-butanol as a versatile solvent across paints, coatings, adhesives and industrial cleaning has expanded its application footprint, which in turn reinforces production investment and supplier confidence in capacity growth. Manufacturers prioritize feedstock allocation and process optimization to meet evolving formulation requirements, while end users seek solvents that balance performance and regulatory compliance. This sustained adoption encourages broader upstream and downstream integration, promoting market expansion through improved availability and closer alignment between production planning and application driven consumption patterns.
Sustainable Value Chain Integration: Industry participants are increasingly aligning production processes, procurement strategies, and distribution networks to emphasize lower environmental impact and circularity across the n-butanol lifecycle. Collaboration among chemical producers, end users, and logistics partners is fostering traceability, reuse of byproducts, and integration of renewable inputs where feasible. This strategic shift enhances brand positioning, secures customer relationships, and supports market differentiation based on sustainability credentials rather than competing solely on price, promoting resilient supply chains and demand stability overall.
Why does Asia Pacific Dominate the Global n-Butanol Market? |@12


Want to customize this report? This report can be personalized according to your needs. Our analysts and industry experts will work directly with you to understand your requirements and provide you with customized data in a short amount of time. We offer $1000 worth of FREE customization at the time of purchase.
Feedback From Our Clients


 USA (+1) 351-333-4748

