Mobility as a Service Market Size, Share, and Growth Analysis

Mobility as a Service Market By Transportation Type (Private, Public), By Payment Type (On-Demand, Subscription-Based), By Propulsion Type (Electric Vehicle, Internal Combustion Engine), By Region -Industry Forecast 2025-2032


Report ID: SQMIG20X2008 | Region: Global | Published Date: January, 2025
Pages: 178 |Tables: 171 |Figures: 71

Format - word format excel data power point presentation

Mobility as a Service Market Insights

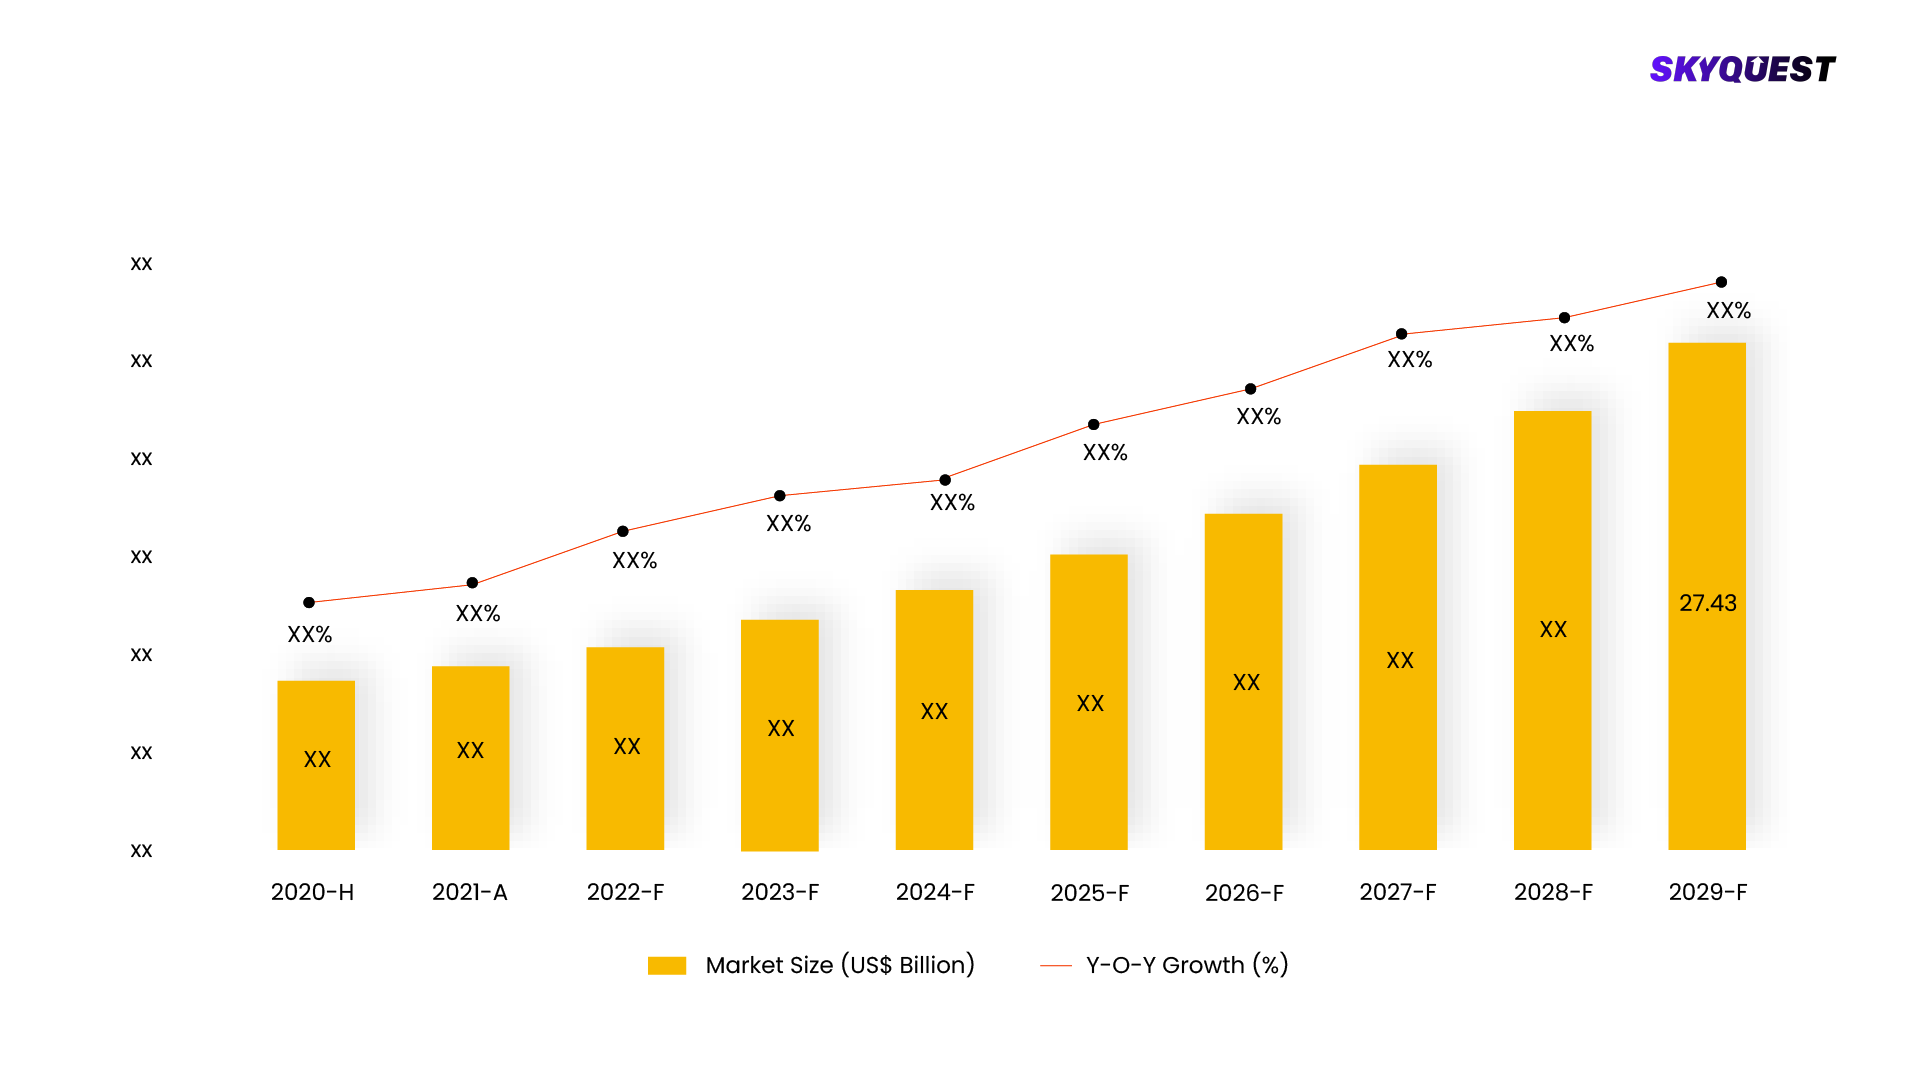
Global Mobility as a Service Market size was valued at USD 220.37 Billion in 2023 and is poised to grow from USD 258.05 Billion in 2024 to USD 912.34 Billion by 2032, growing at a CAGR of 17.10% in the forecast period (2025-2032).

The popularity of mobility as a service is increasing due to the growing usage of subscription vehicle services. These models are creating an adaptive and effective mode of transport and therefore expanding the market of mobility as a service. In addition, users are able to rent personal transport like cars or motorcycles and also use public transport such as buses or trains. Moreover, a cost-efficient and convenient transit approach encourages users to embrace mobility as a service platform for transportation services. With the help of subscription services, mobility as a service platform is streamlining vehicle access, thus driving the transition to more integrated and eco-friendly urban mobility solutions.

The growing prevalence of migration to metropolitan areas has resulted in increasing the need for improved transportation facilities, which is increasing the utilization of mobility as a service. Mobility as a service is enabled with the help of digital applications offering trip planning, booking, and payment options. Moreover, the possibilities of mobility as a service platform to provide information such as route options, schedules, delays, and the status of available means of transport are extremely helpful to the users. Furthermore, mobility as a service allows us to use enhanced payment and ticketing systems where customers can make different types of transport payments on one platform. The upgraded infrastructure enables the use of different payment methods, QR codes, and digital tickets making it easy for users to pay for services. Technological changes are critical in shifting the use of mobility as a service for travel agencies and local authorities as they can incorporate mobility as a service into their services. This will improve the efficiency of the operations and offer additional value-added features in the form of multimodal services which increases customer satisfaction and loyalty in the agency.

Market snapshot - (2025-2032)

Global Market Size

USD 220.37 Billion

Largest Segment

On-Demand

Fastest Growth

Subscription-Based

Growth Rate

17.10% CAGR

Global 3D IC Market ($ Bn)
Country Share for Europe Region (%)

To get more reports on the above market click here to Buy The Report

Mobility as a Service Market Segments Analysis

Global mobility as a service market is segmented into service type, transportation type, application platform, propulsion type, payment type, and region. Based on service type, the market is segmented into ride-hailing, ridesharing, car-sharing, bus/shuttle service, and others. Based on the application platform, the market is segmented into public and private. Based on propulsion type, the market is segmented into electric vehicles, internal combustion engines, and others. Based on payment type, the market is segmented into on-demand and subscription-based. Based on region, the market is segmented into North America, Europe, Asia-Pacific, Latin America, and the Middle East & Africa.

Analysis by Payment Type

Based on payment type, the on-demand segment is dominating the market with the largest mobility as a service market share.  The growing popularity of the on-demand mobility service can be credited with the fact that it helps the city residents get a convenient, flexible and instant means for travelling. Furthermore, on-demand mobility as a service easily integrates riding hailing, sharing bikes, and scooters among other services, providing users alternative transportation services just with the touch of their fingertip. Moreover, the growing popularity of smartphone applications is also contributing to the increasing requirement for on-demand mobility as a service thus changing the way cities are navigated or the transport system.

The subscription-based segment is expected to grow at a significant CAGR during the forecast period. Mobility as a service based on a subscription model allows users to combine together various forms of transport like public transport, ride-hailing and car hire and pay for them on a monthly basis. The subscription-based approach is beneficial for business travelers since it enables them to have a fixed cost, reduces the number of transactions to be made and allows them to use services seamlessly. With the help of subscription-based mobility as a service, users will get the benefit of integrated travel journey, the capability to access various modes at a predetermined rate, and the opportunity for cost-effective travel compared to individualized payments.

Analysis by Transportation Type

Based on public transport, the mobility as a service segment is dominating the mobility as a service market. Mobility as a service has a lot of benefits for public transport, which is increasing its demand in the sector. Mobility as a service offering enhances operational efficiency by providing data on user preferences, travel patterns, and demand that is useful in resource allocation and routing techniques. Mobility as a service can also increase ridership through lowering the complexities of public transport usage, providing integrated multi-modal transportation, and enhancing the attractiveness of public transport.

As per mobility as service market analysis, the private segment is experiencing tremendous growth in recent years.  Booking a private automobile through mobility as a service enables the users to have the freedom of getting transportation on demand with the comfort and ownership of the vehicles. Moreover, mobility as a service can also make private vehicle bookings available to fit specific journeys such as reaching places that do not have proper public transport. Furthermore, the young population are more inclined towards the use of private vehicles, thus boosting the growth of this segment.

To get detailed analysis on other segments, Request For Free Sample Report

Mobility as a Service Market Regional Insights

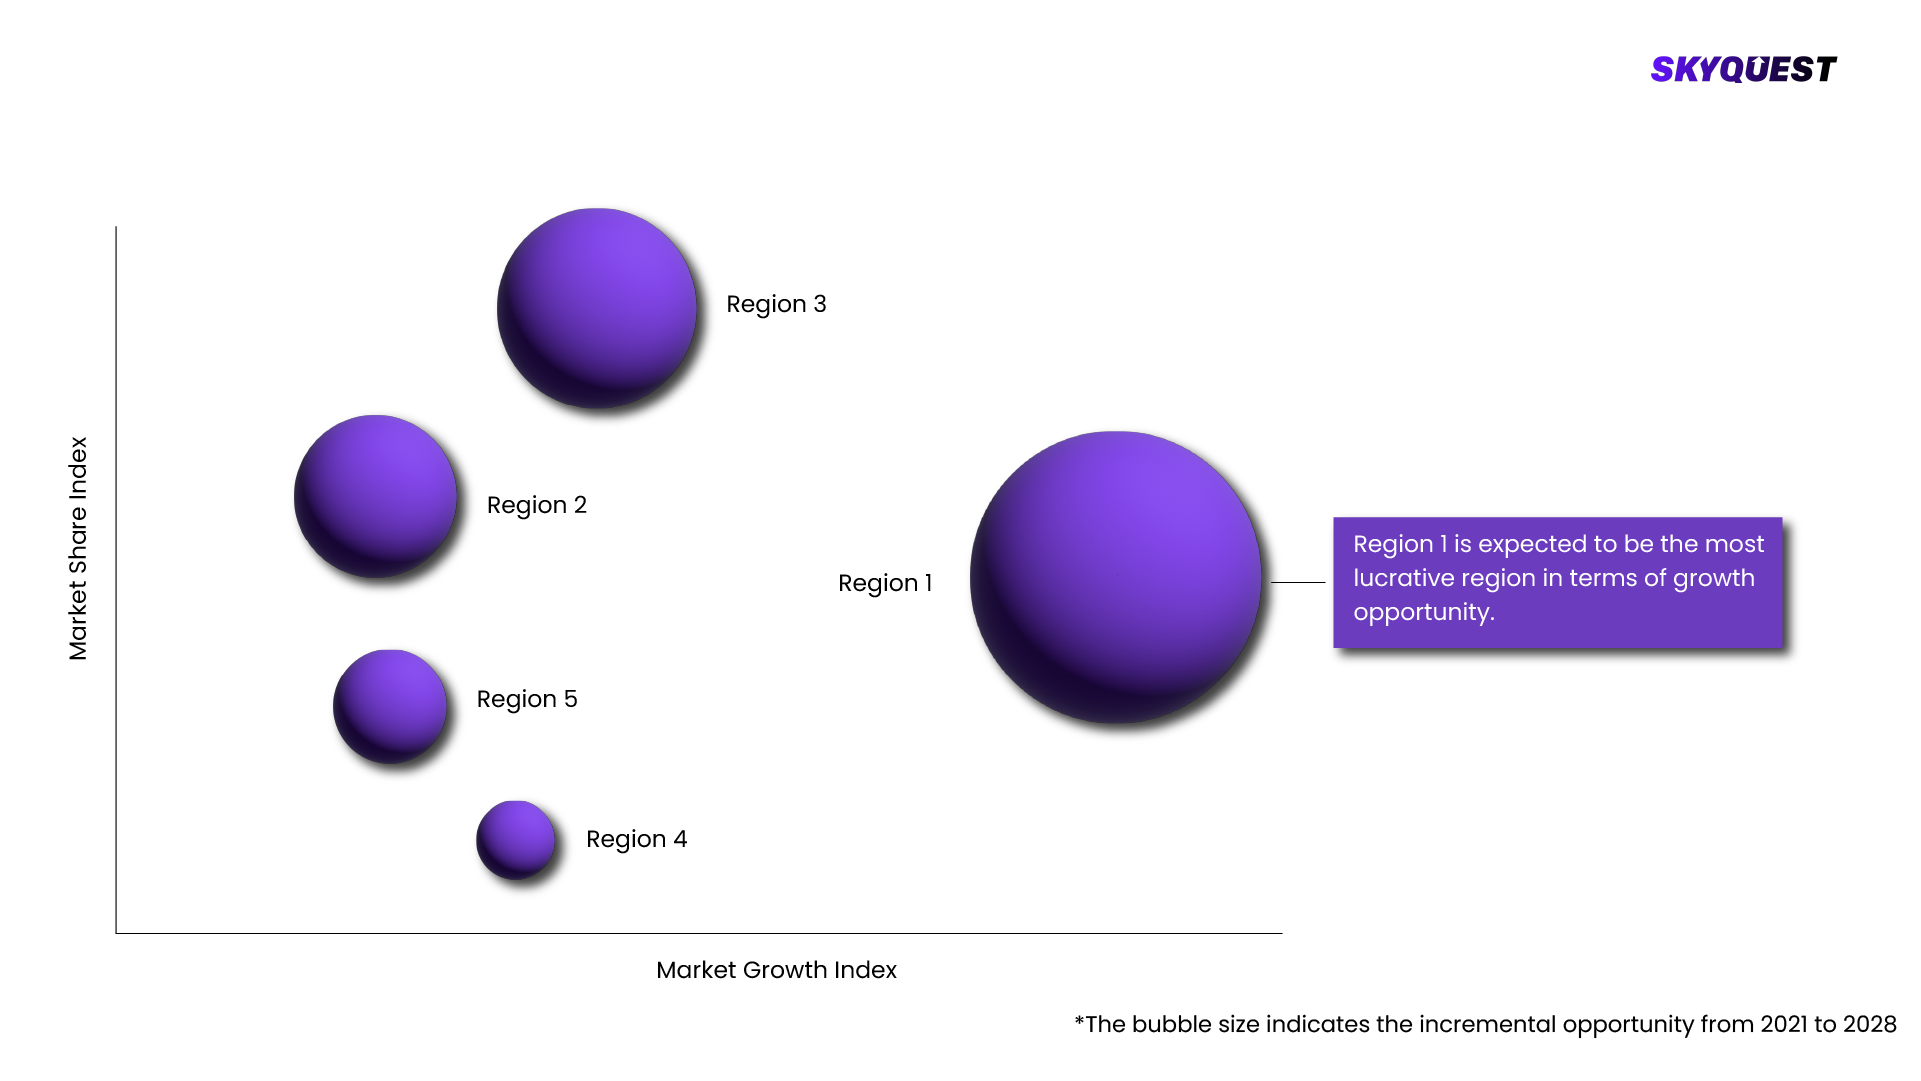
Europe is dominating with the largest mobility as a service market share.  The growth of Europe is significantly influenced by its growing focus on sustainability. The addition of electric vehicles, a bike-sharing program, and public transport into a mobility as a service approach fits perfectly into the commitment aimed at lowering emissions and enhancing transport systems.  Furthermore, the legal and regulatory environment is stable and conducive to new technologies developing. The laws provide a regulatory framework for ensuring open access to data, competition, and the connectivity of public transport which enhances the growth of the mobile as a service market in Europe.

Over the course of the projected period, it is anticipated that the mobility as a service market in Asia Pacific would expand with the highest growth rate. The Asia Pacific region is home to many young consumers who are highly tech-savvy and are quick to accept new technology solutions. Countries in the Asia Pacific region such as China and India have already adopted successfully shared mobility services such as ride-hailing and bike sharing. This mobility as a service market trend is further evolving transportation by combining such services into a single transport service ecosystem. The need for efficient means of transportation is increasing due to growing population in the cities. Moreover, the mobility as a service platform can incorporate different types of transport which can help people in smoothly navigating highly populated areas.

Global Mobility as a Service Market By Geography
  • Largest
  • Fastest

To know more about the market opportunities by region and country, click here to
Buy The Complete Report

Mobility as a Service Market Dynamics

Drivers

Growing Focus on and Digital Payment

  • The increasing emphasis on digitalization and introduction of digital payment systems has become one of the significant factors for the growth of global mobility as a service market. With the growing penetration of technology into various industries and services, clients are eager to utilize digital platforms for everything, including their way of travelling. This is changing the mobility environment and boosting the use of MaaS solutions around the globe. The ease and speed that these digital platforms provide in the planning, booking and payment processes of transport services is increasing its popularity among customers.

Rapid Shift towards Micro-Mobility

  • It is anticipated that micro-mobility in some developing regions emerges as an improvement in future transportation systems. Micro-mobility involves the use of light vehicles such as bicycles and scooters over short distances. For example, in the United States, motorcycles and bicycles comprise considerable portion of short distance transport (less than 5 miles). Micro-mobility is gaining attention among consumers that have prompted crucial manufacturers like Daimler and BMW to engage in micro-mobility. With the help of MaaS, six cities in Europe are now offering scooters as rentals.

Restraints

Increasing Difficulties with Current Regulatory Policies

  • The environment in which transportation services operate varies much from one country or region to another and compromises the integration of different transport modes onto MaaS platforms. Licensing, registration of vehicles or data protection regulations for instance, impose challenges to the development and scaling up of MaaS solutions. Other stakeholders such as taxi operators and public transport agencies can be reluctant in adopting MaaS initiatives. These players may view the Maas as a disruptive technology for their traditional business practices and oppose attempts to incorporate MaaS.

Lack of Knowledge

  • Lack of awareness among the people in the underdeveloped regions about the availability of mobility as a service management is hindering the growth of the market. Furthermore, the people of these regions also lack knowledge about the various travelling applications and benefits provided by smart phones, which is negatively impacting the market due to reduced demand of mobility as a service, hampering growth.

Request Free Customization of this report to help us to meet your business objectives.

Mobility as a Service Market Competitive Landscape

The mobility as a service industry is characterized by high growth potential and profitable opportunities. There is stiff market competition, as both established companies and start-ups are actively pursuing strategic moves to capture a variety of market segments. Some of the most widespread strategic initiatives employed by market players are partnerships, collaboration, mergers and acquisitions. In addition, the companies also seek to differentiate their products by introducing new offerings and capabilities to attract more customers. Major companies which are trying to change the landscape of transport systems focus on technologies, transport and digital platforms to develop integrated MaaS services for users with personalized mobility needs.

Top Players in Mobility as a Service Market

  • Citymapper
  • Communauto Inc.
  • DiDi Chuxing Technology Co.
  • Europcar Mobility Group
  • Gett Inc.
  • Lyft Inc.
  • Moovit Inc. (Mobileye Global Inc.)
  • Ola Cabs (ANI Technologies Private Limited)
  • Shuttl (Super Highway Labs Pvt. Ltd.)
  • SkedGo Pty Ltd
  • Splyt Technologies Ltd.
  • Uber Technologies Inc.

Recent Developments

  • In March 2024, Asia Mobility Technologies expanded the offerings of Trek app into multimodal journey planning and ticketing as part of MaaS. It is also the first mobile application that integrates transport systems in Greater Kuala Lumpur including the currently available Trek Rides with public transport, DRT, and active transport which is available for use in that region.
  • In February 2024, the smart mobility business ACO Tech has entered into a Memorandum of Collaboration with Geno and MARii towards exploring the application of blockchain technology as a solution for Malaysia's electric vehicle architecture. It will employ smart contracts, supply chain traceability management, tokenization and privacy protecting technologies as add-ons to ACOs tech solutions for the E-Mobility Service Platform (EMSP) for establishing a national EV-approved framework via mobility as a service (MaaS) and blockchain as a service (BaaS).
  • In January 2024, Bounce Infinity, an electric scooter manufacturing company, joined forces with energy infrastructure provider SUN Mobility for launching more than 30 thousand Bounce Infinity Scooters in selected markets across the nation. They began with Bangalore and Hyderabad and in phases proceeded to Mumbai, Pune, and Delhi NCR starting from February.

Mobility as a Service Key Market Trends

Mobility as a Service Market SkyQuest Analysis

SkyQuest's ABIRAW (Advanced Business Intelligence, Research & Analysis Wing) is our Business Information Services team that Collects, Collates, Correlates, and Analyses the Data collected by means of Primary Exploratory Research backed by robust Secondary Desk research.

As per SkyQuest analysis, the key players in the mobility as a service industry are constantly seeking various strategies to increase their presence in this immensely competitive and evolving market. Leading companies are prioritizing expanding their service offerings from only ide-hailing services. They are investing in electric and autonomous vehicles to reduce emissions and increase safety. In addition, collaboration is becoming a trend since MaaS providers are entering into agreements with public transport agencies to combine their services to allow for easier and faster user access to multi transport systems through one platform. Top companies are also looking into e-scooters and e-bikes as part of their plans to enhance short distance travel for their users. They also aim at adopting big data systems and AI to help them in improving route planning, pricing, and enhance user experience while maintaining regulatory and legal requirements.

Report Metric Details
Market size value in 2023 USD 220.37 Billion
Market size value in 2032 USD 912.34 Billion
Growth Rate 17.10%
Base year 2024
Forecast period (2025-2032)
Forecast Unit (Value) USD Billion
Segments covered
  • Service Type
    • Ride-Hailing, Ridesharing, Car-Sharing, Bus/Shuttle Service, and Others
  • Service Type
    • Ride-Hailing, Ride-Sharing, Car-Sharing, Bus/Shuttle Service, and Others
  • Transportation Type
    • Private and Public
  • Application Platform
    • Android, iOS, and Others
  • Propulsion Type
    • Electric Vehicle, Internal Combustion Engine, and Others
  • Payment Method
    • On-Demand and Subscription-Based
Regions covered North America (US, Canada), Europe (Germany, France, United Kingdom, Italy, Spain, Rest of Europe), Asia Pacific (China, India, Japan, Rest of Asia-Pacific), Latin America (Brazil, Rest of Latin America), Middle East & Africa (South Africa, GCC Countries, Rest of MEA)
Companies covered
  • Citymapper
  • Communauto Inc.
  • DiDi Chuxing Technology Co.
  • Europcar Mobility Group
  • Gett Inc.
  • Lyft Inc.
  • Moovit Inc. (Mobileye Global Inc.)
  • Ola Cabs (ANI Technologies Private Limited)
  • Shuttl (Super Highway Labs Pvt. Ltd.)
  • SkedGo Pty Ltd
  • Splyt Technologies Ltd.
  • Uber Technologies Inc.
Customization scope

Free report customization with purchase. Customization includes:-

  • Segments by type, application, etc
  • Company profile
  • Market dynamics & outlook
  • Region

To get a free trial access to our platform which is a one stop solution for all your data requirements for quicker decision making. This platform allows you to compare markets, competitors who are prominent in the market, and mega trends that are influencing the dynamics in the market. Also, get access to detailed SkyQuest exclusive matrix.

Buy The Complete Report to read the analyzed strategies adopted by the top vendors either to retain or gain market share

Table Of Content

Executive Summary

Market overview

  • Exhibit: Executive Summary – Chart on Market Overview
  • Exhibit: Executive Summary – Data Table on Market Overview
  • Exhibit: Executive Summary – Chart on Mobility as a Service Market Characteristics
  • Exhibit: Executive Summary – Chart on Market by Geography
  • Exhibit: Executive Summary – Chart on Market Segmentation
  • Exhibit: Executive Summary – Chart on Incremental Growth
  • Exhibit: Executive Summary – Data Table on Incremental Growth
  • Exhibit: Executive Summary – Chart on Vendor Market Positioning

Parent Market Analysis

Market overview

Market size

  • Market Dynamics
    • Exhibit: Impact analysis of DROC, 2021
      • Drivers
      • Opportunities
      • Restraints
      • Challenges
  • SWOT Analysis

KEY MARKET INSIGHTS

  • Technology Analysis
    • (Exhibit: Data Table: Name of technology and details)
  • Pricing Analysis
    • (Exhibit: Data Table: Name of technology and pricing details)
  • Supply Chain Analysis
    • (Exhibit: Detailed Supply Chain Presentation)
  • Value Chain Analysis
    • (Exhibit: Detailed Value Chain Presentation)
  • Ecosystem Of the Market
    • Exhibit: Parent Market Ecosystem Market Analysis
    • Exhibit: Market Characteristics of Parent Market
  • IP Analysis
    • (Exhibit: Data Table: Name of product/technology, patents filed, inventor/company name, acquiring firm)
  • Trade Analysis
    • (Exhibit: Data Table: Import and Export data details)
  • Startup Analysis
    • (Exhibit: Data Table: Emerging startups details)
  • Raw Material Analysis
    • (Exhibit: Data Table: Mapping of key raw materials)
  • Innovation Matrix
    • (Exhibit: Positioning Matrix: Mapping of new and existing technologies)
  • Pipeline product Analysis
    • (Exhibit: Data Table: Name of companies and pipeline products, regional mapping)
  • Macroeconomic Indicators

COVID IMPACT

  • Introduction
  • Impact On Economy—scenario Assessment
    • Exhibit: Data on GDP - Year-over-year growth 2016-2022 (%)
  • Revised Market Size
    • Exhibit: Data Table on Mobility as a Service Market size and forecast 2021-2027 ($ million)
  • Impact Of COVID On Key Segments
    • Exhibit: Data Table on Segment Market size and forecast 2021-2027 ($ million)
  • COVID Strategies By Company
    • Exhibit: Analysis on key strategies adopted by companies

MARKET DYNAMICS & OUTLOOK

  • Market Dynamics
    • Exhibit: Impact analysis of DROC, 2021
      • Drivers
      • Opportunities
      • Restraints
      • Challenges
  • Regulatory Landscape
    • Exhibit: Data Table on regulation from different region
  • SWOT Analysis
  • Porters Analysis
    • Competitive rivalry
      • Exhibit: Competitive rivalry Impact of key factors, 2021
    • Threat of substitute products
      • Exhibit: Threat of Substitute Products Impact of key factors, 2021
    • Bargaining power of buyers
      • Exhibit: buyers bargaining power Impact of key factors, 2021
    • Threat of new entrants
      • Exhibit: Threat of new entrants Impact of key factors, 2021
    • Bargaining power of suppliers
      • Exhibit: Threat of suppliers bargaining power Impact of key factors, 2021
  • Skyquest special insights on future disruptions
    • Political Impact
    • Economic impact
    • Social Impact
    • Technical Impact
    • Environmental Impact
    • Legal Impact

Market Size by Region

  • Chart on Market share by geography 2021-2027 (%)
  • Data Table on Market share by geography 2021-2027(%)
  • North America
    • Chart on Market share by country 2021-2027 (%)
    • Data Table on Market share by country 2021-2027(%)
    • USA
      • Exhibit: Chart on Market share 2021-2027 (%)
      • Exhibit: Market size and forecast 2021-2027 ($ million)
    • Canada
      • Exhibit: Chart on Market share 2021-2027 (%)
      • Exhibit: Market size and forecast 2021-2027 ($ million)
  • Europe
    • Chart on Market share by country 2021-2027 (%)
    • Data Table on Market share by country 2021-2027(%)
    • Germany
      • Exhibit: Chart on Market share 2021-2027 (%)
      • Exhibit: Market size and forecast 2021-2027 ($ million)
    • Spain
      • Exhibit: Chart on Market share 2021-2027 (%)
      • Exhibit: Market size and forecast 2021-2027 ($ million)
    • France
      • Exhibit: Chart on Market share 2021-2027 (%)
      • Exhibit: Market size and forecast 2021-2027 ($ million)
    • UK
      • Exhibit: Chart on Market share 2021-2027 (%)
      • Exhibit: Market size and forecast 2021-2027 ($ million)
    • Rest of Europe
      • Exhibit: Chart on Market share 2021-2027 (%)
      • Exhibit: Market size and forecast 2021-2027 ($ million)
  • Asia Pacific
    • Chart on Market share by country 2021-2027 (%)
    • Data Table on Market share by country 2021-2027(%)
    • China
      • Exhibit: Chart on Market share 2021-2027 (%)
      • Exhibit: Market size and forecast 2021-2027 ($ million)
    • India
      • Exhibit: Chart on Market share 2021-2027 (%)
      • Exhibit: Market size and forecast 2021-2027 ($ million)
    • Japan
      • Exhibit: Chart on Market share 2021-2027 (%)
      • Exhibit: Market size and forecast 2021-2027 ($ million)
    • South Korea
      • Exhibit: Chart on Market share 2021-2027 (%)
      • Exhibit: Market size and forecast 2021-2027 ($ million)
    • Rest of Asia Pacific
      • Exhibit: Chart on Market share 2021-2027 (%)
      • Exhibit: Market size and forecast 2021-2027 ($ million)
  • Latin America
    • Chart on Market share by country 2021-2027 (%)
    • Data Table on Market share by country 2021-2027(%)
    • Brazil
      • Exhibit: Chart on Market share 2021-2027 (%)
      • Exhibit: Market size and forecast 2021-2027 ($ million)
    • Rest of South America
      • Exhibit: Chart on Market share 2021-2027 (%)
      • Exhibit: Market size and forecast 2021-2027 ($ million)
  • Middle East & Africa (MEA)
    • Chart on Market share by country 2021-2027 (%)
    • Data Table on Market share by country 2021-2027(%)
    • GCC Countries
      • Exhibit: Chart on Market share 2021-2027 (%)
      • Exhibit: Market size and forecast 2021-2027 ($ million)
    • South Africa
      • Exhibit: Chart on Market share 2021-2027 (%)
      • Exhibit: Market size and forecast 2021-2027 ($ million)
    • Rest of MEA
      • Exhibit: Chart on Market share 2021-2027 (%)
      • Exhibit: Market size and forecast 2021-2027 ($ million)

KEY COMPANY PROFILES

  • Competitive Landscape
    • Total number of companies covered
      • Exhibit: companies covered in the report, 2021
    • Top companies market positioning
      • Exhibit: company positioning matrix, 2021
    • Top companies market Share
      • Exhibit: Pie chart analysis on company market share, 2021(%)

Methodology

For the Mobility as a Service Market, our research methodology involved a mixture of primary and secondary data sources. Key steps involved in the research process are listed below:

1. Information Procurement: This stage involved the procurement of Market data or related information via primary and secondary sources. The various secondary sources used included various company websites, annual reports, trade databases, and paid databases such as Hoover's, Bloomberg Business, Factiva, and Avention. Our team did 45 primary interactions Globally which included several stakeholders such as manufacturers, customers, key opinion leaders, etc. Overall, information procurement was one of the most extensive stages in our research process.

2. Information Analysis: This step involved triangulation of data through bottom-up and top-down approaches to estimate and validate the total size and future estimate of the Mobility as a Service Market.

3. Report Formulation: The final step entailed the placement of data points in appropriate Market spaces in an attempt to deduce viable conclusions.

4. Validation & Publishing: Validation is the most important step in the process. Validation & re-validation via an intricately designed process helped us finalize data points to be used for final calculations. The final Market estimates and forecasts were then aligned and sent to our panel of industry experts for validation of data. Once the validation was done the report was sent to our Quality Assurance team to ensure adherence to style guides, consistency & design.

Analyst Support

Customization Options

With the given market data, our dedicated team of analysts can offer you the following customization options are available for the Mobility as a Service Market:

Product Analysis: Product matrix, which offers a detailed comparison of the product portfolio of companies.

Regional Analysis: Further analysis of the Mobility as a Service Market for additional countries.

Competitive Analysis: Detailed analysis and profiling of additional Market players & comparative analysis of competitive products.

Go to Market Strategy: Find the high-growth channels to invest your marketing efforts and increase your customer base.

Innovation Mapping: Identify racial solutions and innovation, connected to deep ecosystems of innovators, start-ups, academics, and strategic partners.

Category Intelligence: Customized intelligence that is relevant to their supply Markets will enable them to make smarter sourcing decisions and improve their category management.

Public Company Transcript Analysis: To improve the investment performance by generating new alpha and making better-informed decisions.

Social Media Listening: To analyze the conversations and trends happening not just around your brand, but around your industry as a whole, and use those insights to make better Marketing decisions.

$5,300
BUY NOW

REQUEST FOR SAMPLE

Want to customize this report? REQUEST FREE CUSTOMIZATION

FAQs

Global Mobility as a Service Market size was valued at USD 220.37 Billion in 2023 and is poised to grow from USD 258.05 Billion in 2024 to USD 912.34 Billion by 2032, growing at a CAGR of 17.10% in the forecast period (2025-2032).

The mobility as a service industry is characterized by high growth potential and profitable opportunities. There is stiff market competition, as both established companies and start-ups are actively pursuing strategic moves to capture a variety of market segments. Some of the most widespread strategic initiatives employed by market players are partnerships, collaboration, mergers and acquisitions. In addition, the companies also seek to differentiate their products by introducing new offerings and capabilities to attract more customers. Major companies which are trying to change the landscape of transport systems focus on technologies, transport and digital platforms to develop integrated MaaS services for users with personalized mobility needs. 'Citymapper', 'Communauto Inc.', 'DiDi Chuxing Technology Co.', 'Europcar Mobility Group', 'Gett Inc.', 'Lyft Inc.', 'Moovit Inc. (Mobileye Global Inc.)', 'Ola Cabs (ANI Technologies Private Limited)', 'Shuttl (Super Highway Labs Pvt. Ltd.)', 'SkedGo Pty Ltd', 'Splyt Technologies Ltd.', 'Uber Technologies Inc.'

The increasing emphasis on digitalization and introduction of digital payment systems has become one of the significant factors for the growth of global mobility as a service market. With the growing penetration of technology into various industries and services, clients are eager to utilize digital platforms for everything, including their way of travelling. This is changing the mobility environment and boosting the use of MaaS solutions around the globe. The ease and speed that these digital platforms provide in the planning, booking and payment processes of transport services is increasing its popularity among customers.

Increasing Usage of Fleet Electrification: The conventional vehicles cause a high amount of carbon emission due to which governments worldwide are imposing stringent emission norms to curb rising pollution. Therefore, to reduce carbon emissions and expand business in economies with stringent emission norms, various leading mobility-as-a-service providers are transforming their fleets to electric to offer clean future mobility solutions for the urban populace.

Europe is dominating with the largest mobility as a service market share.  The growth of Europe is significantly influenced by its growing focus on sustainability. The addition of electric vehicles, a bike-sharing program, and public transport into a mobility as a service approach fits perfectly into the commitment aimed at lowering emissions and enhancing transport systems.  Furthermore, the legal and regulatory environment is stable and conducive to new technologies developing. The laws provide a regulatory framework for ensuring open access to data, competition, and the connectivity of public transport which enhances the growth of the mobile as a service market in Europe.

Want to customize this report? This report can be personalized according to your needs. Our analysts and industry experts will work directly with you to understand your requirements and provide you with customized data in a short amount of time. We offer $1000 worth of FREE customization at the time of purchase.

logo-images

Feedback From Our Clients

Mobility as a Service Market

Report ID: SQMIG20X2008

[email protected]
USA +1 351-333-4748

BUY NOW GET FREE SAMPLE