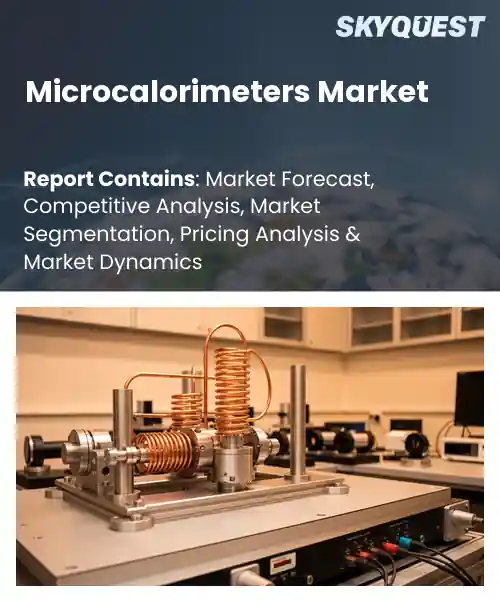
Microcalorimeters Market
Report ID: SQMIG35J2776
Report ID: SQMIG35J2776
[email protected]
USA +1 351-333-4748
Report ID:
SQMIG35J2776 |
Region:
Global |
Published Date: August, 2026
Pages:
157
|Tables:
148
|Figures:
78


Global Microcalorimeters Market size was valued at USD 260.00 Million in 2024 and is poised to grow from USD 282.36 Million in 2025 to USD 546.32 Million by 2033, growing at a CAGR of 8.6% during the forecast period (2026-2033).
Microcalorimeters market trends are thermal detectors that convert absorbed photon energy into temperature changes, forming the core of the microcalorimeters market. The market matters because it enables spectroscopy with resolution beyond conventional semiconductor detectors, essential for astrophysics, materials science, and homeland‑security applications. The primary driver has been demand for X‑ray spectroscopy in telescopes such as NASA’s XRISM and ESA’s Athena, which require detectors that resolve line emissions at a few electron‑volts. Since 2000, cryogenic cooling advances and silicon fabrication have lowered costs, prompting commercial labs to adopt microcalorimeters for elemental analysis and expanding the market beyond niche research globally over the decade.
The next growth catalyst lies in the convergence of microcalorimeters market share technology with quantum‑computing and semiconductor inspection, where resolution directly translates into higher yield and lower defect rates. As chip makers adopt lithography, they need precise elemental mapping; microcalorimeters provide that capability, prompting vendors to embed them in metrology suites, which in turn drives demand for larger detector arrays. Defense agencies also invest in microcalorimeter‑based radiological monitor to detect illicit materials, creating a market for robust units. These uses generate a feedback loop: increased volume lowers per‑unit cost, encouraging adoption in medical imaging for cancer detection, expanding the market, attracting entrants.
How is AI-driven Automation Influencing the Performance and Adoption of Microcalorimeters in Analytical Labs?
AI-driven automation is reshaping microcalorimeters market growth use in analytical labs by linking real‑time data capture with intelligent processing. Machine‑learning models now predict thermal signatures, reduce noise, and streamline method development, allowing scientists to focus on interpretation rather than manual calibration. Integrated robotic sample handlers coordinate with software that adjusts measurement parameters on the fly, shortening analysis cycles and improving reproducibility. Vendors are embedding these capabilities into next‑generation instruments, positioning microcalorimetry as a more accessible tool for high‑throughput screening, formulation testing, and kinetic studies. The market is responding with increased demand from pharmaceutical, material science, and energy sectors that value faster, data‑rich insights.
In June 2024, Malvern Panalytical introduced an AI‑enhanced microcalorimeter platform, demonstrating how automated data analytics accelerate workflow efficiency and drive broader adoption across research laboratories.
Market snapshot - (2026-2033)
Global Market Size
USD 260.0 Million
Largest Segment
Differential Scanning Microcalorimeters
Fastest Growth
Chip-Based Microcalorimeters
Growth Rate
8.6% CAGR
To get more insights on this market click here to Request a Free Sample Report
Global microcalorimeters market is segmented by product type, application, end user, technology, sales channel and region. Based on product type, the market is segmented into Isothermal microcalorimeters, differential scanning microcalorimeters, chip-based microcalorimeters and others. Based on application, the market is segmented into pharmaceutical research, material science, life science research and others. Based on end user, the market is segmented into academic & research institutes, pharmaceutical companies, biotechnology companies and others. Based on technology, the market is segmented into heat conduction, heat compensation, power compensation and others. Based on sales channel, the market is segmented into direct sales, distributors and online. Based on region, the market is segmented into North America, Europe, Asia Pacific, Latin America and Middle East & Africa.
Pharmaceutical research segment dominates because microcalorimetry offers direct insight into binding thermodynamics, stability, and solubility, critical for early stage drug development. The technique’s sensitivity to minute heat changes enables precise characterization of protein ligand interactions, reducing attrition risk. Continuous pressure to shorten development timelines and improve candidate selection intensifies reliance on calorimetric data, prompting widespread adoption across discovery labs. Integration with high throughput screening platforms further cements its central position in the market.
Meanwhile, material science segment emerges as the fastest growing due to expanding use of calorimetry for thermal stability assessment of advanced composites and nanomaterials. Emerging standards for sustainability and performance drive laboratories to adopt microcalorimeters for precise heat flow measurements. This surge opens new application fields and stimulates instrument innovation, broadening market reach.
Isothermal microcalorimeters segment dominates because its ability to measure heat flow at constant temperature provides unparalleled precision for kinetic studies, making it indispensable for low energy reaction monitoring. Researchers value its straightforward calibration, robust thermal stability, and minimal sample preparation, which together reduce experimental uncertainty. Continuous improvements in sensor materials and data analysis algorithms further reinforce its appeal, cementing its leadership in the market across diverse scientific domains globally today.
Meanwhile, differential scanning microcalorimeters segment emerges as the fastest growing due to rising demand for high throughput thermal profiling in drug discovery pipelines. Innovations in miniaturized heating elements and faster data acquisition enable rapid assessment of formulation stability, attracting biotechnology firms. This growth fuels broader market expansion, creating new opportunities for instrument manufacturers to diversify their portfolios.
To get detailed segments analysis, Request a Free Sample Report
North America leads the microcalorimeters market through a convergence of advanced research ecosystems, substantial investment in precision instrumentation, and a robust pipeline of aerospace, semiconductor, and scientific applications. The region benefits from deep collaboration between universities, national laboratories, and industry innovators that accelerate technology maturation. Strong intellectual property frameworks and a culture of early adoption encourage commercial deployment of high‑resolution detectors. Additionally, well‑established supply chains and regulatory environments that support rapid prototyping reinforce the market’s leadership position, enabling North America to set performance benchmarks that shape global demand.
Microcalorimeters market outlook in the United States is propelled by a dense network of federal research agencies and private‑sector innovators that prioritize ultra‑sensitive detection capabilities. Collaborative projects spanning astrophysics, quantum computing, and advanced materials drive continuous refinement of detector designs. A mature venture capital landscape fuels startups that translate laboratory breakthroughs into commercial products, while established manufacturers leverage domestic expertise to scale production for diverse industrial uses.
Microcalorimeters market forecast in Canada thrives on strong governmental support for clean‑energy research and a vibrant community of universities focused on cryogenic technologies. Partnerships between academic labs and niche manufacturers accelerate the development of low‑noise detectors for environmental monitoring and medical imaging. The country’s emphasis on sustainable industrial processes creates demand for precise thermal analysis tools, positioning Canada as a strategic contributor to the broader North American ecosystem.
Europe’s microcalorimeters market expands rapidly due to coordinated research initiatives, substantial public funding for photon‑science projects, and a tradition of precision engineering. Cross‑border collaborations within the European Union foster shared infrastructure and knowledge exchange, accelerating product innovation. The region’s strong emphasis on high‑performance instrumentation for space telescopes, particle physics, and next‑generation semiconductor inspection fuels demand. Moreover, detailed regulatory standards and a focus on sustainable manufacturing reinforce confidence among end users, positioning Europe as a hub of technological excellence and market growth.
Microcalorimeters market regional outlook in Germany is anchored by world‑class research institutes and a dense cluster of engineering firms that specialize in ultra‑high‑resolution sensor fabrication. The country’s reputation for meticulous quality control attracts multinational projects seeking reliable detector solutions for aerospace and fundamental physics research. Close ties between academia and industry accelerate technology transfer, while a robust export orientation extends German expertise to global customers seeking precision instrumentation.
Microcalorimeters market regional forecast in the United Kingdom is experiencing accelerated growth through ambitious national science programs and strategic investments in quantum technologies. Leading universities and government labs drive cutting‑edge research on low‑temperature detector architectures, while a vibrant startup scene translates breakthroughs into commercial offerings. Collaborative frameworks with European partners enhance access to large‑scale facilities, positioning the United Kingdom as a fast‑moving hub for innovative microcalorimeter applications across health, security, and space exploration.
Microcalorimeters market analysis in France is emerging as a focal point for collaborative projects that blend academic excellence with industrial capability. National research agencies support interdisciplinary studies that intersect materials science and cryogenic engineering, fostering novel detector concepts. French manufacturers leverage this expertise to develop specialized solutions for high‑energy physics experiments and advanced spectroscopy, gradually expanding their footprint in the broader European market.
Asia Pacific is strengthening its microcalorimeters position by harnessing rapid advancements in semiconductor manufacturing, growing investment in scientific infrastructure, and a strategic focus on emerging applications such as medical diagnostics and environmental sensing. Governments across the region prioritize high‑technology research parks that bring together universities, research institutes, and private firms, creating ecosystems that accelerate product development. The convergence of cost‑effective production capabilities with rising expertise in low‑temperature physics enables the region to offer competitive, high‑performance detector solutions to both domestic and international markets.
Microcalorimeters market penetration in Japan benefits from a longstanding tradition of precision engineering and a deep pool of expertise in cryogenics and sensor technology. Collaborative networks linking national research laboratories with leading electronics manufacturers drive continuous refinement of detector performance. Government‑backed programs focusing on space exploration and advanced materials analytics create sustained demand for high‑sensitivity instruments, reinforcing Japan’s role as a key contributor to global microcalorimeter innovation.
Microcalorimeters industry in South Korea is propelled by aggressive investment in nanofabrication facilities and a vibrant culture of technology entrepreneurship. Partnerships between top universities and semiconductor conglomerates accelerate the integration of microcalorimeter technologies into cutting‑edge imaging and security systems. National initiatives that emphasize next‑generation scientific instrumentation provide a supportive policy environment, enabling South Korea to rapidly upscale its capabilities and strengthen its presence in the international market.
To know more about the market opportunities by region and country, click here to
Buy The Complete Report
Advanced Detector Sensitivity
Integration With Cryogenic Systems
High Manufacturing Complexity
Limited Standardization Across Applications
Request Free Customization of this report to help us to meet your business objectives.
The global microcalorimeters market is characterized by competition among specialized microcalorimetry providers and diversified thermal-analysis and analytical-instrument manufacturers, with companies differentiating through measurement sensitivity, calorimetric accuracy, automation, sample throughput, temperature and pressure ranges, and application-specific software. TA Instruments, part of Waters Corporation, maintains a strong position through its TAM IV microcalorimetry systems for highly sensitive heat-flow measurements, while Malvern Panalytical competes strongly in life-science applications through its MicroCal PEAQ-ITC and PEAQ-DSC platforms for biomolecular interaction and stability analysis. NETZSCH and Setaram Instrumentation, part of KEP Technologies, emphasize advanced calorimetry and thermal-analysis solutions for materials, chemicals, pharmaceuticals, and process-safety applications. Thermal Hazard Technology (THT) specializes in highly sensitive calorimetry for thermal stability and reaction-safety studies, while Shimadzu, Rigaku, Linseis, and Hitachi High-Tech compete through broader analytical and thermal-analysis portfolios. Competitive differentiation increasingly centers on automated measurements, high-throughput testing, ultra-low heat-flow detection, miniaturization, integrated data analysis, and expanding applications across pharmaceuticals, biotechnology, materials science, energy storage, and scientific research.
Top Player’s Company Profile
Recent Developments in the Microcalorimeters Market
SkyQuest’s ABIRAW (Advanced Business Intelligence, Research & Analysis Wing) is our Business Information Services team that Collects, Collates, Correlates, and Analyses the Data collected by means of Primary Exploratory Research backed by robust Secondary Desk research. As per SkyQuest analysis the global microcalorimeters market is expanding rapidly driven by advanced detector sensitivity that enables ultra‑high resolution measurements across astrophysics, material science and pharmaceutical research. A second catalyst is the seamless integration with cryogenic cooling systems which lowers operating costs and opens new laboratory applications. The market is led by North America where strong research ecosystems and funding accelerate adoption. Isothermal microcalorimeters hold the largest share because of their precision in kinetic studies and ease of use. However high manufacturing complexity limits scale and keeps prices elevated, tempering broader uptake among smaller institutions. Continued investment in scalable fabrication is expected to unlock further growth.
| Report Metric | Details |
|---|---|
| Market size value in 2024 | USD 260.0 Million |
| Market size value in 2033 | USD 546.32 Million |
| Growth Rate | 8.6% |
| Base year | 2024 |
| Forecast period | (2026-2033) |
| Forecast Unit (Value) | USD Million |
| Segments covered |
|
| Regions covered | North America (US, Canada), Europe (Germany, France, United Kingdom, Italy, Spain, Rest of Europe), Asia Pacific (China, India, Japan, Rest of Asia-Pacific), Latin America (Brazil, Rest of Latin America), Middle East & Africa (South Africa, GCC Countries, Rest of MEA) |
| Companies covered |
|
| Customization scope | Free report customization with purchase. Customization includes:-
|
To get a free trial access to our platform which is a one stop solution for all your data requirements for quicker decision making. This platform allows you to compare markets, competitors who are prominent in the market, and mega trends that are influencing the dynamics in the market. Also, get access to detailed SkyQuest exclusive matrix.
Table Of Content
Executive Summary
Market overview
Parent Market Analysis
Market overview
Market size
KEY MARKET INSIGHTS
COVID IMPACT
MARKET DYNAMICS & OUTLOOK
Market Size by Region
KEY COMPANY PROFILES
Methodology
For the Microcalorimeters Market, our research methodology involved a mixture of primary and secondary data sources. Key steps involved in the research process are listed below:
1. Information Procurement: This stage involved the procurement of Market data or related information via primary and secondary sources. The various secondary sources used included various company websites, annual reports, trade databases, and paid databases such as Hoover's, Bloomberg Business, Factiva, and Avention. Our team did 45 primary interactions Globally which included several stakeholders such as manufacturers, customers, key opinion leaders, etc. Overall, information procurement was one of the most extensive stages in our research process.
2. Information Analysis: This step involved triangulation of data through bottom-up and top-down approaches to estimate and validate the total size and future estimate of the Microcalorimeters Market.
3. Report Formulation: The final step entailed the placement of data points in appropriate Market spaces in an attempt to deduce viable conclusions.
4. Validation & Publishing: Validation is the most important step in the process. Validation & re-validation via an intricately designed process helped us finalize data points to be used for final calculations. The final Market estimates and forecasts were then aligned and sent to our panel of industry experts for validation of data. Once the validation was done the report was sent to our Quality Assurance team to ensure adherence to style guides, consistency & design.
Analyst Support
Customization Options
With the given market data, our dedicated team of analysts can offer you the following customization options are available for the Microcalorimeters Market:
Product Analysis: Product matrix, which offers a detailed comparison of the product portfolio of companies.
Regional Analysis: Further analysis of the Microcalorimeters Market for additional countries.
Competitive Analysis: Detailed analysis and profiling of additional Market players & comparative analysis of competitive products.
Go to Market Strategy: Find the high-growth channels to invest your marketing efforts and increase your customer base.
Innovation Mapping: Identify racial solutions and innovation, connected to deep ecosystems of innovators, start-ups, academics, and strategic partners.
Category Intelligence: Customized intelligence that is relevant to their supply Markets will enable them to make smarter sourcing decisions and improve their category management.
Public Company Transcript Analysis: To improve the investment performance by generating new alpha and making better-informed decisions.
Social Media Listening: To analyze the conversations and trends happening not just around your brand, but around your industry as a whole, and use those insights to make better Marketing decisions.
REQUEST FOR SAMPLE
 REQUEST FREE CUSTOMIZATION
Global Microcalorimeters Market size was valued at USD 260.0 Million in 2024 and is poised to grow from USD 282.36 Million in 2025 to USD 546.32 Million by 2033, growing at a CAGR of 8.6% during the forecast period (2026-2033).
Competitive dynamics in the global microcalorimeters market are shaped by aggressive M&A, strategic partnerships, and rapid technology upgrades. Oxford Instruments expanded its portfolio through the 2023 acquisition of XGLab’s cryogenic detector line, while Thermo Fisher Scientific entered a joint development agreement with NIST to integrate transition‑edge sensor technology, and Bruker launched an AI‑enhanced microcalorimeter platform to improve data throughput. 'Malvern Panalytical Ltd.', 'TA Instruments', 'Waters Corporation', 'NETZSCH-Gerätebau GmbH', 'Setaram Instrumentation', 'MicroCal LLC', 'Linseis Messgeräte GmbH', 'Mettler-Toledo International Inc.', 'Hitachi High-Tech Corporation', 'Shimadzu Corporation', 'Thermo Fisher Scientific Inc.', 'Calmetrix Inc.', 'CSC Scientific Company, Inc.', 'TAM IV (TA Instruments)', 'Xylem Analytics', 'Kep Technologies', 'Fremont Micro Devices', 'KSV NIMA', 'Rigaku Corporation', 'Parr Instrument Company'
The enhanced sensitivity of modern microcalorimeters enables detection of minute energy variations, which expands their applicability across scientific fields such as astrophysics, material analysis, and medical diagnostics. By capturing subtle thermal signals, researchers can achieve higher resolution measurements, facilitating discovery of new phenomena and improving product development cycles. This capability drives demand for more sophisticated instruments, encouraging manufacturers to invest in research and production, thereby accelerating market growth and fostering collaborations between academia and industry that further stimulate innovation and adoption.
Quantum Sensor Integration Surge: The adoption of quantum‑enhanced sensor technologies is reshaping microcalorimeter design, enabling unprecedented energy resolution and detection thresholds. Manufacturers are partnering with research institutions to embed superconducting qubits and low‑noise amplifiers, creating devices that capture minute thermal events previously undetectable. This convergence is fostering new applications in astrophysics, materials science, and security screening, while driving demand for specialized fabrication capabilities. Companies that invest early in quantum‑compatible platforms are positioned to capture premium market share as industries seek next‑generation analytical performance today.
Why does North America Dominate the Global Microcalorimeters Market? |@12


Want to customize this report? This report can be personalized according to your needs. Our analysts and industry experts will work directly with you to understand your requirements and provide you with customized data in a short amount of time. We offer $1000 worth of FREE customization at the time of purchase.
Feedback From Our Clients


 USA (+1) 351-333-4748

