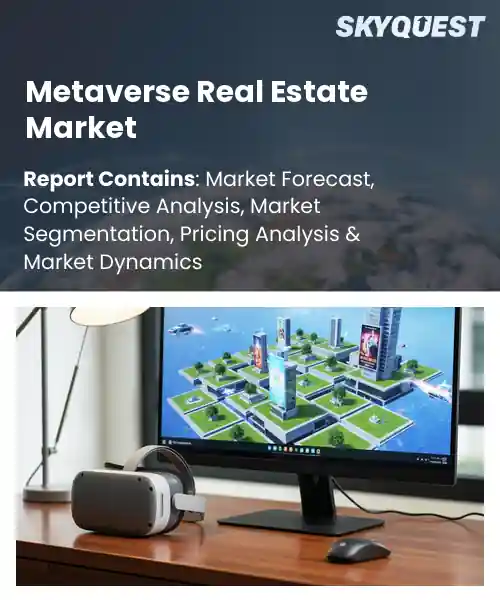
Metaverse Real Estate Market
Report ID: SQMIG60I2005
Report ID: SQMIG60I2005
[email protected]
USA +1 351-333-4748
Report ID:
SQMIG60I2005 |
Region:
Global |
Published Date: June, 2026
Pages:
157
|Tables:
116
|Figures:
77


Global Metaverse Real Estate Market size was valued at USD 1.62 Billion in 2024 and is poised to grow from USD 2.14 Billion in 2025 to USD 19.98 Billion by 2033, growing at a CAGR of 32.2% during the forecast period (2026-2033).
The metaverse real estate market growth is a digital version of real estate: property in the real world is comparable to purchasing, selling and developing land in a digital world through platforms like Decentraland, The Sandbox, and Horizon Worlds. The convergence of block-chain-based ownership with immersive social experiences is the primary driver of the metaverse's real-estate market, which enables interactions among users to create value within the physical space. In 2020, early adopters purchased parcels of land at fractions of a cent. Since major brands (e.g., Nike, Gucci) have opened stores within the metaverse, demand for digital land has increased dramatically, and prices have correspondingly increased. This further illustrates the change in how investors have begun to see the metaverse as long-term asset as a result of moving from opportunistic trading (or speculation) to presence in the market.
In addition to ownership, the primary component that continues to drive growth in the global metaverse real estate market trends has been the integration of commerce and entertainment, which creates revenue that increases the value of properties. Companies who include experiential marketing (e.g., a concert by Live Nation in The Sandbox, a virtual showroom by Hyundai) generate traffic to their properties. This will ultimately result in property owners investing in developing infrastructure and securing premium locations. This cycle of cause and effect drives investment in the metaverse; each successful event enhances confidence in the digital marketplace and subsequently stimulates interest in user data from ad-tech firms and financial institutions. Therefore, the opportunity to invest has evolved from land speculation to long-term leases, and sponsorships of events.
How is Blockchain Reshaping Ownership Verification and Transaction Security in the Metaverse Real Estate Market?
The blockchain provides a tamper-free ledger to keep track of all properties in a digital space as different tokens. This builds unbroken ownership chains that can be easily traced and audited; therefore, there is no need for physical deeds or any type of middleman. Transactions made through smart contracts allow for automatic pay-outs once the transaction appears on the blockchain. This means the blockchain allows each token to be associated with one single unique point of land in the digital world and therefore will allow the buyer to prove they own land without having to depend on an operator of the platform. As a result, people doing business in the metaverse will see all activity as being more open and will therefore be less likely to be defrauded and be more likely to trust that the technology itself will facilitate their ability to do business; thus, more people will find it beneficial to do business in metaverse real estate market share.
In January 2022, Republic Realm completed a purchase of property in the metaverse through an acquisition that was made possible by the blockchain. This acquisition showed the ability to use blockchain as a means of verifying ownership and conducting transactions on the blockchain will help build investor confidence in the metaverse as a place to invest and grow. Republic Realms acquisition further demonstrates the fast transaction speed on a blockchain and the ability to trace an assets history of ownership will help to provide investors with confidence and promote continued investment and development of virtual neighborhoods.
Market snapshot - (2026-2033)
Global Market Size
USD 1.62 Billion
Largest Segment
Virtual Land Parcels
Fastest Growth
Virtual Buildings
Growth Rate
32.2% CAGR
To get more insights on this market click here to Request a Free Sample Report
Global metaverse real estate market is segmented by asset type category, platform architecture framework, end use application role, platform component layer and region. Based on asset type category, the market is segmented into virtual land parcels, virtual buildings and virtual spaces. Based on platform architecture framework, the market is segmented into decentralized blockchain platforms and centralized corporate ecosystems. Based on end use application role, the market is segmented into commercial ventures, residential real estate, gaming platforms and entertainment event venues. Based on platform component layer, the market is segmented into infrastructure hardware and development software suites. Based on region, the market is segmented into North America, Europe, Asia Pacific, Latin America and Middle East & Africa.
The virtual land parcels segment, as the foundation of all other forms of digital property, is driving the growth of the overall metaverse real estate market forecast by providing creators with a limited supply and tradable canvas upon which to create. Moreover, the ownership rights of these virtual land parcels can be enforced via timestamped, immutable blockchain technology, making them attractive to long-term investors looking for capital appreciation and to developers looking to create immersive virtual experiences (VR). The core utility provided by the Virtual Land Parcels segment provides a stable foundation for the long-term health of the Metaverse Real Estate market, and creates the environment necessary for currently existing diverse virtual economies to work together to create collaborative ecosystems.
At the same time, the virtual buildings segment is the fastest-growing segment of the metaverse real estate market outlook. As the creators continue to monetize their 3D experiences through retail, entertainment, and social hubs, they also benefit from a large variety of innovative design tools and modular building processes, lowering the barriers to entry for new structures to be constructed and as such, driving the overall volume of constructed structures, attracting brand ambassadors, and providing gathering places for the various communities, accelerating the depth of the overall virtual real estate market and increasing the various sources of revenue.
Decentralized blockchain platforms have digital scarcity and transparent provenance directly built into virtual land titles, they support peer to peer transactions without needing intermediaries. Additionally, the trustless nature of smart contracts gives confidence to investors via immutable records of ownership while community governance structures provide an ecosystem where value is co-created. These features create confidence in virtual assets, resulting in broad acceptance and the establishment of blockchain as the foundation for all future strategic developments within metaverse real estate.
At the other end of the spectrum, centralized corporate ecosystems are experiencing high levels of growth as large technology companies invest heavily into metaverse platforms that combine infrastructure (hardware & software), development tools and marketplace services. Through the ability to offer an integrated user experience, with enterprise grade security, these companies are attracting many brands looking for fast deployment options. As a result of this growth, many new commercial districts and collaborations are being created, expanding both companies' market reach.
To get detailed segments analysis, Request a Free Sample Report
The North American Region is at the forefront of the Global Metaverse Real Estate Market as it combines a highly developed digital economy, strong technological capabilities and a strong culture for virtual interaction. Numerous major research institutions and universities provide continuous innovations through their immense amount of research and development regarding immersive platforms, while North America's thriving venture community is also providing funding for the new breed of innovative developers. The segment of the consumer population that is accustomed to using advanced gaming platforms and social networking sites has created a significant end-user audience for virtual property experiences. In addition, regulatory frameworks within the United States and Canada promote and support new and innovative processes while also protecting Intellectual Property (IP) rights for creators and innovators in the metaverse. Together, the synergy of innovation, funding, talent, and policy support is what makes North America the premier engine of growth and influence in the metaverse property market place.
Metaverse real estate market analysis in the United States benefits from a concentration of leading tech firms that develop immersive environments and a consumer base accustomed to virtual commerce. Major cities host virtual replicas that attract corporate branding and experiential retail, while developers leverage sophisticated analytics to design high‑value digital assets. Collaborative partnerships between entertainment studios and real‑estate developers further enrich the ecosystem, making the United States a fertile ground for pioneering virtual property concepts and large‑scale community building.
Metaverse real estate market regional forecast in Canada is propelled by a strong creative sector and government incentives that support digital innovation. Toronto and Vancouver emerge as hubs where indie developers and established studios experiment with virtual land, fostering a diverse portfolio of cultural and commercial experiences. Academic institutions contribute research on immersive user experience, while public‑private collaborations encourage the integration of virtual property into broader smart‑city initiatives, positioning Canada as an agile and forward‑thinking participant in the metaverse arena.
Metaverse Real Estate is growing rapidly in the Asia Pacific region because of a unique combination of high rates of mobile access, a cultural preference for playing online games, and massive investments in internet-connected infrastructure. Countries such as South Korea and Japan are at the forefront of developing the most advanced graphics technology and creating an environment where people are used to engaging socially in a virtual world. This makes the need for a way to create a unique and immersive experience with virtual properties an excellent opportunity for the metaverse development community. Companies are building virtual showrooms and brand-specific areas within the Metaverse as part of their corporate strategy. In addition, local start-ups are developing culturally rich virtual environments for their businesses. These initiatives are supported by government policies that encourage digital transformation, as well as support legislation to protect intellectual property, facilitating the creation of new businesses and enabling the development of a vibrant ecosystem in which virtual land developers and traditional real estate developers can thrive together.
Metaverse real estate market regional outlook in Japan draws strength from a legacy of sophisticated gaming culture and a populace highly receptive to digital narratives. Major urban centers are recreated in the virtual domain, offering opportunities for cultural tourism, retail pop‑ups, and anime‑themed districts. Collaboration between entertainment conglomerates and property developers yields immersive experiences that blend heritage with futuristic design. Ongoing support from tech incubators and forward‑looking policy frameworks ensures that Japan remains a pioneering force in crafting high‑quality virtual environments.
Metaverse real estate market penetration in South Korea benefits from a tech‑savvy society and government initiatives that champion digital ecosystems. The nation’s strong broadband infrastructure and enthusiasm for e‑sports translate into a robust user base eager for virtual property ownership. Korean developers specialize in sleek, interactive spaces that integrate music, fashion, and gaming, attracting both domestic and international investors. Strategic partnerships between telecom providers and metaverse platforms further accelerate the creation of richly layered virtual districts, cementing South Korea’s status as a dynamic hub for digital real‑estate innovation.
Capitalizing on their unique artistic heritage, sound regulations, and cooperative efforts at the transnational level, countries in Europe are poised to enhance their position within the metaverse real estate market. Germany, the United Kingdom, and France are examples of countries where world-class design tradition and cutting-edge technology businesses are working together to create engaging virtual environments that highlight cultural richness and experiential elements. Policy makers are encouraging entrepreneurship through legislation designed to protect individual rights surrounding data, thereby creating a sense of security for prospective investors. Centers of academic research provide insight into both immersive storytelling and virtual economies, while consortiums improve the ability to interoperate between different platforms. This combination of cultural assets, clearly defined regulations, and an abundance of technical knowledge places these countries at an advantage over other regions as they establish themselves as leaders in the global metaverse real estate market.
Metaverse real estate industry in Germany is shaped by a precision‑driven engineering culture and a vibrant creative sector that together produce meticulously designed virtual spaces. German cities are reimagined as digital twins, attracting corporations seeking immersive office environments and consumers drawn to heritage‑focused virtual tours. Strong institutional support for research and development fuels innovations in blockchain‑based land ownership and sustainable virtual architecture. Collaborative efforts between automotive giants and digital studios also expand the scope of virtual property, positioning Germany as a hub where technical rigor meets imaginative spatial design.
Metaverse real estate industry trends in the United Kingdom capitalizes on a historic blend of financial acumen and cultural storytelling. London’s virtual skyline hosts high‑profile commercial districts, while heritage sites are rendered for interactive tourism experiences. FinTech expertise supports sophisticated virtual asset trading platforms, encouraging broader participation from investors. Creative agencies collaborate with technologists to embed narrative depth into virtual neighborhoods, enhancing user engagement. Government encouragement of digital entrepreneurship, combined with a thriving talent pool, ensures the United Kingdom remains at the forefront of pioneering metaverse real‑estate ventures.
Metaverse real estate sector in France benefits from a strong artistic legacy and a commitment to digital innovation. Parisian virtual districts blend fashion, cuisine, and art, offering immersive venues for luxury brands and cultural events. French designers prioritize aesthetic elegance, while tech startups explore novel interactions using augmented reality overlays. Collaborative frameworks between cultural institutions and metaverse platforms facilitate the preservation of heritage in digital form. National policies that nurture creative industries and protect intellectual property reinforce France’s role as a leading contributor to the evolving virtual property ecosystem.
To know more about the market opportunities by region and country, click here to
Buy The Complete Report
Expanding Virtual Commerce Ecosystem
Integration Of Real‑World Brands
Regulatory Uncertainty Across Jurisdictions
Technical Limitations And Scalability Issues
Request Free Customization of this report to help us to meet your business objectives.
The competitive landscape of the global metaverse real estate market is characterized by increasing strategic collaborations, platform expansion initiatives, and continuous technological innovation as companies seek to strengthen their positions in the evolving virtual property ecosystem. Market participants are focusing on the acquisition and development of virtual land assets, the integration of blockchain technologies for secure digital ownership, and the creation of immersive user experiences to enhance engagement and value creation. Additionally, companies are leveraging advanced technologies such as artificial intelligence, data analytics, and decentralized finance solutions to improve virtual property management, optimize investment decisions, and differentiate their offerings in an increasingly competitive marketplace.
Top Player’s Company Profile
Recent Developments in the Metaverse Real Estate Market
SkyQuest’s ABIRAW (Advanced Business Intelligence, Research & Analysis Wing) is our Business Information Services team that Collects, Collates, Correlates, and Analyses the Data collected by means of Primary Exploratory Research backed by robust Secondary Desk research. As per SkyQuest analysis, the global metaverse real estate market is propelled primarily by an expanding virtual commerce ecosystem that fuels demand for premium digital land, while the integration of well‑known real‑world brands adds a second boost by validating virtual spaces as commercial venues. The dominant segment remains virtual land parcels, which serve as the foundational canvas for all development, and North America leads the market thanks to its strong tech talent, venture capital and supportive regulatory climate. However, regulatory uncertainty across jurisdictions poses a significant restraint, creating hesitation among investors over property rights and taxation, which could slow adoption.
| Report Metric | Details |
|---|---|
| Market size value in 2024 | USD 1.62 Billion |
| Market size value in 2033 | USD 19.98 Billion |
| Growth Rate | 32.2% |
| Base year | 2024 |
| Forecast period | (2026-2033) |
| Forecast Unit (Value) | USD Billion |
| Segments covered |
|
| Regions covered | North America (US, Canada), Europe (Germany, France, United Kingdom, Italy, Spain, Rest of Europe), Asia Pacific (China, India, Japan, Rest of Asia-Pacific), Latin America (Brazil, Rest of Latin America), Middle East & Africa (South Africa, GCC Countries, Rest of MEA) |
| Companies covered |
|
| Customization scope | Free report customization with purchase. Customization includes:-
|
To get a free trial access to our platform which is a one stop solution for all your data requirements for quicker decision making. This platform allows you to compare markets, competitors who are prominent in the market, and mega trends that are influencing the dynamics in the market. Also, get access to detailed SkyQuest exclusive matrix.
Table Of Content
Executive Summary
Market overview
Parent Market Analysis
Market overview
Market size
KEY MARKET INSIGHTS
COVID IMPACT
MARKET DYNAMICS & OUTLOOK
Market Size by Region
KEY COMPANY PROFILES
Methodology
For the Metaverse Real Estate Market, our research methodology involved a mixture of primary and secondary data sources. Key steps involved in the research process are listed below:
1. Information Procurement: This stage involved the procurement of Market data or related information via primary and secondary sources. The various secondary sources used included various company websites, annual reports, trade databases, and paid databases such as Hoover's, Bloomberg Business, Factiva, and Avention. Our team did 45 primary interactions Globally which included several stakeholders such as manufacturers, customers, key opinion leaders, etc. Overall, information procurement was one of the most extensive stages in our research process.
2. Information Analysis: This step involved triangulation of data through bottom-up and top-down approaches to estimate and validate the total size and future estimate of the Metaverse Real Estate Market.
3. Report Formulation: The final step entailed the placement of data points in appropriate Market spaces in an attempt to deduce viable conclusions.
4. Validation & Publishing: Validation is the most important step in the process. Validation & re-validation via an intricately designed process helped us finalize data points to be used for final calculations. The final Market estimates and forecasts were then aligned and sent to our panel of industry experts for validation of data. Once the validation was done the report was sent to our Quality Assurance team to ensure adherence to style guides, consistency & design.
Analyst Support
Customization Options
With the given market data, our dedicated team of analysts can offer you the following customization options are available for the Metaverse Real Estate Market:
Product Analysis: Product matrix, which offers a detailed comparison of the product portfolio of companies.
Regional Analysis: Further analysis of the Metaverse Real Estate Market for additional countries.
Competitive Analysis: Detailed analysis and profiling of additional Market players & comparative analysis of competitive products.
Go to Market Strategy: Find the high-growth channels to invest your marketing efforts and increase your customer base.
Innovation Mapping: Identify racial solutions and innovation, connected to deep ecosystems of innovators, start-ups, academics, and strategic partners.
Category Intelligence: Customized intelligence that is relevant to their supply Markets will enable them to make smarter sourcing decisions and improve their category management.
Public Company Transcript Analysis: To improve the investment performance by generating new alpha and making better-informed decisions.
Social Media Listening: To analyze the conversations and trends happening not just around your brand, but around your industry as a whole, and use those insights to make better Marketing decisions.
REQUEST FOR SAMPLE
 REQUEST FREE CUSTOMIZATION
Global Metaverse Real Estate Market size was valued at USD 1.62 Billion in 2024 and is poised to grow from USD 2.14 Billion in 2025 to USD 19.98 Billion by 2033, growing at a CAGR of 32.2% during the forecast period (2026-2033).
The competitive landscape in the Global Metaverse Real Estate Market is shaped by rapid consolidation, strategic partnerships, and technology‑driven innovation, as firms race to secure virtual land, integrate blockchain‑based ownership, and offer immersive experiences; recent moves include venture‑backed service providers aligning with crypto investors and platform operators leveraging AI‑enhanced property analytics to differentiate offerings. 'Roblox Corporation', 'Everyrealm Inc.', 'The Sandbox', 'Decentraland', 'Tokens.com Corp.', 'Metaverse Group', 'LandVault', 'SuperWorld', 'Somnium Space', 'Voxels', 'Uplandme Inc.', 'Sky Mavis', 'Wilder World', 'Star Atlas', 'Ertha', 'Netvrk', 'TCG World', 'Illuvium', 'Animoca Brands Corporation Limited', 'Gala Games'
Companies are creating robust marketplaces within virtual worlds, allowing users to purchase digital goods, services, and experiences using cryptocurrency or platform tokens. This development encourages deeper engagement as participants seek to own and customize virtual assets, driving demand for premium digital land and property. As brands invest in storefronts and experiential marketing, the perceived value of metaverse real estate rises, prompting both individual and institutional investors to acquire parcels for future revenue generation and brand presence, and long‑term strategic positioning within evolving digital economies.
Virtual Land Consolidation: Developers are increasingly aggregating parcels across multiple platforms to create contiguous, high‑visibility districts that attract premium tenants and events. This consolidation enables economies of scale in design, infrastructure deployment, and brand storytelling, making virtual neighborhoods comparable to real‑world city centers. As user traffic concentrates in these curated zones, advertisers and experience providers prioritize them, driving higher lease rates and fostering a self‑reinforcing cycle of investment and footfall within the metaverse while reinforcing platform loyalty among diverse digital audiences globally today.
Why does North America Dominate the Global Metaverse Real Estate Market? |@12


Want to customize this report? This report can be personalized according to your needs. Our analysts and industry experts will work directly with you to understand your requirements and provide you with customized data in a short amount of time. We offer $1000 worth of FREE customization at the time of purchase.
Feedback From Our Clients


 USA (+1) 351-333-4748

