Levulinic Acid Market
Report ID: SQMIG15E3179
Report ID: SQMIG15E3179
sales@skyquestt.com
USA +1 351-333-4748
Report ID:
SQMIG15E3179 |
Region:
Global |
Published Date: February, 2026
Pages:
198
|Tables:
90
|Figures:
70


Global Levulinic Acid Market size was valued at USD 28.2 Billion in 2024 and is poised to grow from USD 32.29 Billion in 2025 to USD 95.39 Billion by 2033, growing at a CAGR of 14.5% during the forecast period (2026-2033).
The global levulinic acid market growth is driven because of the increased demand for levulinic acid derivatives, which are admired for their better properties compared to synthetic substitutes.
The increasing demand for products containing levulinic acid will also spur the growth of the market. This spread has been largely caused by the recent emergence of low-cost production technology for levulinic acid, especially in Asia-Pacific and Europe.
In addition, the global levulinic acid sector has undergone development for bio-derived products on account of the green chemistry and biotechnology movements: levulinic acid thus became an important platform molecule. Its multiplicity of possible applications is evident in uses ranging from specialty compound production such as insecticides (DALA and DPA) to fuel additives and vapor pressure lowering for MTHF. The ease of production in this connection boosts its market attractiveness.
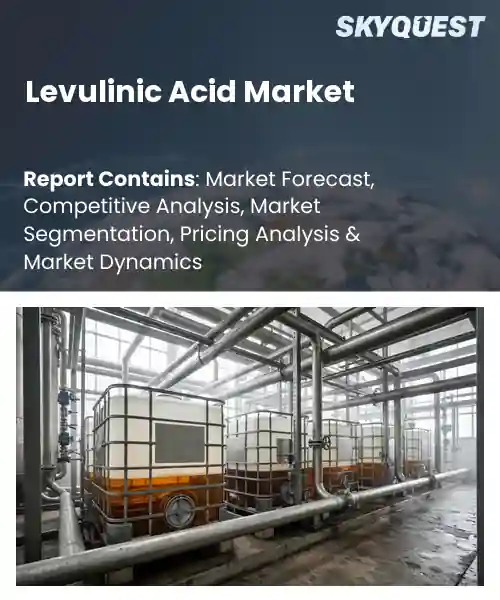
Levulinic acid is an important chemical in many industries. Primarily, levulinic acid is used for the production of pharmaceuticals, cosmetics, and insecticides. It is used as a food additive and also finds sporadic applications in the manufacture of nylon, synthetic rubber, and plastics. In the cosmetics sector, levulinic acid and sodium levulinate are used in about 98 formulations and 295 formulations, respectively. The maximum sodium levulinate concentration allowed in hair dye is 0.62%, while almost 4.5% is the highest concentration ever recorded for levulinic acid.
How Are Green Catalytic Processes Shaping the Future of Levulinic Acid Manufacturing?
The levulinic acid industry is focused on future converting biomass for production of levulinic acid cleanly and sustainably via cellulosics from different feedstocks such as forest wastage or agricultural residues. These various hydrolysis and catalytic processes should count towards their environmentally benign character by increasing yield while reducing ecological impact. The objective of these processes is to improve economic viability by maximizing such efficiencies using the least energy consumption. Solid acid catalysts, continuous hydrolysis systems, and advanced pretreatment designs will achieve this aim. Pilot studies are aimed at solid acid catalyst techniques producing large amounts of levulinic acid from corn fiber biomass in support of sustainable approaches in chemical production-methods. Therefore, these advancements assist in the transition of supply chains from fossil fuel-derived precursors to sustainable, bio-based feedstock, stimulating market developments.
Market snapshot - 2026-2033
Global Market Size
USD 92.55 Million
Largest Segment
Acid Hydrolysis
Fastest Growth
Bio Fine
Growth Rate
9.4% CAGR
To get more insights on this market click here to Request a Free Sample Report
Global Levulinic Acid Market is segmented by Production Process, Application and region. Based on Production Process, the market is segmented into Hydrolysis Process, Biofine Process and Others. Based on Application, the market is segmented into Food Additives, Pharmaceuticals, Cosmetics & Personal Care, Agriculture and Plasticizers. Based on region, the market is segmented into North America, Europe, Asia Pacific, Latin America and Middle East & Africa.
What Advantages Make Acid Hydrolysis the Preferred Production Route for Levulinic Acid?
As per the 2025 levulinic acid market analysis, due to the efficiencies and reliability of the process of levulinic acid production, the acid hydrolysis segment accounted for a significant share of revenue. Celulose a polysaccharide present in all plant matter was broken down by an acid catalyst into simpler components. Its extensive use is attributed to the huge amount of levulinic acid it produces, which is in great demand across several industries, such as food additives, pharmaceuticals, and agriculture.
However, the bio fine segment is expected to grow further at a CAGR of 8.1% during the forecast period. Levulinic acid is produced through the bio-fine process, a relatively recent method wherein biomass is used. The world trend toward more sustainable and environmentally friendly methods of chemical production is a reason for its increasing popularity. Its rapid growth indicates the commercial adoption to provide benefits beyond levulinic acid production, such as a positive environmental impact.
What Makes Levulinic Acid a Preferred Choice for Food Additives?
As per the 2025 levulinic acid market forecast, the food additive segment dominated the market. Due to its flavor-enhancing and preserving abilities, levulinic acid is widely used as a food additive. This stronghold reflects the burgeoning popularity of processed and convenient food systems that rely heavily on these ingredients. In addition, due to the expanding food industry viewed from a food safety and quality perspective by consumers, attaining this big market share may have been very much facilitated.
Whereas the plasticizer category is anticipated to have the highest levulinic acid market share during the projection period. Levulinic acid is a perfect for plasticizer-one that adds plasticity to the material. This patent growth in the demand of this market can be justified to the increasing demand for flexible polyvinyl chloride (PVC) for applications ranging from wire and cable insulations to wall coverings and flooring. Also, levulinic acid would have great room for market growth due to the substitution shift towards bio-based plasticizers that are being advocated by the environment.
To get detailed segments analysis, Request a Free Sample Report
Can Europe Maintain Leadership in Bio‑Based Levulinic Acid Production?
As per the levulinic acid market regional forecast, legislation in favor of bio-based chemicals and strict sustainability objectives render market in Europe thriving under programs such as the EU Green Deal. Stringent environmental regulations are also propagating levulinic acid into applications for green solvents, agrochemicals, and biodegradable plastics. Germany and France are spearheading the movement with massive investments in projects that depend on renewable resources. Bio-fine processing and acid hydrolysis are predicted to grow as well, which should also support growth.
UK Levulinic Acid Market
The demand for levulinic acid is increasing in the UK due to the use of sustainable constituents in food, cosmetics, and specialty chemicals. Bio-fine and acid hydrolysis processes attract investments into higher-purity products, as revenues in the UK are anticipated to grow at a CAGR of about 9.6% from 2025 to 2033. The UK market is expected to steadily grow, concentrated on clean-label and green inputs, especially in food additives and personal care.
France Levulinic Acid Market
The levulinic acid market in France is both organically grown and environmentally driven. The compound lends itself to bio-herbicides, clean food additives, and multipurpose cosmetics, making it just the right substance for those stringent regulations aimed at reducing usage of synthetic pesticides. Demand is spurred further according to the country's focus on innovation within processed foods and medications. It is expected that this tendency will go on, favoring the gradual application of the compound in sectors impacted by regulations.
Germany Levulinic Acid Market
The German levulinic acid industry is based on its status as the leader in chemical manufacture across Europe. Included in herbicides and in environmentally acceptable solvents and valuable derivatives is levulinic acid. Demand is rising in accordance with the EU Green Deal and the Farm to Fork plan, with especially strong demand from industrial biotech and sustainable agrochemicals. It is expected that Germany's strong research and development in green chemistry will continue to promote the use of levulinic acid in specialty formulations and bio-based polymers.
What Factors Are Accelerating Levulinic Acid Adoption in Asia-Pacific?
Asia-Pacific is the largest levulinic acid market, and development of this region is primarily fueled by an established biochemical manufacturing industry and biomass resources in China. Pivotal to the growth is rapid industrialization, increasing agricultural activities, and an augmented demand for eco-friendly chemicals. The agrochemical, personal consumer goods, and biofuels-related applications, are some potentials driving levulinic acid. According to forecasts, APAC will continue to hold the highest market share. Local capacity expansions and supportive legislative frameworks will be key to underpin growth.
China Levulinic Acid Market
Being the highest level of production and consumption, China occupies the Asia-Pacific levulinic acid market. Primarily due to the rich biomass, low production costs, and governmental support to bio-based enterprises, China has demand for sustainable polymers, green solvents, and agrochemical makers. With its strategic orientation towards renewable feedstock, China is set to be the primary driver of the levulinic acid growth in Asia-Pacific.
Japan Levulinic Acid Market
Japan is set to promote levulinic acid within its high-value formulations, which are being increasingly bio-based in pharmaceutical and personal care industries. Environment-friendly plasticizers, solvents, and antimicrobials are pulling the growth. Japan's emphasis on environmental safety and precision agriculture favors levulinic acid use, with rewards expected to be noticed.
What Role Do Government Incentives and R&D Investments Play in North America?
North America, with a very highly developed biochemical background and well-established qualifications in renewable chemicals, stands to itself in the field of levulinic acid. Research investments and programs to promote sustainability, such as the USDA BioPreferred, are leveraged by the USA and Canada to boost demand in food, pharmaceutical, and agricultural sectors. Clean-label formulations and increasing uptake of bio-based products will ensure future uptake in demand.
U.S. Levulinic Acid Market
Research into bio-based chemicals, their use in government-sponsored bio-products, and a multitude of applications-from herbicides and food additives to personal care products, are fueling a levulinic acid industry in the U.S. defined by high consumption and an innovation streak. The levulinic acid demand in the U.S. is expected to steadily grow on the back of massive R&D investments and existing sustainability trends, especially in terms of biofuel additives and specialty chemicals.
Canada Levulinic Acid Market
The levulinic acid market in Canada is growing as manufacturers in the personal care and agrichemical industries move towards more environmentally sound inputs. The growth is also spurred by regulatory backing for renewable chemicals, the increasing use of levulinic acid in clean-label consumer products, and biodegradable herbicides. Investment in green chemistry applications is expected to ensure a continued rise in Canadian demand as sustainability gains the priority.
To know more about the market opportunities by region and country, click here to
Buy The Complete Report
Levulinic Acid Market Drivers
Growing Interest in Biobased Chemicals
Growth of End-Use Industries
Levulinic Acid Market Restraints
Higher Production Costs
Restrictions on Feedstock Quality and Availability
Request Free Customization of this report to help us to meet your business objectives.
A moderately competitive levulinic acid market exists that is populated by both small bio-based companies engaged in the development of bio-based substitutes and large multinational chemical corporations operating established production facilities. The major industry players now give a lot of priority to ramping up production capacity, diversifying products, and building strategic alliances to meet the rapidly increasing demand for all products from the food, cosmetics, agrochemical, and biofuel industries. Competitors in commodity and specialty derivatives are getting more aggressive now as new entrants targeting green technology and specialized formulations appear. Beyond that, the bigger companies can use the network for scale and distribution.
SkyQuest’s ABIRAW (Advanced Business Intelligence, Research & Analysis Wing) is our Business Information Services team that Collects, Collates, Correlates, and Analyses the Data collected by means of Primary Exploratory Research backed by robust Secondary Desk research.
As per SkyQuest analysis, owing to the high demand for bio-based chemicals and the increasing trend toward more eco-friendly products, the levulinic acid market is expected to expand in the years to come. Numerous uses of levulinic acid in medication, agrochemical, biodegradable plastics, biofuels, and personal care items are anticipated to propel growth and probably beyond. Challenges facing the sector include high production costs and the variable quality of biomass as fuel feedstock. The increased use of levulinic acid in various downstream applications, together with the advances in green production technology, is also shaping the market forces, making levulinic acid increasingly competitive with conventional petrochemicals. Continued dominance in the market persists among more established chemical companies given their size and product range. Development in more environmentally friendly value chains is also being contributed by new bioscience companies that have entered the industry with innovative concepts. In essence, as sustainability becomes a greater priority worldwide, levulinic acid is recognized as a very important bio-platform molecule.
| Report Metric | Details |
|---|---|
| Market size value in 2024 | USD 28.2 Billion |
| Market size value in 2033 | USD 95.39 Billion |
| Growth Rate | 14.5% |
| Base year | 2024 |
| Forecast period | 2026-2033 |
| Forecast Unit (Value) | USD Billion |
| Segments covered |
|
| Regions covered | North America (US, Canada), Europe (Germany, France, United Kingdom, Italy, Spain, Rest of Europe), Asia Pacific (China, India, Japan, Rest of Asia-Pacific), Latin America (Brazil, Rest of Latin America), Middle East & Africa (South Africa, GCC Countries, Rest of MEA) |
| Companies covered |
|
| Customization scope | Free report customization with purchase. Customization includes:-
|
To get a free trial access to our platform which is a one stop solution for all your data requirements for quicker decision making. This platform allows you to compare markets, competitors who are prominent in the market, and mega trends that are influencing the dynamics in the market. Also, get access to detailed SkyQuest exclusive matrix.
Table Of Content
Executive Summary
Market overview
Parent Market Analysis
Market overview
Market size
KEY MARKET INSIGHTS
COVID IMPACT
MARKET DYNAMICS & OUTLOOK
Market Size by Region
KEY COMPANY PROFILES
Methodology
For the Levulinic Acid Market, our research methodology involved a mixture of primary and secondary data sources. Key steps involved in the research process are listed below:
1. Information Procurement: This stage involved the procurement of Market data or related information via primary and secondary sources. The various secondary sources used included various company websites, annual reports, trade databases, and paid databases such as Hoover's, Bloomberg Business, Factiva, and Avention. Our team did 45 primary interactions Globally which included several stakeholders such as manufacturers, customers, key opinion leaders, etc. Overall, information procurement was one of the most extensive stages in our research process.
2. Information Analysis: This step involved triangulation of data through bottom-up and top-down approaches to estimate and validate the total size and future estimate of the Levulinic Acid Market.
3. Report Formulation: The final step entailed the placement of data points in appropriate Market spaces in an attempt to deduce viable conclusions.
4. Validation & Publishing: Validation is the most important step in the process. Validation & re-validation via an intricately designed process helped us finalize data points to be used for final calculations. The final Market estimates and forecasts were then aligned and sent to our panel of industry experts for validation of data. Once the validation was done the report was sent to our Quality Assurance team to ensure adherence to style guides, consistency & design.
Analyst Support
Customization Options
With the given market data, our dedicated team of analysts can offer you the following customization options are available for the Levulinic Acid Market:
Product Analysis: Product matrix, which offers a detailed comparison of the product portfolio of companies.
Regional Analysis: Further analysis of the Levulinic Acid Market for additional countries.
Competitive Analysis: Detailed analysis and profiling of additional Market players & comparative analysis of competitive products.
Go to Market Strategy: Find the high-growth channels to invest your marketing efforts and increase your customer base.
Innovation Mapping: Identify racial solutions and innovation, connected to deep ecosystems of innovators, start-ups, academics, and strategic partners.
Category Intelligence: Customized intelligence that is relevant to their supply Markets will enable them to make smarter sourcing decisions and improve their category management.
Public Company Transcript Analysis: To improve the investment performance by generating new alpha and making better-informed decisions.
Social Media Listening: To analyze the conversations and trends happening not just around your brand, but around your industry as a whole, and use those insights to make better Marketing decisions.
REQUEST FOR SAMPLE
 REQUEST FREE CUSTOMIZATION
Global Levulinic Acid Market size was valued at USD 92.55 Million in 2025 and is poised to grow from USD 101.25 Million in 2026 to USD 189.90 Million by 2033, growing at a CAGR of 9.4% during the forecast period (2026-2033).
A moderately competitive levulinic acid market exists that is populated by both small bio-based companies engaged in the development of bio-based substitutes and large multinational chemical corporations operating established production facilities. The major industry players now give a lot of priority to ramping up production capacity, diversifying products, and building strategic alliances to meet the rapidly increasing demand for all products from the food, cosmetics, agrochemical, and biofuel industries. Competitors in commodity and specialty derivatives are getting more aggressive now as new entrants targeting green technology and specialized formulations appear. Beyond that, the bigger companies can use the network for scale and distribution. 'Maroon Group', 'Biofine Technology, LLC', 'Godavari Biorefineries Limited', 'Synvina (joint venture of Avantium & BASF)', 'Levinchem', 'Segetis', 'Solvay', 'ADM (Archer Daniels Midland)', 'Cargill', 'Corbion', 'Green Biologics', 'TCL Bio‑Energy', 'Mitsubishi Chemical', 'Himalaya International'
The driving factor of levulinic acid market growth is the shift to sustainable, bio-based chemicals replacing petroleum-based ones. Levulinic acid is a versatile platform chemical for paints, green solvents, plasticizers, and bio-solvents. Given that government regulations and business sustainability goals tend to drive the pace of adoption, levulinic acid pace will be more rapid than for most of those industries, especially in building, agrochemical, personal care, and food additives. This will spur growth in production.
Advancements in Sustainable Production Technologies: The state-of-the-art sustainable production technologies today are certainly green conversions: such conversions include but are not restricted to enhanced acid hydrolysis, use of heterogeneous catalysts, and continuous biorefinery of systems for high yield, low waste, and low cost for energy use. These advancements in technology are designed to produce levulinic acid by environmentally friendly and less costly ways.
Can Europe Maintain Leadership in Bio‑Based Levulinic Acid Production?


Want to customize this report? This report can be personalized according to your needs. Our analysts and industry experts will work directly with you to understand your requirements and provide you with customized data in a short amount of time. We offer $1000 worth of FREE customization at the time of purchase.
Feedback From Our Clients

 USA (+1) 351-333-4748
