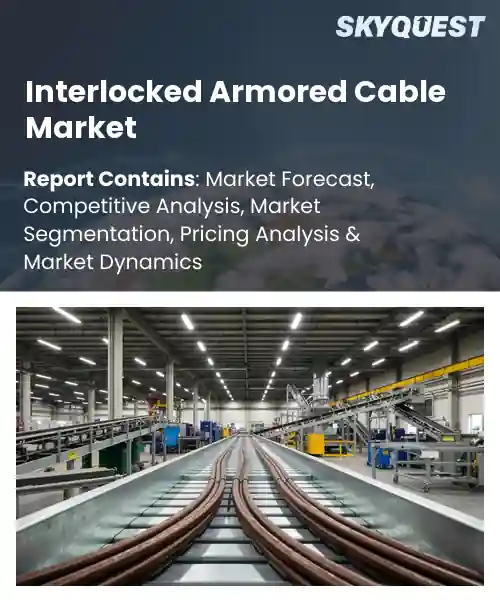
Interlocked Armored Cable Market
Report ID: SQMIG45K2317
Report ID: SQMIG45K2317
[email protected]
USA +1 351-333-4748
Report ID:
SQMIG45K2317 |
Region:
Global |
Published Date: June, 2026
Pages:
157
|Tables:
169
|Figures:
79


Global Interlocked Armored Cable Market size was valued at USD 2.87 Billion in 2024 and is poised to grow from USD 3.04 Billion in 2025 to USD 4.81 Billion by 2033, growing at a CAGR of 5.9% during the forecast period (2026-2033).
The main push behind the global interlocked armored cable market growth is this growing requirement for dependable infrastructure in places that are urbanizing fast, where trench work is not easy and mechanical stress is basically always around. In the last ten years or so, interest sped up because smart-grid rollouts and renewable‑energy projects needed cables that survive soil movement, temperature shifts, and those occasional accidental hits during installation. So it’s still a big deal, and not just for one region.
In addition, the major factor steering the global interlocked armored cable market penetration is the renewable‑energy infrastructure, which is basically fueling demand for cables that can handle rough outdoor conditions without losing function. For example solar setups in deserts, and offshore wind locations, they face heat or cold extremes, corrosive influences and heavy mechanical loads. Interlocked designs help in practice by cutting down downtime, because electrical continuity is kept more reliably. Because of that, cable makers are moving toward better alloys and different sheath structures to meet requirements from international standards, and that makes room for niche suppliers. At the same time, smart‑city projects also need underground data networks with fire resistance plus physical shielding, which increases volume and encourages distributors to sell installation and upkeep services, not only the product itself.
IoT integration is changing renewable energy in a way where cables are expected to do more than one job, they carry power, but they also have to support data transmission, plus remote monitoring, in the background. Interlocked armored cable fits because it brings the mechanical defense needed for tough outdoor setups, and the sturdier construction can include conductive pathways intended for sensor signals. That “two-for-one” setup enables real-time condition monitoring for wind turbines and solar fields, which in turn reduces downtime and maintenance expenses, a lot. Developers are increasingly writing specs that call for these cables so distributed generation sites can connect up to control centers, keeping things safe while also staying connected. And as more assets switch to smart‑grid methods, the need for resilient, IoT-ready interlocked armored cable keeps climbing.
Market snapshot - (2026-2033)
Global Market Size
USD 2.87 Billion
Largest Segment
Fastest Growth
Growth Rate
5.9% CAGR
To get more insights on this market click here to Request a Free Sample Report
The global interlocked armored cable market is segmented based on core type, voltage rating, conductor material, application, end user, and region. Based on core type, the market is segmented into single-core and multi-core interlocked armored cables. Based on voltage rating, the market is segmented into low voltage, medium voltage, and high voltage cables. Based on conductor material, the market is segmented into copper and aluminum conductors. Based on application, the market is segmented into power distribution, control and instrumentation, communication systems, industrial machinery, and renewable energy installations. Based on end user, the market is segmented into oil & gas, manufacturing, mining, construction, utilities, and others. Regionally, the market is analyzed across North America, Europe, Asia-Pacific, South America, and the Middle East & Africa. These segmentation categories reflect the broad adoption of interlocked armored cables across industrial, commercial, utility, and infrastructure applications.
As per the interlocked armored cable market analysis, the Copper conductor segment takes the lead, mostly because copper provides stronger electrical conductivity and better mechanical resilience, which fit with the demanding performance expectations for interlocked armored cable use. Designers tend to pick copper since it’s dependable in rough settings, and manufacturers also like it because the processing know how is already proven which helps cut down production headaches. This overall match is what pushes broad adoption in all installations, and it reinforces copper’s top position in the market. Plus the long term durability matters for critical infrastructure work where operators want low maintenance.
In contrast, aluminium conductor segment is moving the fastest, since aluminium usually costs less and it’s lighter, so it’s easier to manage and install during busy construction schedules. There’s also a bigger focus on cost efficiency and sustainability so designers lean toward aluminium more often. That encourages wider market penetration, and it also opens the door for new product development and supply chain diversification.
According to the interlocked armored cable market forecast, the power transmission and distribution segment is still the dominant one, because it basically acts as the backbone of national electricity systems. That role requires interlocked armored cables that can guard conductors against mechanical harm and outdoor exposure. Utilities care a lot about long term service life and safety, so manufacturers build cables that align with tight regulatory requirements. Since it is so essential, it keeps demand steady, which supports the segment’s strong position in market behavior and operational efficiency.
Meanwhile, the renewable energy installations segment is achieving the highest interlocked armored cable market share. The reason is straightforward: more solar and wind projects are being added, and those installations need flexible yet corrosion resistant interlocked armored cables that can handle changing load patterns. Policy support, plus the fact that renewable technology pricing has been dropping, helps speed up grid integration. As a result, manufacturers are investing in specialized designs that unlock new market paths and push overall market expansion faster.
To get detailed segments analysis, Request a Free Sample Report
As per the interlocked armored cable market regional forecast, Asia Pacific is leading the market, not just because it’s “big” but due to a mix of advanced manufacturing know how, strong needs for tough, resilient infrastructure and proactive take up of safety standards. Engineers here tend to push for high performance cable solutions that handle harsh outdoor conditions, so suppliers are encouraged to get creative with thicker protective designs or what ever works better. Also the supply chains feel closer to major component producers, so iterations happen fast, and production ends up more cost effective . And then, government initiatives that talk about modernizing power grids and expanding industrial parks keep feeding the market with a steady stream of projects that need durable cabling. Add in a culture of technical excellence and a close working relationship between OEMs and end users, and the region basically keeps setting quality benchmarks , which locks in that dominant position on a global scale.
Japan Interlocked Armored Cable Market
The Interlocked Armored Cable sector in Japan thrives on the country’s precision focused engineering approach and its strict safety rules. Local manufacturers pull from deep experience with high voltage applications, delivering cables that satisfy very strict performance expectations. Close relationships with utility providers plus steady upgrades for older infrastructure bring continuous demand. On top of that, shared R&D programs help push next generation materials that improve durability in tough operating environments, which matters a lot.
South Korea Interlocked Armored Cable Market
The Interlocked Armored Cable industry in South Korea is driven by quick industrial growth and a deliberate emphasis on advanced electrical systems. Domestic producers blend new technology with careful quality checks to offer cables meant for both dense city megaprojects and export oriented work. Strong partnerships between research institutions and manufacturers speed up material innovation, and government programs that underline grid reliability also reinforce demand for well protected cabling solutions.
Europe’s rapid expansion in the interlocked armored cable market comes from strict regulatory requirements, a clear push toward sustainable energy networks, and a growing focus on grid resilience. Because renewable generation is being integrated more aggressively, cables have to survive higher mechanical strain and more direct environmental exposure , so manufacturers are adjusting protective architectures and refining the overall build. There’s also collaborative standards development across member states, which supports fairly consistent safety expectations and makes cross border access easier. Meanwhile, investment into updating legacy infrastructure, plus the availability of capable engineering talent, helps accelerate adoption of sturdier cable technologies. Put all together, these elements make Europe feel like a lively growth and innovation hub for protected cabling solutions.
Germany Interlocked Armored Cable Market
The Interlocked Armored Cable Market in Germany benefits from leadership in engineering accuracy, plus a strong manufacturing base. Industry clusters combine sophisticated design workflows with high quality production, resulting in cables that still hit strict performance targets. Energy policies at the national level that prioritize grid stability and renewables integration also sustain demand for armored options. Ongoing cooperation between academic research centers and cable producers keeps material progress moving, so Germany maintains a strong market footing.
United Kingdom Interlocked Armored Cable Market
The Interlocked Armored Cable Market in United Kingdom sees faster growth because infrastructure programs place safety and reliability in the foreground. Policy actions that encourage transmission network modernization create a solid opening for advanced cable uptake. Local suppliers answer with more inventive designs that handle both urban crowding issues , and offshore settings too. Partnerships with utility operators, along with a focus on lowering outage risks, supports quicker market adoption. This is how the United Kingdom turns into one of Europe’s faster growth drivers in protected cabling.
France Interlocked Armored Cable Market
The Interlocked Armored Cable Market in France is starting to rise alongside national efforts aimed at improving grid sturdiness and supporting renewable rollouts. Manufacturers tune product development to match French standards that highlight durability and environmental resistance. Strategic investments in regional transmission upgrades are bringing in fresh demand for armored solutions. At the same time, joint initiatives between research groups and industry players help introduce next generation protective technologies, so France is gradually becoming a more visible contributor within the wider European market scene.
North America strengthens its standing in the interlocked armored cable market, not just by one lever but a mix of technological innovation, wide infrastructure replacement, and a regulatory stance that leans into safety and reliability. In practice, a lot of the region’s big utilities keep running modernization programs that swap out old, tired assets for high performance armored options, and that keeps demand steady. Meanwhile, the leading manufacturers pour money into research, focused on making materials more durable , and also on improving the speed of installation. They also stay aligned with industry expectations, where protecting long term assets is treated as non‑negotiable. On top of that, joint moves between government bodies and private stakeholders keep pushing grid hardening, and even support the integration of renewable resources , so interlocked armored cable solutions stay relevant across the continent.
United States Interlocked Armored Cable Market
In the United States, the interlocked armored cable market is helped along by large scale grid upgrades and the general push for operational safety. American producers use advanced fabrication methods to deliver cables that fit different climate realities and varying load expectations. Regulators apply strict protection requirements, which in turn nudges broad adoption of armored solutions. Plus, strategic collaborations with utility companies , along with funding for joint research, speed up the arrival of newer protective materials. This supports the U.S. position as a market leader.
Canada Interlocked Armored Cable Market
In Canada, the interlocked armored cable market benefits from a national attention on infrastructure resilience in difficult environmental settings. Suppliers often emphasize cables built to endure extreme temperatures and rough terrain, and they do this in line with tough safety guidelines. Government programs tied to the energy transition and expanded northern grid access also keep a reliable flow of projects going, for robust armored solutions. And when research institutions team up with industry participants, specialized product development tends to move faster , while still meeting the specific needs seen in the Canadian market.
To know more about the market opportunities by region and country, click here to
Buy The Complete Report
Increasing Demand for Safety
Advancements in Cable Technology
High Initial Installation Costs
Complex Regulatory Compliance
Request Free Customization of this report to help us to meet your business objectives.
The competitive landscape gets framed by Atkore International, Belden, LS Cable & System, Nexans and Prysmian, all of them tightening their rivalry with technology driven improvement and strategic partnerships, but the market keeps moving too because of the increasing need for dependable underground power setups and also the fact that new little startups show up, pushing better quality thresholds . So overall, there is a blend, where established players stay busy on advanced interlocked cable structures and emerging firms lean into partnership based strategies to pull market share.
Top Player’s Company Profile
Recent Developments in the Interlocked Armored Cable Market
SkyQuest’s ABIRAW (Advanced Business Intelligence, Research & Analysis Wing) is our Business Information Services team that Collects, Collates, Correlates, and Analyses the Data collected by means of Primary Exploratory Research backed by robust Secondary Desk research.
As per SkyQuest analysis, the global interlocked armored cable market is being driven mostly by safety needs, so utilities and industrial firms move toward robust mechanically protected cables . A second driver is the quick rise in renewable energy project work , which then calls for corrosion‑resistant high performance conductors, particularly for offshore wind and desert solar farms . Asia Pacific is currently the top region, largely because of strong manufacturing bases and big infrastructure programs that keep demand steady . The dominant segment remains power transmission and distribution, which reflects how important armored cables are for national grids. Still , high initial installation costs act as a noticeable brake, slowing adoption in projects where budgets are tight and cost-sensitive.
| Report Metric | Details |
|---|---|
| Market size value in 2024 | USD 2.87 Billion |
| Market size value in 2033 | USD 4.81 Billion |
| Growth Rate | 5.9% |
| Base year | 2024 |
| Forecast period | (2026-2033) |
| Forecast Unit (Value) | USD Billion |
| Segments covered |
|
| Regions covered | North America (US, Canada), Europe (Germany, France, United Kingdom, Italy, Spain, Rest of Europe), Asia Pacific (China, India, Japan, Rest of Asia-Pacific), Latin America (Brazil, Rest of Latin America), Middle East & Africa (South Africa, GCC Countries, Rest of MEA) |
| Companies covered |
|
| Customization scope | Free report customization with purchase. Customization includes:-
|
To get a free trial access to our platform which is a one stop solution for all your data requirements for quicker decision making. This platform allows you to compare markets, competitors who are prominent in the market, and mega trends that are influencing the dynamics in the market. Also, get access to detailed SkyQuest exclusive matrix.
Table Of Content
Executive Summary
Market overview
Parent Market Analysis
Market overview
Market size
KEY MARKET INSIGHTS
COVID IMPACT
MARKET DYNAMICS & OUTLOOK
Market Size by Region
KEY COMPANY PROFILES
Methodology
For the Interlocked Armored Cable Market, our research methodology involved a mixture of primary and secondary data sources. Key steps involved in the research process are listed below:
1. Information Procurement: This stage involved the procurement of Market data or related information via primary and secondary sources. The various secondary sources used included various company websites, annual reports, trade databases, and paid databases such as Hoover's, Bloomberg Business, Factiva, and Avention. Our team did 45 primary interactions Globally which included several stakeholders such as manufacturers, customers, key opinion leaders, etc. Overall, information procurement was one of the most extensive stages in our research process.
2. Information Analysis: This step involved triangulation of data through bottom-up and top-down approaches to estimate and validate the total size and future estimate of the Interlocked Armored Cable Market.
3. Report Formulation: The final step entailed the placement of data points in appropriate Market spaces in an attempt to deduce viable conclusions.
4. Validation & Publishing: Validation is the most important step in the process. Validation & re-validation via an intricately designed process helped us finalize data points to be used for final calculations. The final Market estimates and forecasts were then aligned and sent to our panel of industry experts for validation of data. Once the validation was done the report was sent to our Quality Assurance team to ensure adherence to style guides, consistency & design.
Analyst Support
Customization Options
With the given market data, our dedicated team of analysts can offer you the following customization options are available for the Interlocked Armored Cable Market:
Product Analysis: Product matrix, which offers a detailed comparison of the product portfolio of companies.
Regional Analysis: Further analysis of the Interlocked Armored Cable Market for additional countries.
Competitive Analysis: Detailed analysis and profiling of additional Market players & comparative analysis of competitive products.
Go to Market Strategy: Find the high-growth channels to invest your marketing efforts and increase your customer base.
Innovation Mapping: Identify racial solutions and innovation, connected to deep ecosystems of innovators, start-ups, academics, and strategic partners.
Category Intelligence: Customized intelligence that is relevant to their supply Markets will enable them to make smarter sourcing decisions and improve their category management.
Public Company Transcript Analysis: To improve the investment performance by generating new alpha and making better-informed decisions.
Social Media Listening: To analyze the conversations and trends happening not just around your brand, but around your industry as a whole, and use those insights to make better Marketing decisions.
REQUEST FOR SAMPLE
 REQUEST FREE CUSTOMIZATION
Global Interlocked Armored Cable Market size was valued at USD 2.87 Billion in 2024 and is poised to grow from USD 3.04 Billion in 2025 to USD 4.81 Billion by 2033, growing at a CAGR of 5.9% during the forecast period (2026-2033).
The competitive landscape is shaped by Atkore International, Belden, LS Cable & System, Nexans and Prysmian, each intensifying rivalry through technology innovation and strategic collaborations, while the market’s growth is driven by rising demand for reliable underground power infrastructure and the emergence of innovative startups that push quality standards. Recent activity shows a mix of established players and emerging firms focusing on advanced interlocked cable designs and partnership models to capture market share. 'Prysmian S.p.A.', 'Nexans S.A.', 'Southwire Company, LLC', 'Encore Wire Corporation', 'Belden Inc.', 'Leoni AG', 'Atkore Inc.', 'Anixter International Inc.', 'KEI Industries Limited', 'Polycab India Limited', 'Finolex Cables Limited', 'Havells India Limited', 'RR Kabel Limited', 'NKT A/S', 'LS Cable & System Ltd.', 'Furukawa Electric Co., Ltd.', 'Sumitomo Electric Industries, Ltd.', 'Bahra Electric Company', 'Riyadh Cables Group Company', 'Elsewedy Electric Co.'
The growing emphasis on occupational safety across industrial sectors drives adoption of interlocked armored cable systems, as they provide reliable protection against mechanical damage and electrical hazards. By integrating robust shielding with fail‑safe interlocking mechanisms, these cables reduce downtime and maintenance costs, enhancing overall plant reliability. Companies prioritize such solutions to comply with stringent safety regulations and to protect critical infrastructure, thereby creating consistent demand that fuels market expansion and encourages manufacturers to innovate advanced product offerings for global markets.
Renewable Energy Integration Push: The surge in renewable generation projects is driving demand for interlocked armored cables that can reliably link offshore wind farms, solar arrays, and battery storage units to mainland grids. Utilities and developers prioritize cable designs offering superior corrosion resistance, mechanical robustness, and low maintenance to withstand harsh marine and desert environments. Consequently, manufacturers are accelerating product innovation and forging partnerships with renewable EPC firms, positioning interlocked armor solutions as the preferred conduit for clean‑energy transmission networks worldwide and long‑term reliability.
Why does Asia Pacific Dominate the Global Interlocked Armored Cable Market? |@12


Want to customize this report? This report can be personalized according to your needs. Our analysts and industry experts will work directly with you to understand your requirements and provide you with customized data in a short amount of time. We offer $1000 worth of FREE customization at the time of purchase.
Feedback From Our Clients


 USA (+1) 351-333-4748

